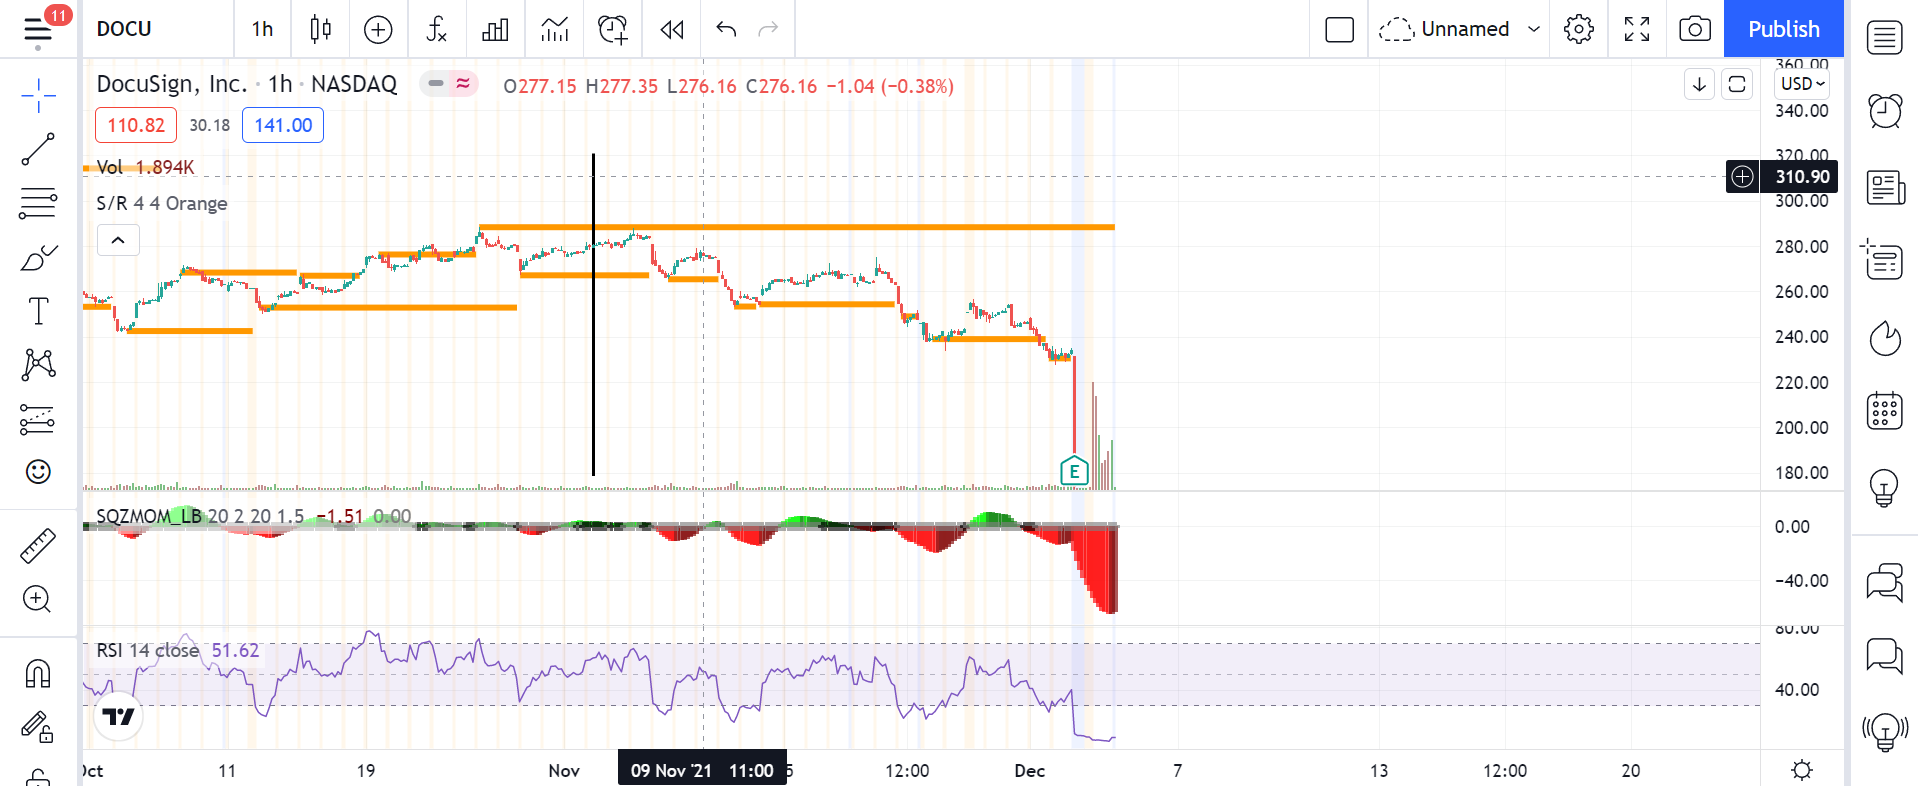
In researching coming earnings plays I decided to look at possible correlations between the drops experienced by stocks inflated by COVID and seemingly have found one:
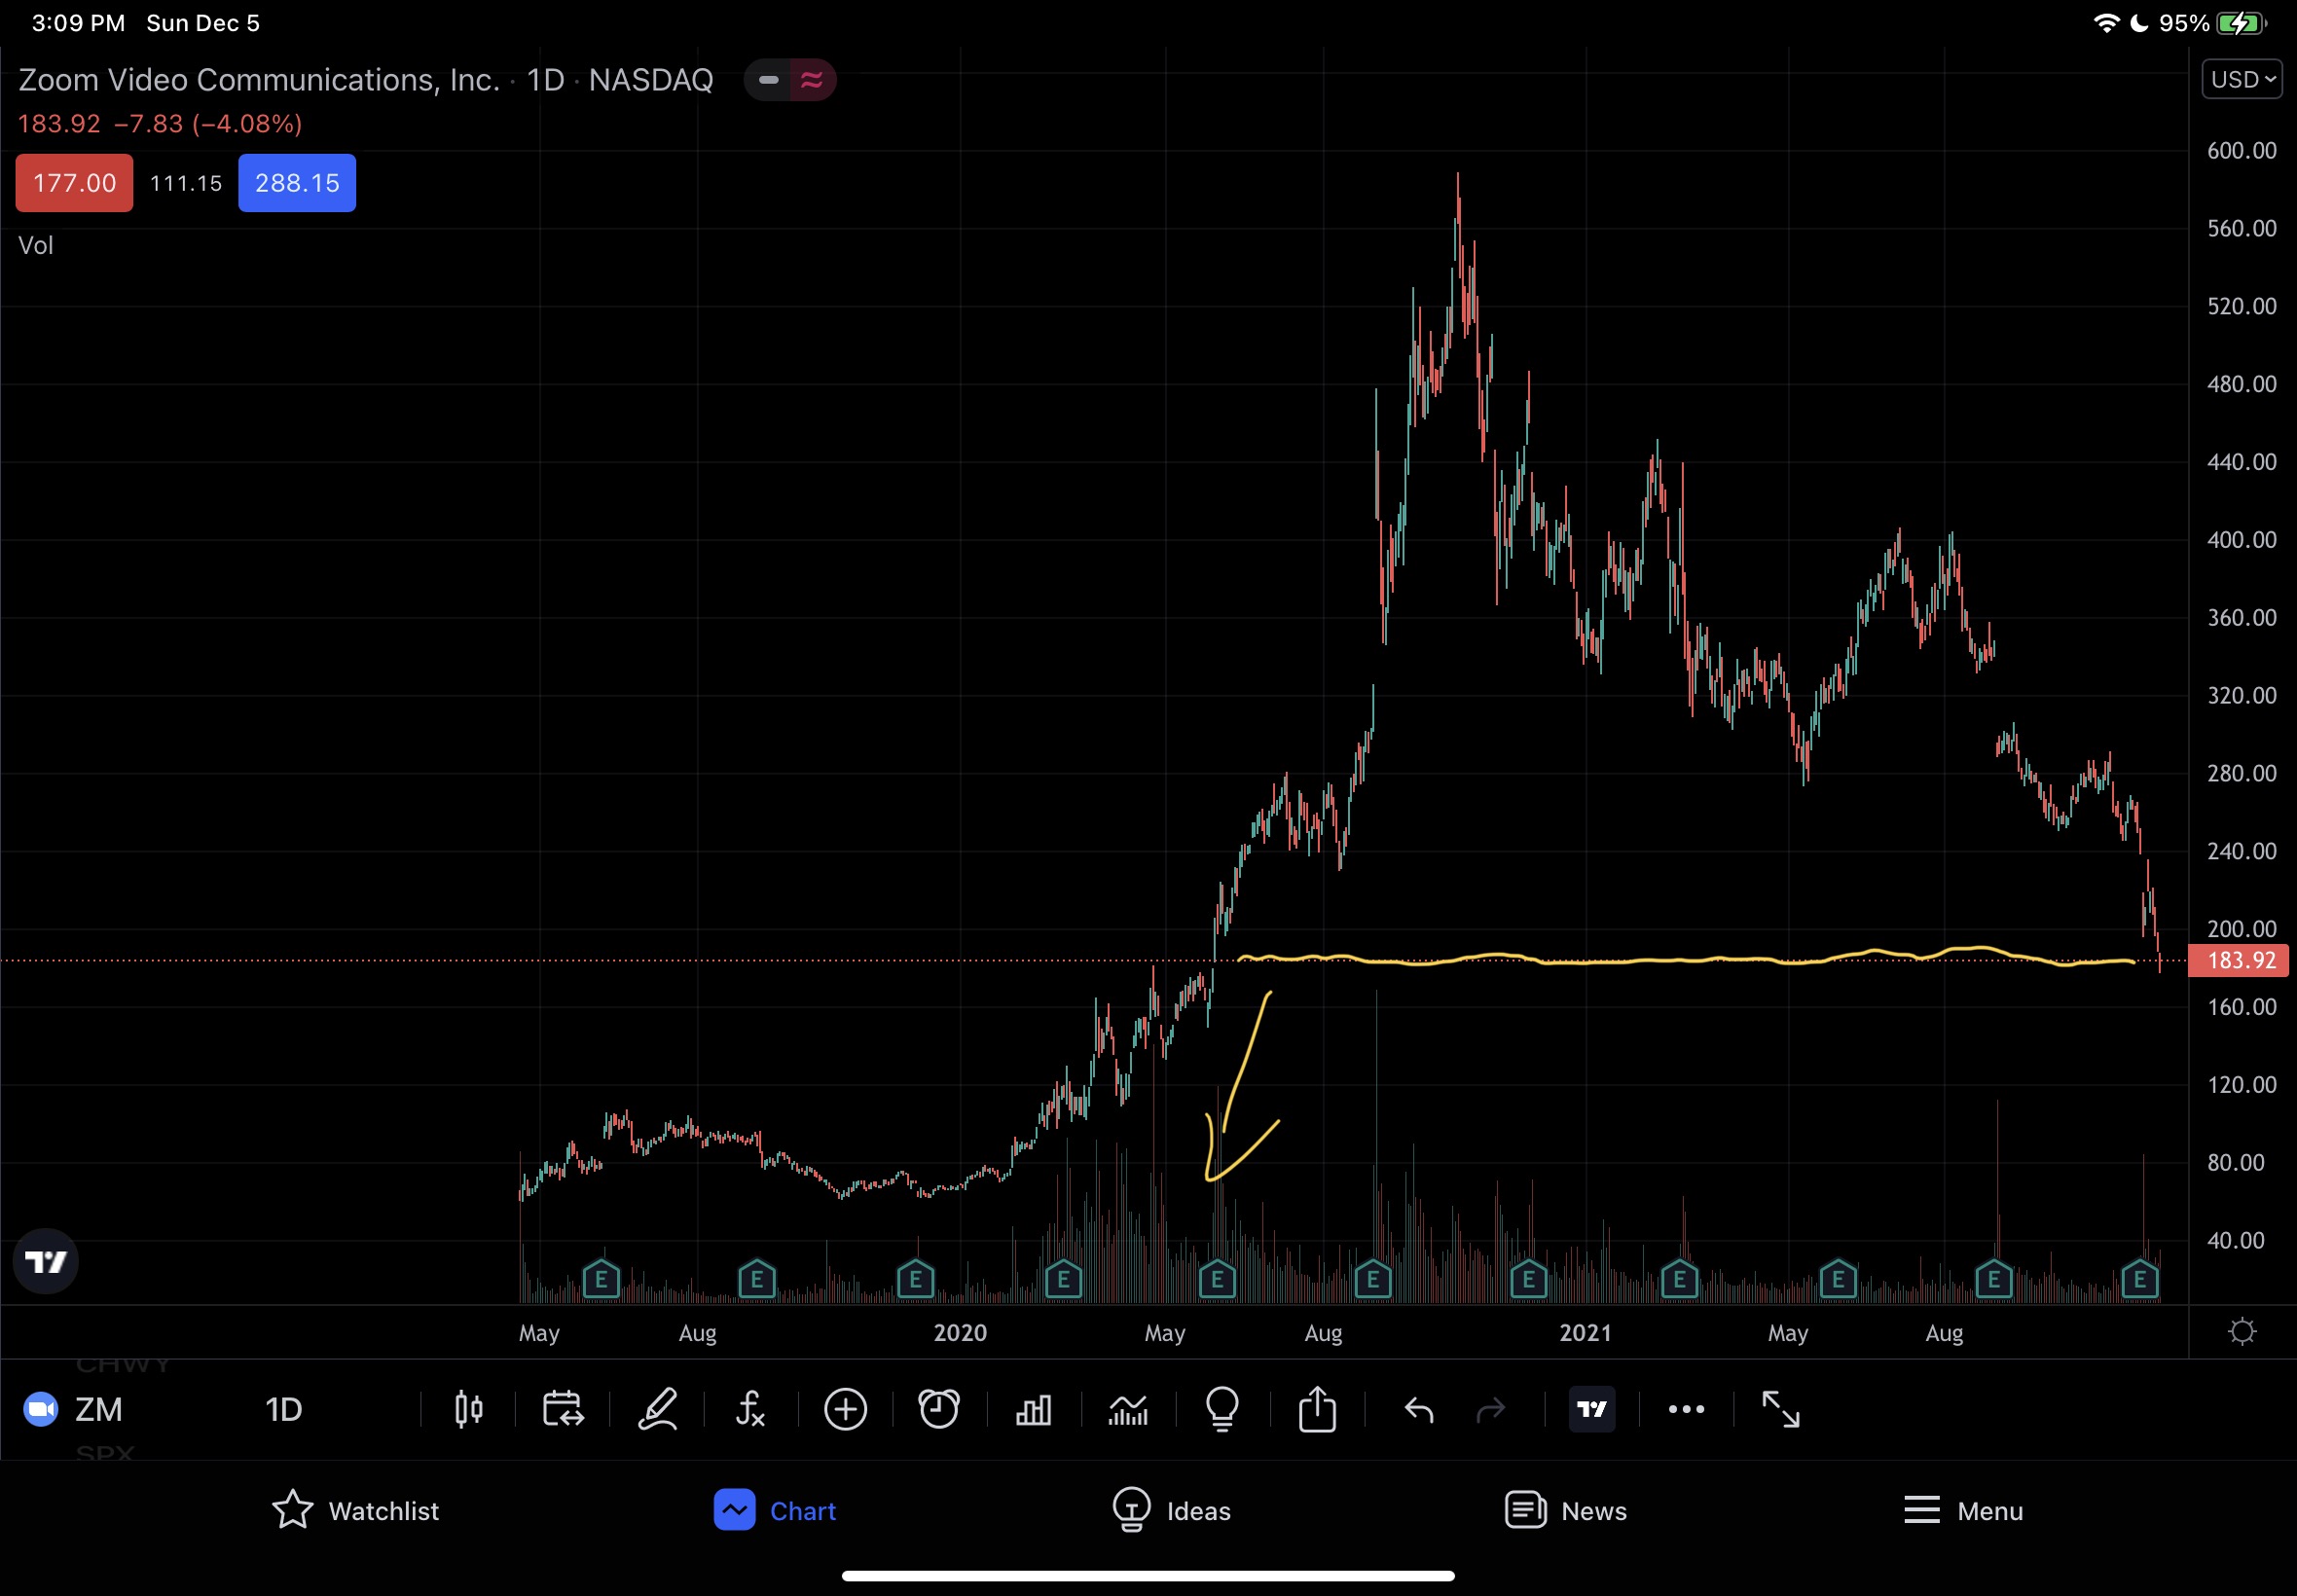
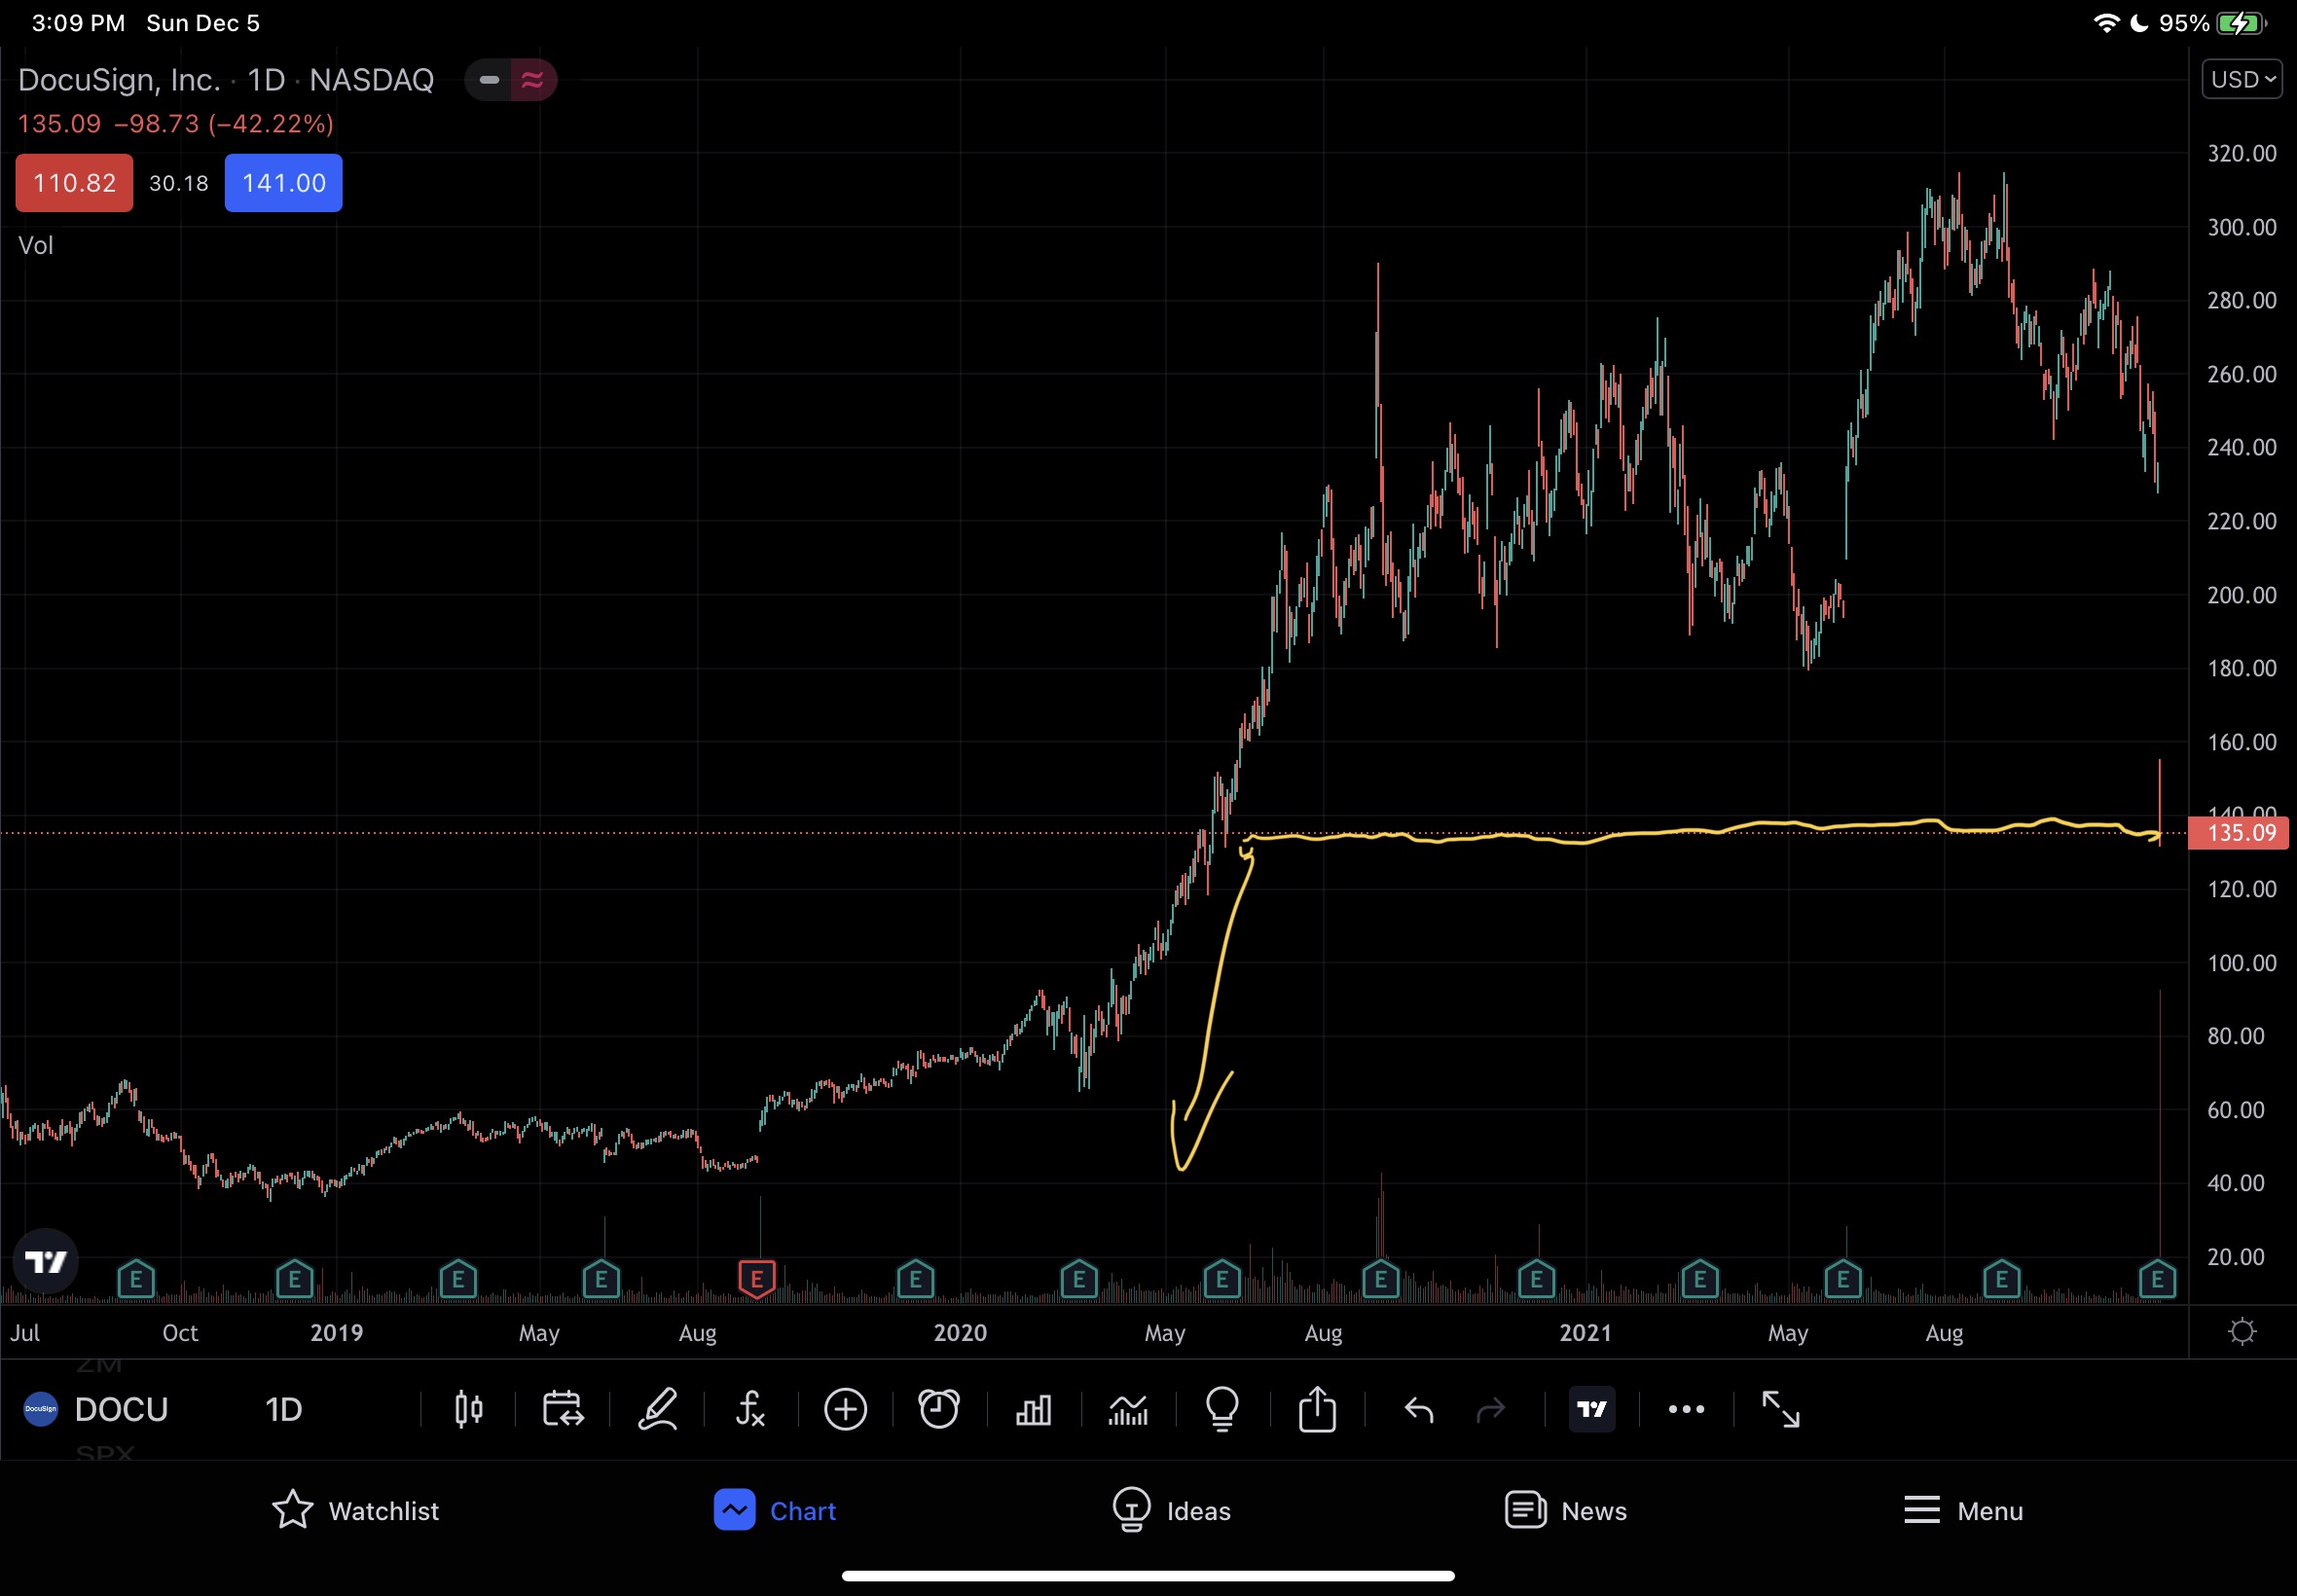
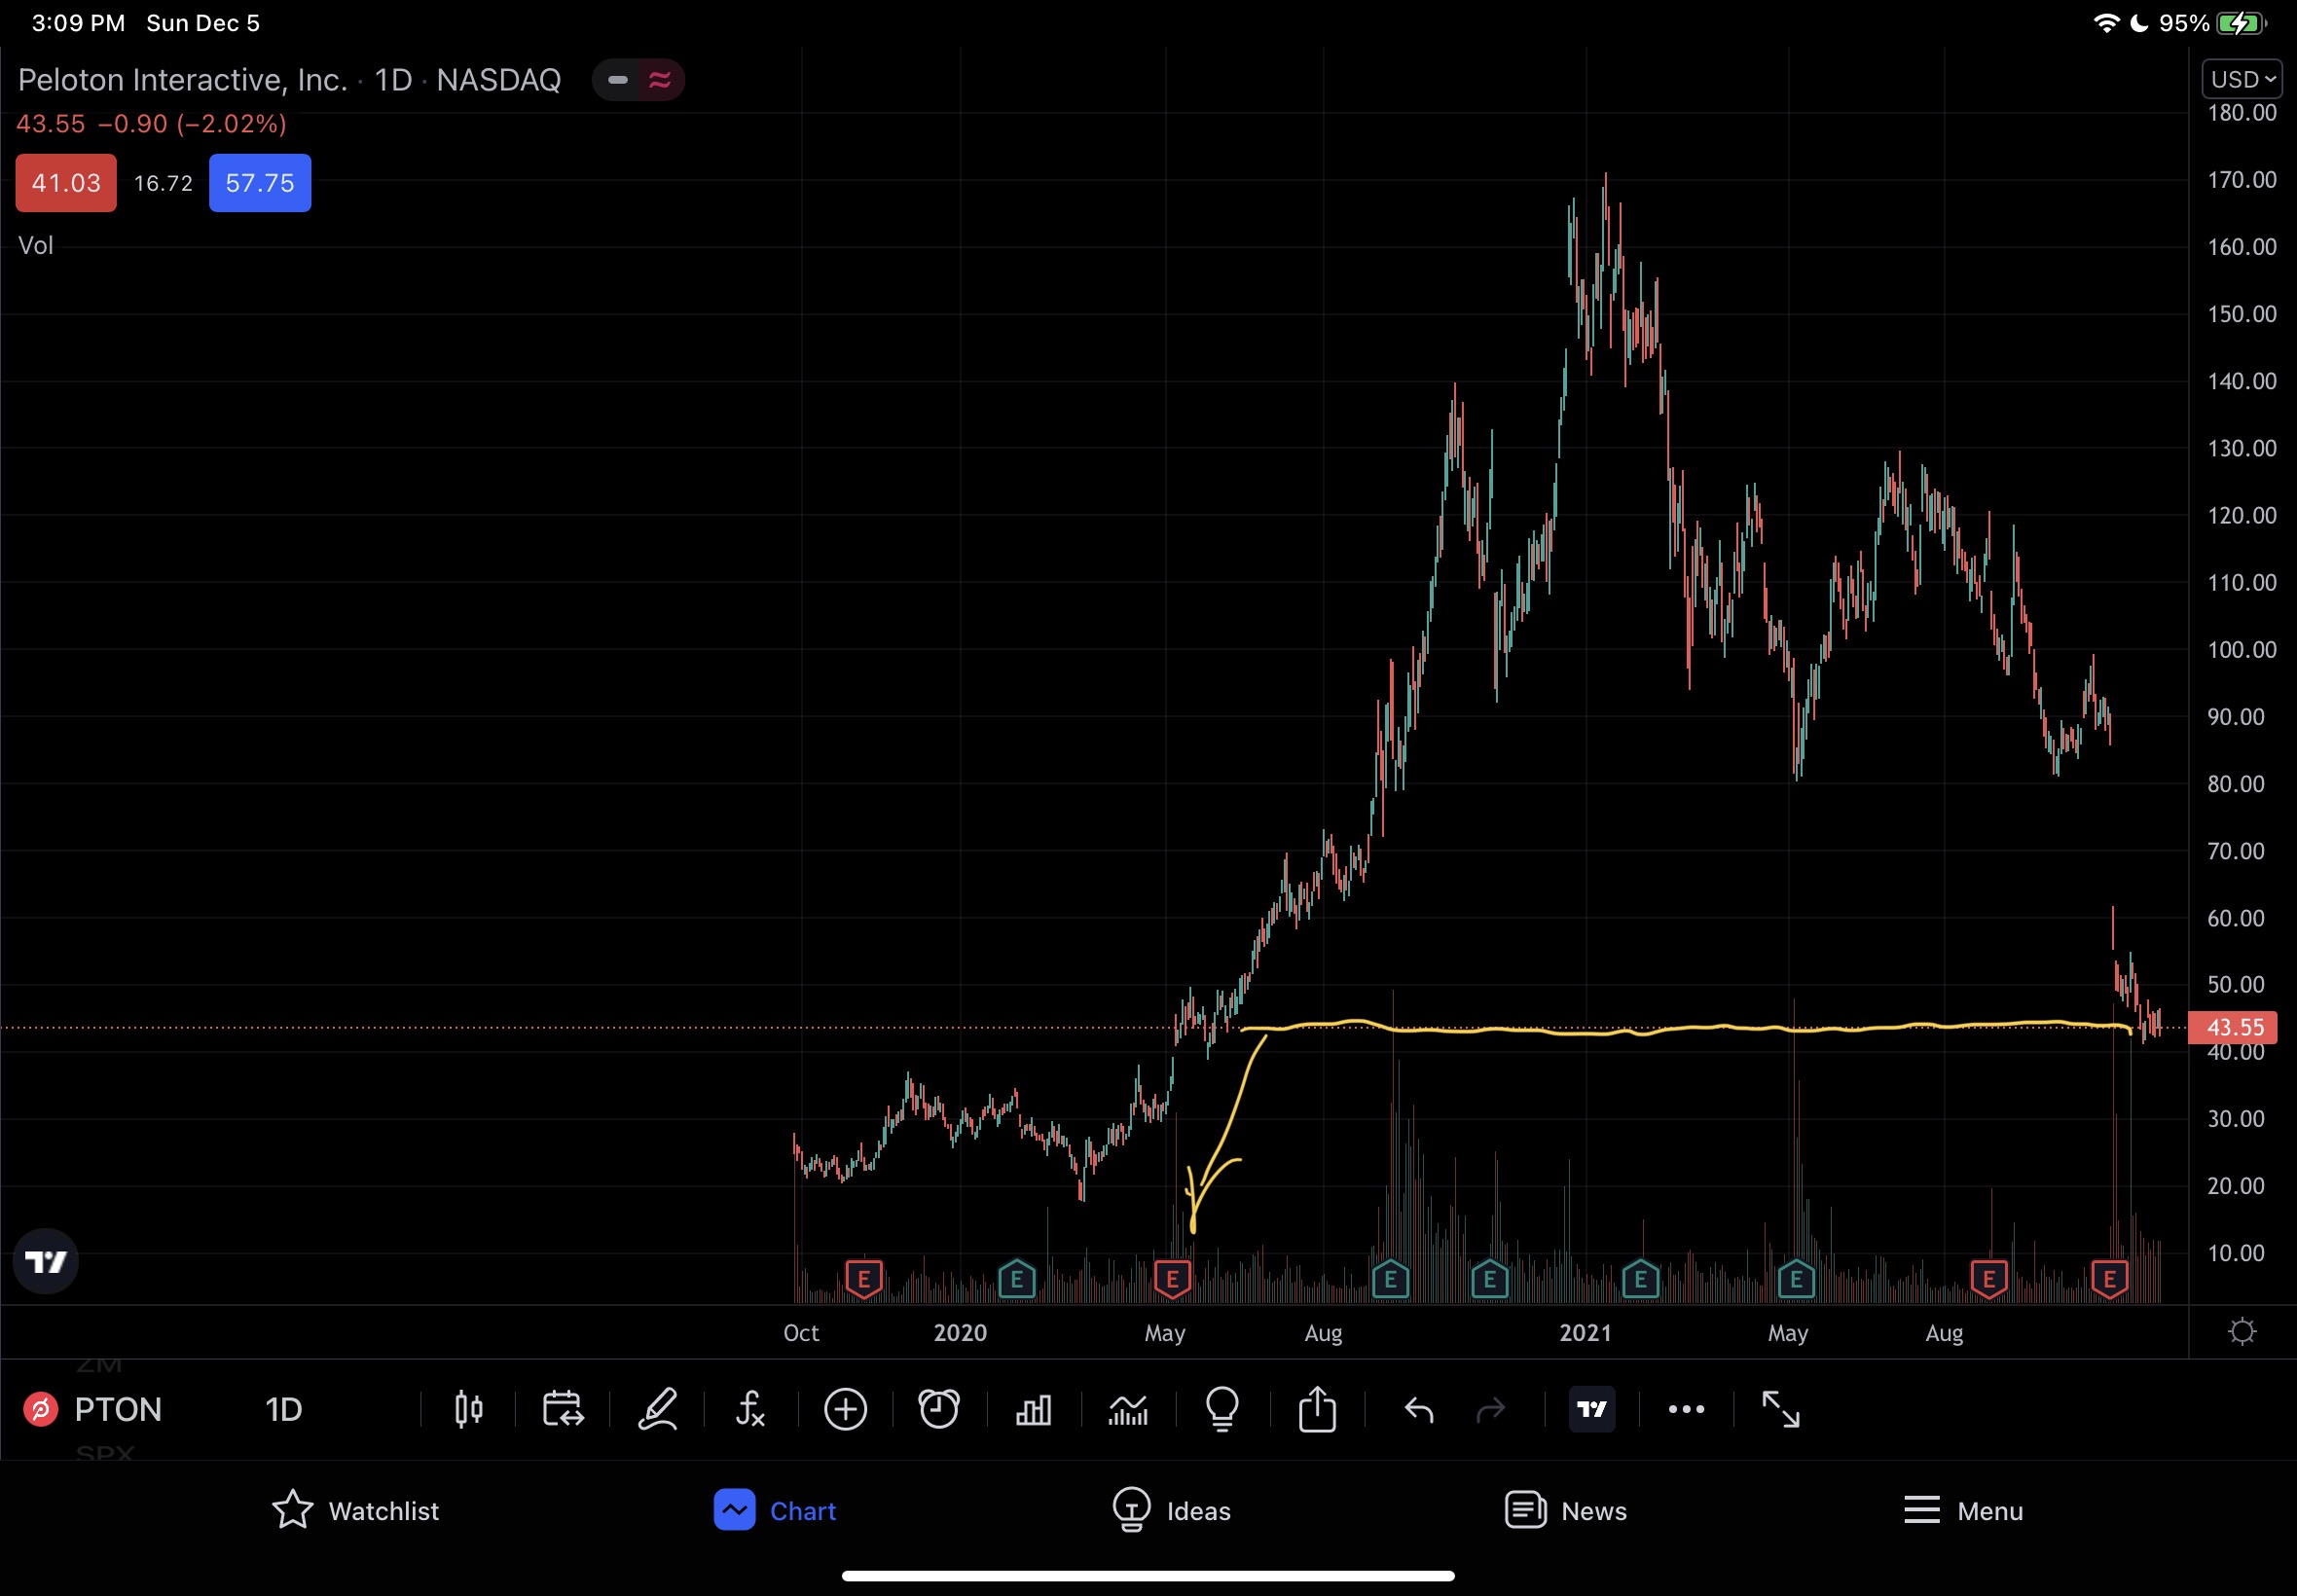
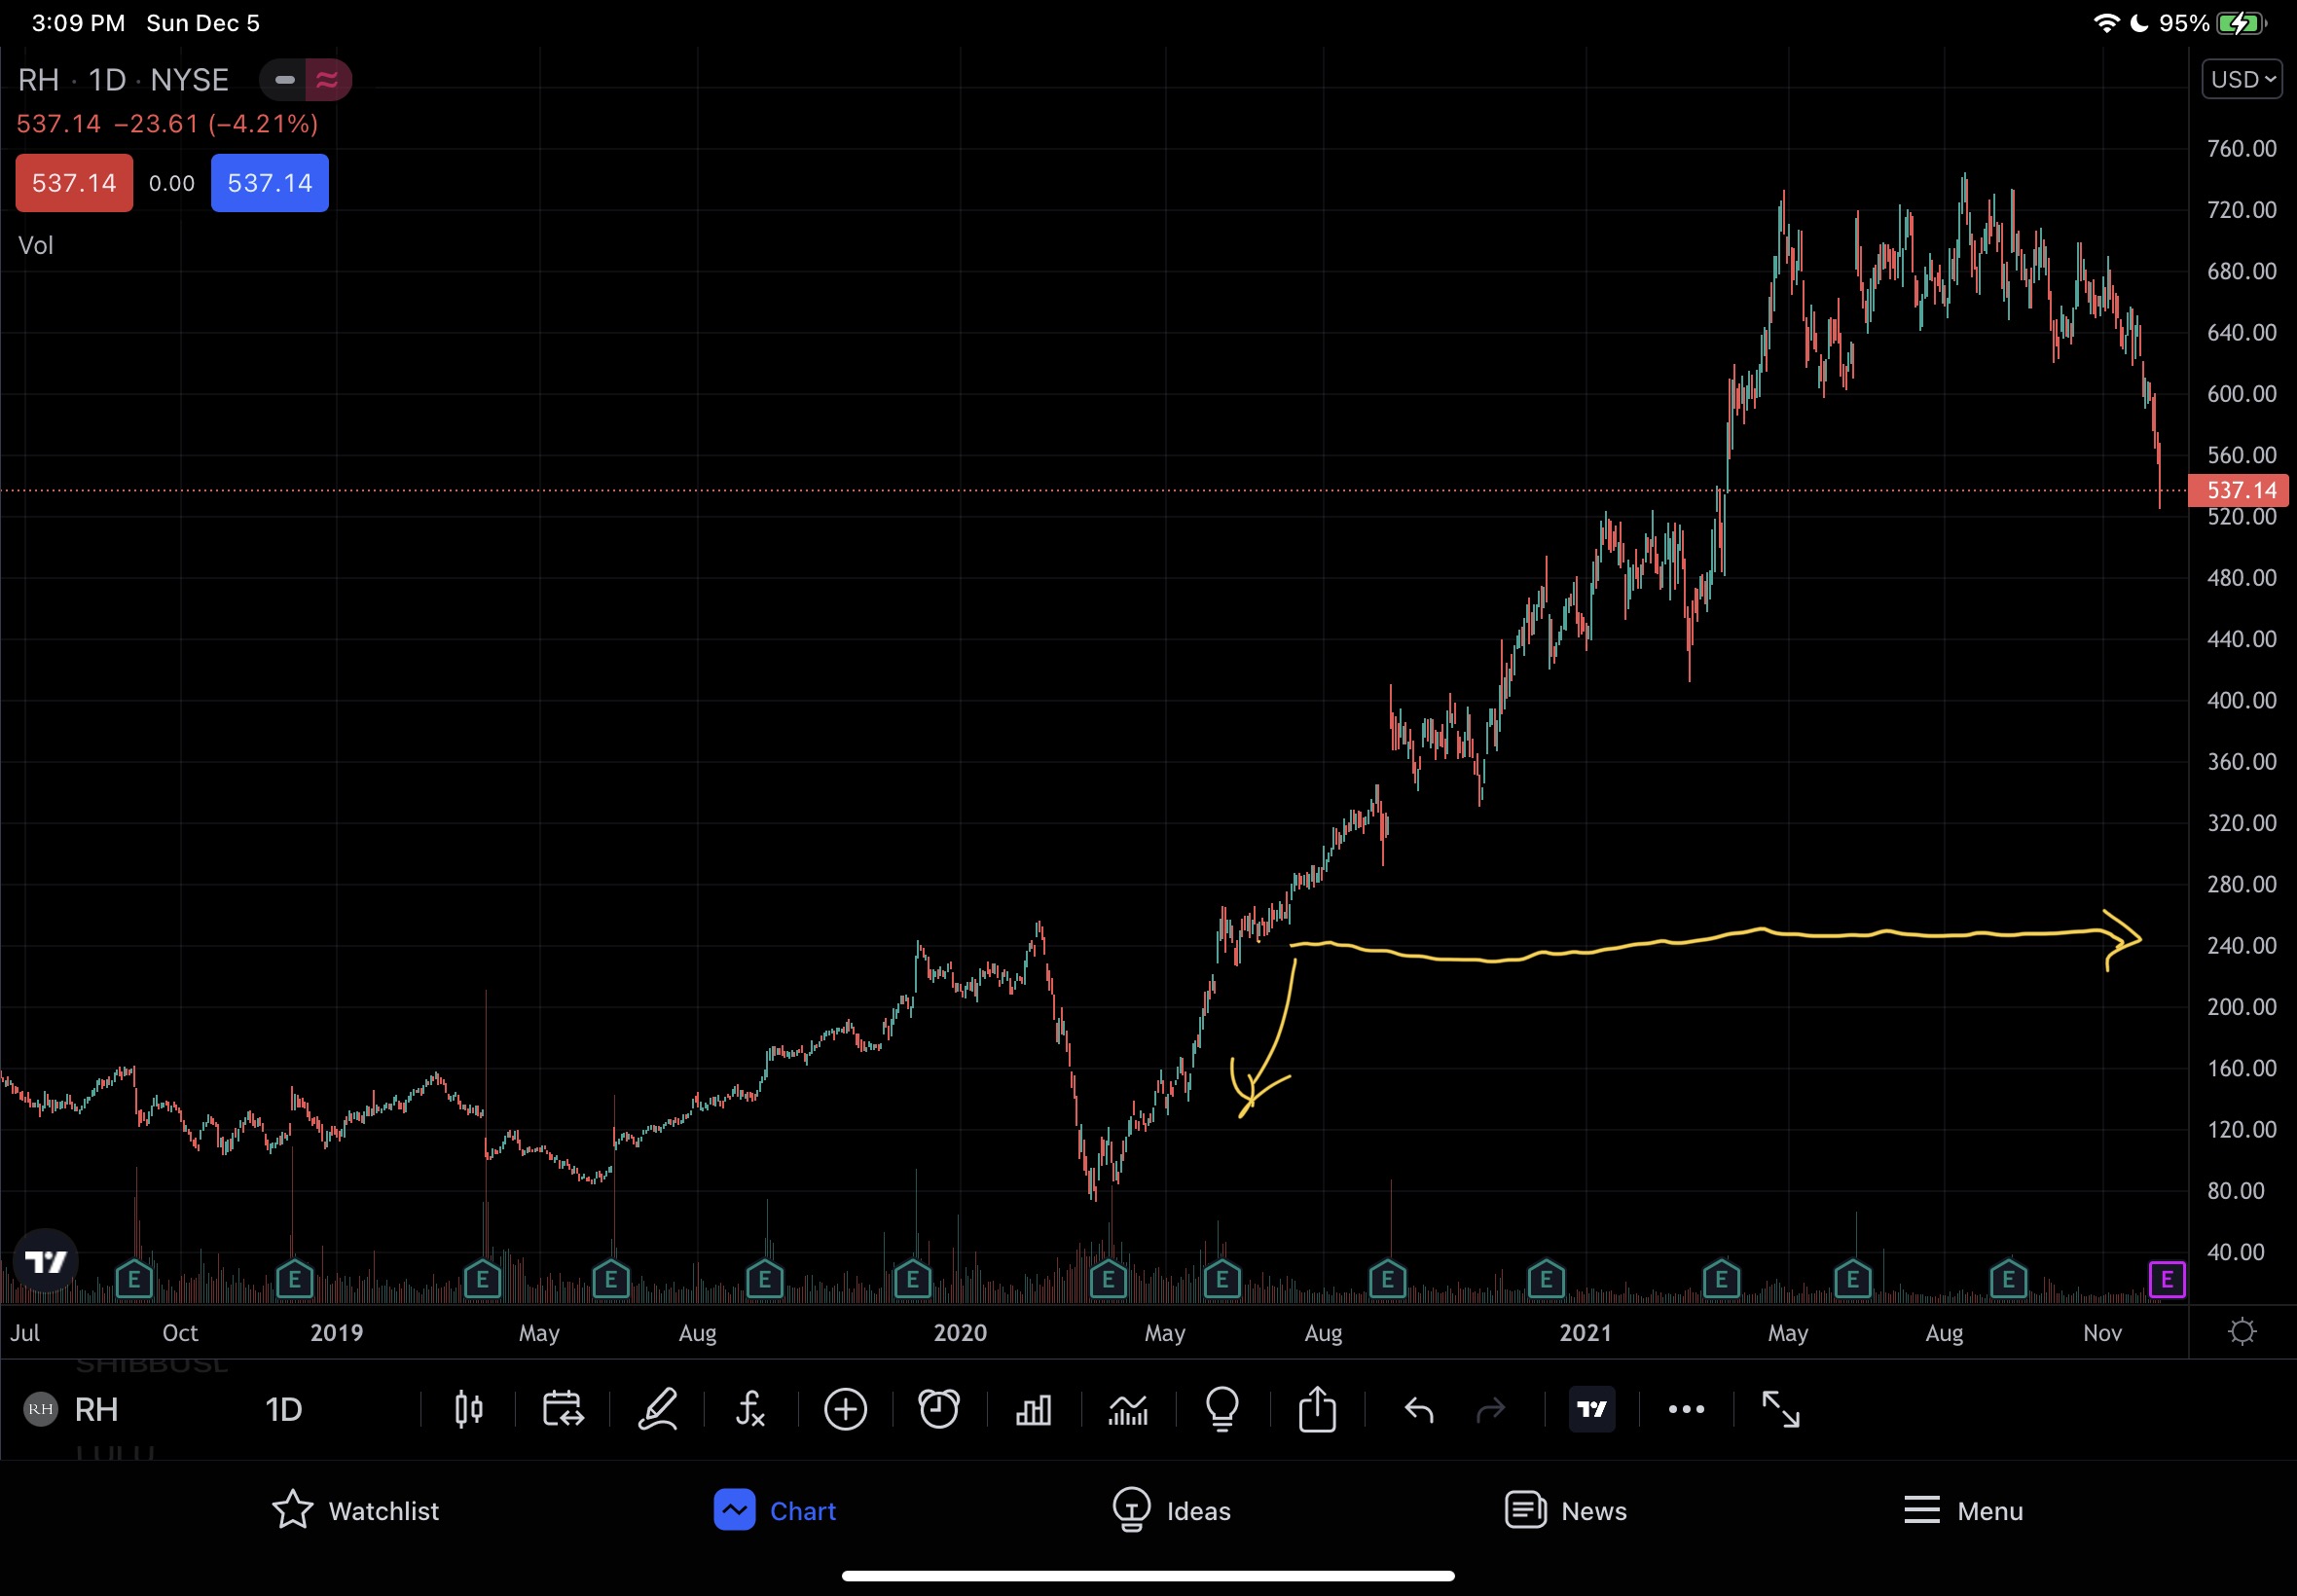
Above are PTON, DOCU & ZM. All three make up the “notable” COVID corrections and they all seem to have fallen to their May 2020 valuation. The cause of this is probably … as with all things … algos. I’d figure that when the selloffs are triggered, algo/institutional buy orders are likely congregating at this historical point of valuation. If we apply this level to CHWY, LULU & RH we get the following:
Also, as discussed briefly in discord. Something of note here is that these companies are all significantly overvalued currently. While they are possibly still great companies that are doing well, that honestly isn’t going to matter in all likelihood as every one of these was already inflated at the points we’re looking for them to fall to.
LULU for example ran from $200 to $240 in the months leading up to the COVID drop in April 2020, an increase of 20%.
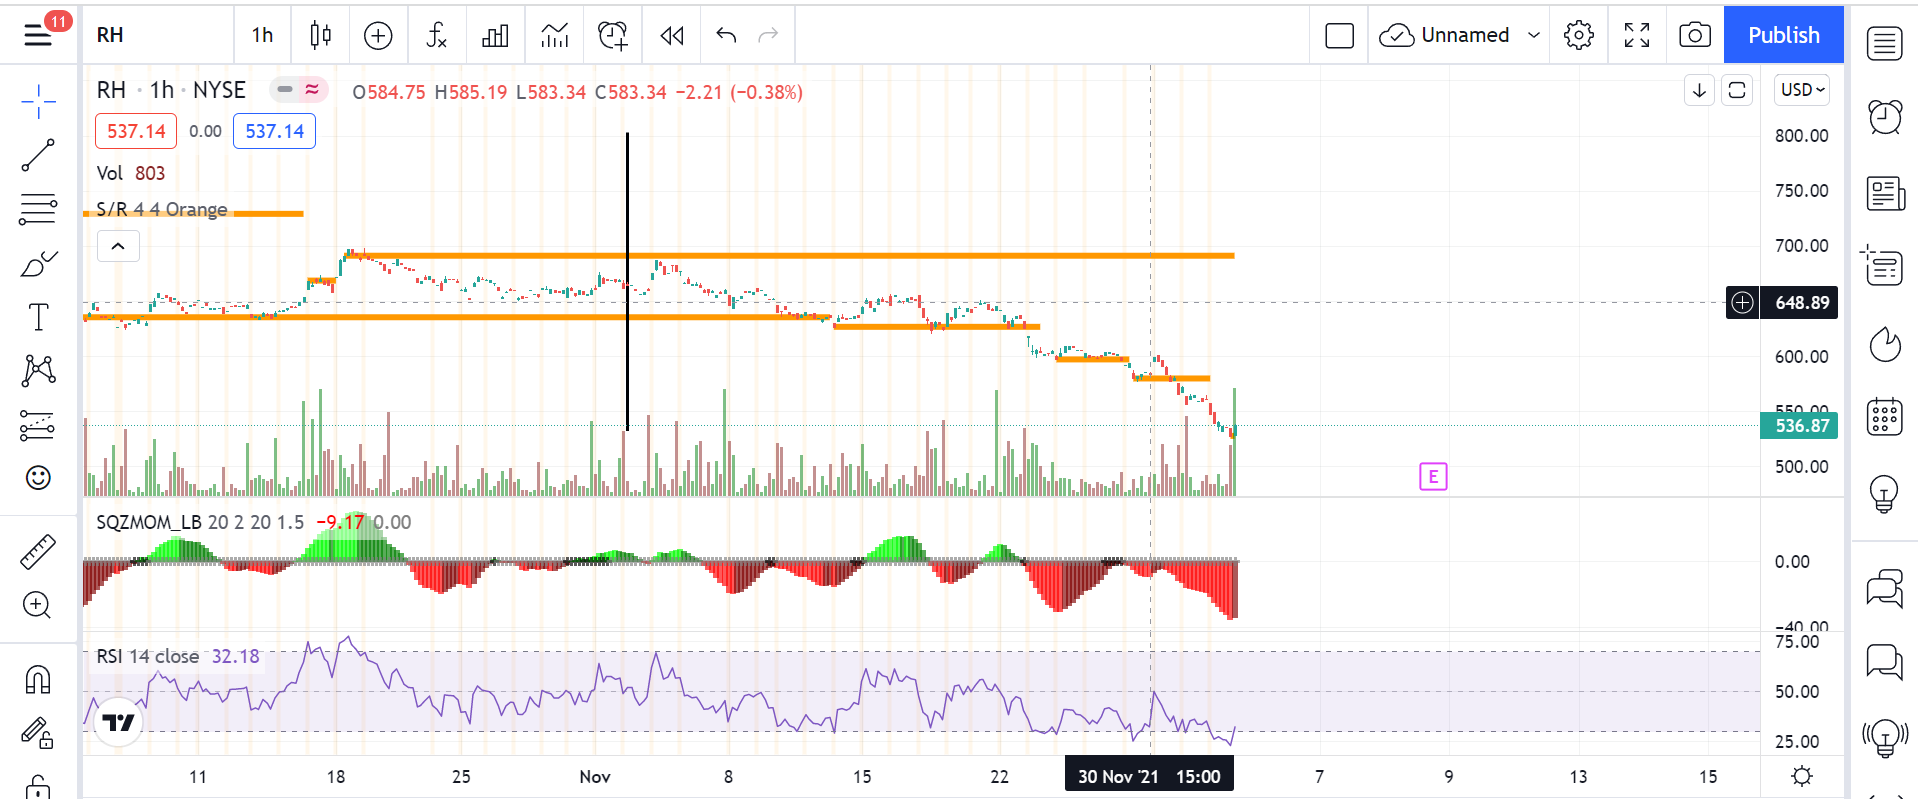
RH $170 to $255, increase of 50%.
CHWY from $29 to $50, increase of 72%.
It’s reasonable to assume that current growth may already be priced in at these levels and the valuation coming off was simply based on potentials of the pandemic.
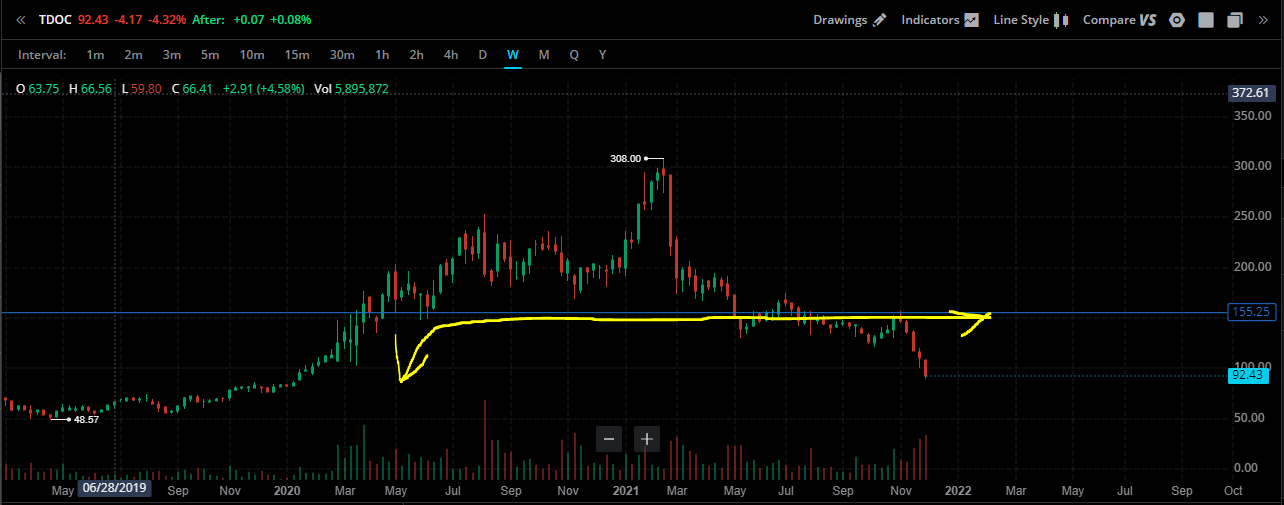
I found another correlation with a company that popped with COVID, TDOC. Teledoc beat earnings and and Revenue, and fell after earnings. It went back to its May 2020 level, so maybe idiot science has some merit to it.
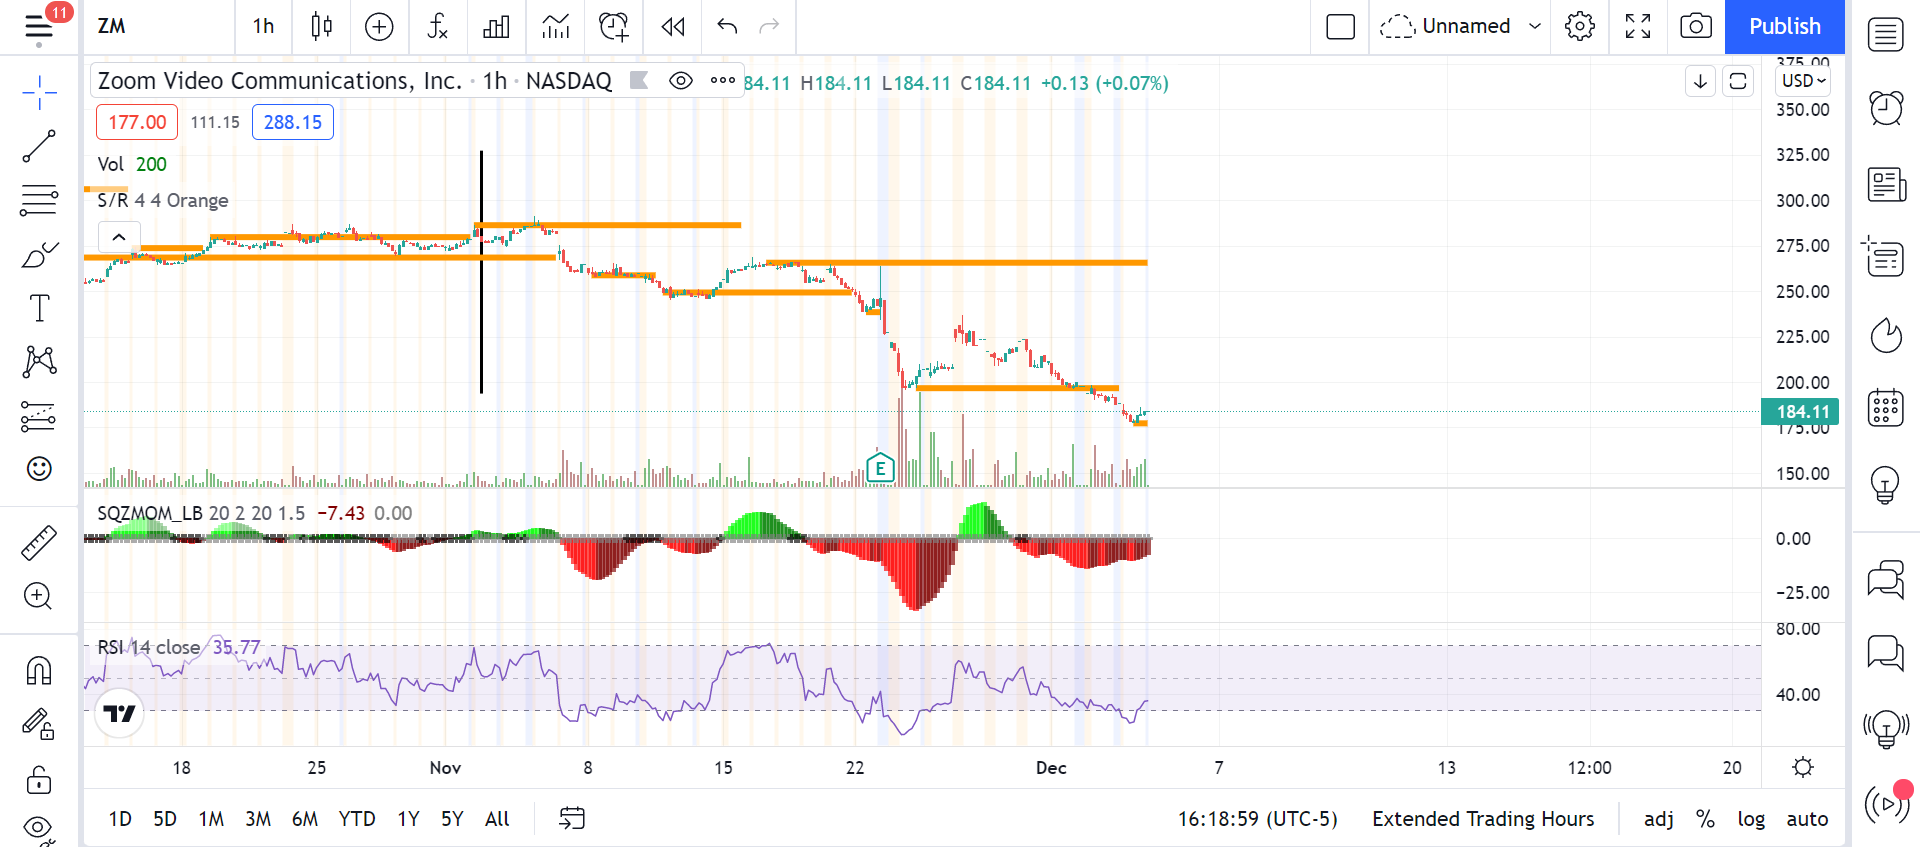
To add on top of the former correlations. CHWY and LULU do have correlation here. Since they are in the same boat of the COVID-inflated stocks, I assume that they will act accordingly and in similar way. I may be absolutely wrong, too. Lastly, below is ZM chart, which looks close to DOCU with regards to support levels. Take it or leave it !
CRWD was another loser, had earnings the other day and missed pretty bad. It’s high was in the $270s. Currently trading at $195, could be headed back to sub 100.
Crowdstrike Holdings (CRWD) reported 3rd Quarter October 2021 earnings of $0.05 per share on revenue of $380.1 million. The consensus earnings estimate was $0.11 per share on revenue of $363.5 million. The Earnings Whisper number was $0.14 per share. Revenue grew 63.5% on a year-over-year basis.
The company said it expects fourth quarter non-GAAP earnings of $0.19 to $0.21 per share on revenue of $406.5 million to $412.3 million. The current consensus earnings estimate is $0.16 per share on revenue of $399.95 million for the quarter ending January 31, 2022.
Undeleting this, since it’s still useful to look at. However, there isn’t a general rule here and you need to consider your entries with the overall price action of the underlying. December 6th was a really bad day for put entries, as all your graphs are showing. Not every put would have made money if you bought it two weeks out. Asking you to try it out isn’t being dismissive, you can do something on ToS or look at other historical data to see if what you are proposing is accurate.