Blind Earnings Trades - Observations on Volumes and Quick Fingers

[size=5]Overview[/size]
With RH behaving like a stupid overvalued piece of crap, missed opportunities on earnings plays, and earnings being an inscrutable mishmash of binary facts and emotional nonsense, I started digging into behaviors of tickers prior to after-hours earnings calls to try to identify measurable trends within tickers that may lend some insight into how a stock may move with earnings.

Namely I wanted to find out how we can avoid losses after astounding DD. How can so many people pour their minds into earnings theories but get trumped by either something stupid said in earnings call, misses on guidance, misses on goals, etc.?

I found interesting correlations, and cannot stress the following enough:

  • This is gambling, and arguably a stupid way to gamble.
  • This is the byproduct of frustration with earnings and nothing else.
  • Doing DD and looking for opportunities outside of earnings seems to still be more profitable than trying to guess earnings.
  • This is not financial advice, strategy advice, or anything similar. These are the musings of an idiot who likes shapes and patterns.

Theory
Insider information is unavoidable and will be used to inform trading practices regardless of its legality. We can gain enough insight by watching volumes prior to earnings to predict the outcome of the earnings call, however it requires quick decision making in the final 5 minutes of trading. An important warning is that while this seems predictable directionally, it does not seem to be an accurate gauge of velocity. I cannot estimate how much a stock will move with this method.

Findings
There is a very short period, oftentimes less than 15 minutes, prior to market close in which we may be able to discern which direction the stock will move after earnings. I have reviewed historical earnings data and found that this method is roughly 80% accurate. Generally, stocks that have higher volume have better showings in the final minutes of closing, so while the low volume stocks are more volatile, higher volumes may be a better target for this kind of strategy.

[size=5]Strategy[/size]
Timing
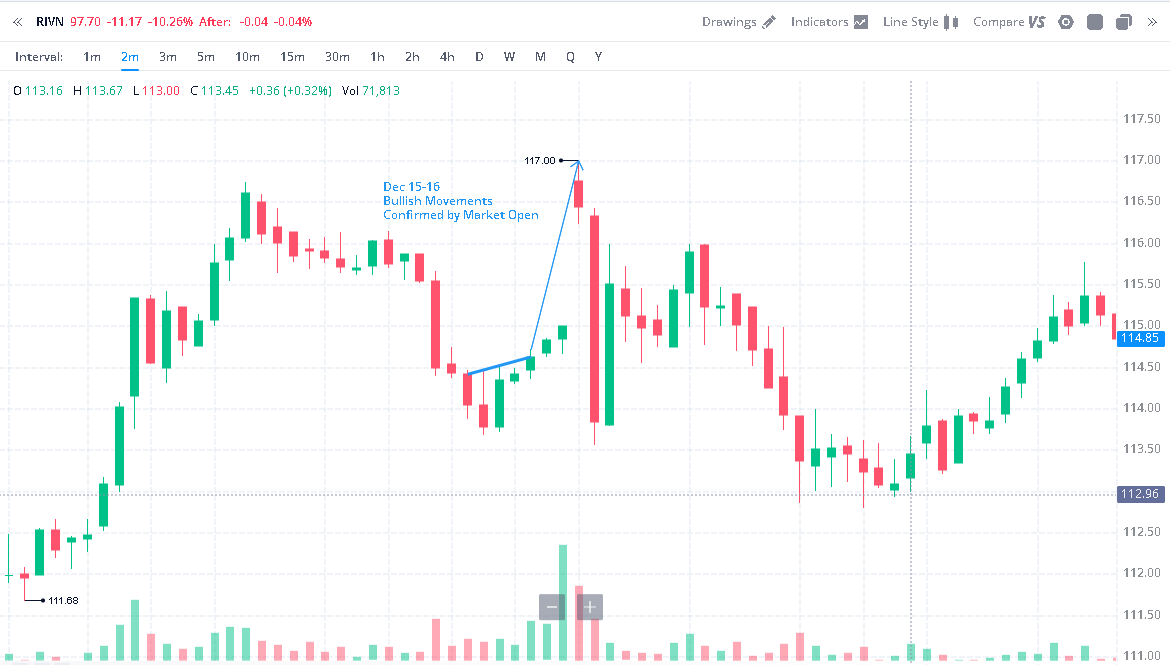
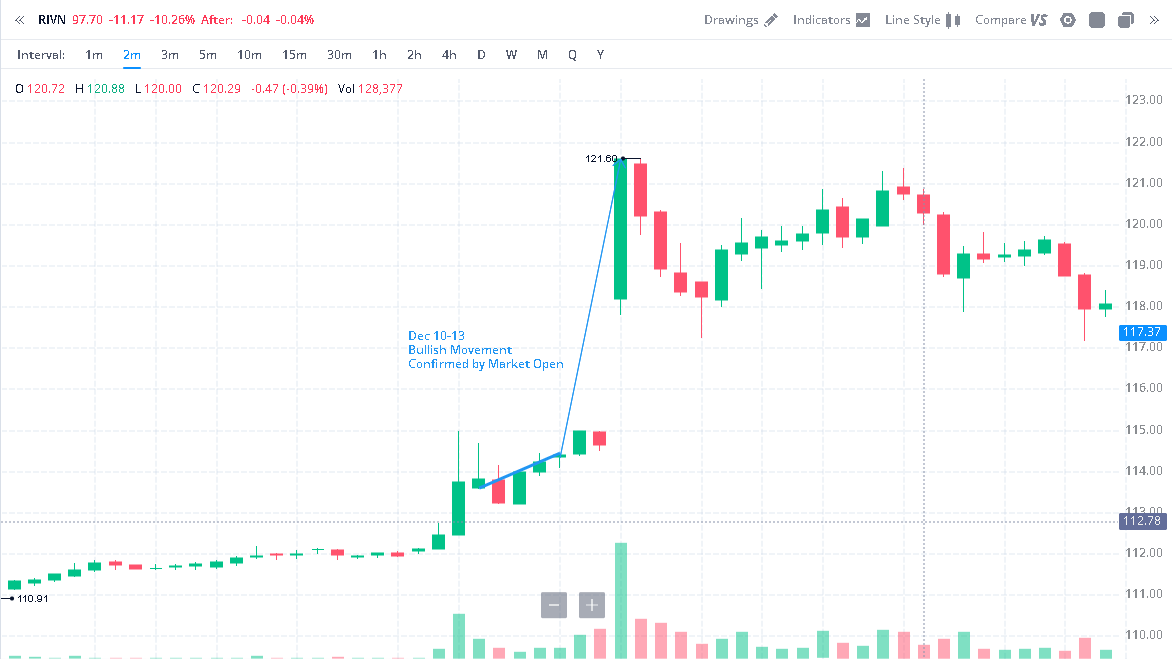
The timing is the trickiest part of this entire strategy. Last night I started watching 2 minute candles on Webull at 3:48PM EST. Between 3:48 and 3:56 a stock’s movement may reflect the movement it will make in the aftermarket, and could be a reflection of insider information informing stock movements right before market close.

Examples
Docusign:

Lovesac:

And finally, the painful one.
RH:

The Blind Gamble
I was observing and mock calling which direction the stocks would move, and found that I was right at least 80% of the time. The problem with fake callouts when you have nothing on the line is confirmation bias. You will always find data to support your thesis until you put it into motion. So I picked three tickers with AH earnings last night and opened some positions at 3:57PM based on what I saw:

  • CURV
  • NAPA
  • PATH

I did no TA, no DD on these stocks prior to choosing them.

The Outcome, and the Bastard
Last night at 3:57PM EST in the Upper Crust Discord I declared my three plays, and the bastard of it all is that I also called that RH appeared to be bull flagging. I immediately recanted, but I have since further observed that the final 2-4 minutes may not be reflective of the movement that the stock will make.

image

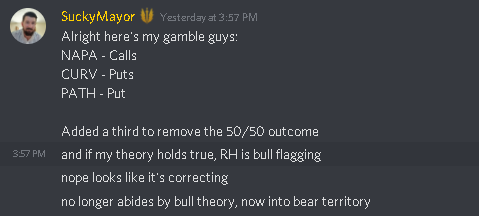
Last night when I called this out, I was not confident of the methodology so I did not want to cause mass panic and potentially ruin what should have been a great play. It turns out there was something to it. I am very sorry I didn’t call out what I was seeing.

So what of my three plays? They all moved exactly as I expected, however the financial benefit was net neutral for me. My options were on the “lotto” side, and certain tickers like NAPA people just didn’t care about.

All options had a 12/17 expiry
CURV - Opened $12.50 Put. This was the big winner. The stock tanked 20% after earnings, and I made a cool $45.
PATH - Opened a $30 Put Lotto. This was sold for a $20 loss despite the stock losing 5% after earnings.
NAPA - Opened a $25 Call. This is a stupid stock and went up 4%, and I sold my option at cost.

All in all I made $25 off of blind earnings without DD.

[size=5]Conclusion[/size]
There may be something to this. It does not seem foolproof, it does not guarantee how much a stock will move, but I have seen more instances in which this is confirmed than instances in which it isn’t. I cannot stress enough that I do not recommend making this type of trade without doing some type of DD, however I wanted to float this strategy out there.

Today I will be playing the following stocks using the same methodology and will report my results:

  • ORCL (How did we miss writing a DD on this one guys?)
  • LULU
  • CHWY

Shoutouts
@Kevin has been a champion with posting unusual options volumes on the trading floor. Its the same philosophy that volume is king, and I’ve asked him to contribute if he has any other volume-based strategies he’d like to share.

5 Likes

I did a quick spot-check of PTON ZM and DOCU options flow last night in correlation with FDs for ER plays. It looked like there was some merit to observing the large size FDs in the last hour of the trading day. I can add the findings to this thread later tonight if I have time.

I backed our of dash puts ten mins before close as well as i noticed some funny business. Dodged a bullet

Putting my money where my mouth is.

Earnings - 12/9/21

LULU (DD for Puts) - Puts
ORCL (Blind) - Calls
CHWY (DD for Puts) - Puts

(edit: bear in mind I don’t declare something a winner until 10AM EST tomorrow morning)

Relevant note, I am not buying FDs for any of these stocks, I will always pick the next week of expiration. Reason - If it fails, I’d like to have some time to get out of it without total losses.

Everything worked out as planned with these three plays (at least for now, PM and market open can still settle the “how much” question). The big one that stood out from my calls above was ORCL. I opened a 95C 12/17 and as of the close after hours the stock is sitting at $98.04, healthily in the money.

Following my own thesis, I had made a decision by 3:56PM as to what I was going to do. The period between 3:48 and 3:56 showed strong growth and I opted to open what amounted to a near lottery play of 95C. Again I have not yet figured out specifically how to guesstimate velocity, however I was feeling pretty confident that this would grow in the after hours. Lo and behold, the company announced a buy back.

2 Likes

Do you pick up your lottos during the uptick during the move, or did you manage to get it at the closing dip for a slightly better premium?

With ORCL I actually made a decision by 3:54 and bought there. I technically could have gotten a better premium but I’m not really sweating it. Today I did not wait at all and I will likely continue to do so. This one, assuming it doesn’t dump in the PM, is sitting at a healthy 250% gain at market open tomorrow.

1 Like

this is amazing. looking forward to learning more about this strategy you are using. it could be extremely useful to make ER plays here feel a bit less like a gamble

2 Likes

Clarifying observations as we head into open: I appear to be 3 for 3 on yesterday’s call, however much like many of you it doesn’t seem that LULU will be profitable for me as I picked an option too far OTM. My best case scenario for LULU at the moment is to be able to sell my put at cost, however its more likely I will lose $5-$10.

As the % delta between close and open is still an unknown variable for me, if anyone else plays this my best recommendation is to look into shares if possible, or ITM/ATM options.

If anyone asks me for a strike price this will be my answer.

1 Like

I’m curious on a more rigorous review of even 20 or 30 companies to see how well this pans out for those. The few couple I looked at (LESL and COST) didn’t seem to follow this same trend, but perhaps someone with a better chart eye could take a look? Obviously any strategy won’t be 100%, but from the examples in the OP, this looks promising.

Edit: AVGO seems to be follow the DD, nice.

1 Like

Love the counterpoints here, COST and LESL absolutely did not follow this model. What’s interesting with COST is that they missed EPS, have less cash on hand, but exceeded revenue. I would think that this information could contribute to a negative earnings reaction, but they seem to have navigated the water well.

LESL genuinely had a great earnings call so it was a total miss all around for the model.

I ran through about 15 earnings following this method and what I found was a correlation rate between 75%-80%. Part of the reason I clarified how to handle the options side is because 1 in 4 or 5 is absolutely a risk that can be managed by taking positions that won’t lose total value if it doesn’t behave as expected.

It would be pretty shocking if this worked 100% of the time right? So I definitely think it’s a good strategy especially around earnings seasons when it’s so choppy. Could also be a good play if/when the market corrects to make some green in a red market.

As a side note, I really dislike LESL as a company (have you been in their stores? They’re terrible), so I wouldn’t want to bet anything on them regardless. Wish I had seen this last night I would have tossed a few shares in to test with you. ASO has an earnings tonight, so I will try to get in here at the right time.

1 Like

The next couple weeks are going to be pretty boring with earnings. Here are the plays I’ll be targeting with this strategy. Important to note that I like looking at the after-hours earnings for this strategy. The correlation on premarket earnings is much weaker.

Monday, December 13
PHX

Tuesday, December 14
CLSK
RICK
SEAC (Only shares, and only if it looks like it’s going up)

Wednesday, December 15
NDSN
TCOM

Thursday, December 16
YCBD
SCS

Monday, December 20
NKE

Tuesday, December 21
BB

Wednesday, December 22
AVO

Have you looked at buying or shorting the stock instead of options? If your method is being correct but not yielding a ton of profit that seems like a possible change to work with it?

I’m a dumb Robinhood user so shorting is off the table for me. However if you look at my choices above, there is one I’m specifically targeting for shares (penny stock that I hope is bullish).

Shares are one of the safest ways to play this for sure, though. If options aren’t your jam and you see bullish sentiment before earnings, jump in with shares.

@bigglyoptionoligist i saw your post for IRNT ER, bud.
if you’d like to keep testing plays on ER, I’d follow this thread by @SuckyMayor

Thank you @rexxxar and well put. Appreciate it and will be sure to follow @SuckyMayors plays here and going forward

I’ve learned some things over the past couple weeks with this strategy and I wanted to take a moment to explain what I’m seeing with this approach.

  1. This is not a fool-proof strategy. In order to be successful with this approach you MUST be willing to take small positions and play either shares or higher premium ITM options. I am running at roughly a 75% success rate with this strategy in terms of movements, however my actual profitability is closer to 10% in aggregate (and please understand I did very well with ORCL and IRNT, receipts are in the Discord).

  2. Wild movements in this very small window are cause for concern. If you’re drawing your trend line from 3:48 Open to 3:56 Close you should be very concerned if the angle of that line is greater than 45 degrees (will show with FDX what I noticed here)

  3. Not all stocks will follow this pattern, however you can look back to previous days to try to gauge whether or not this stock “behaves” typically. The same method can be applied to daily pre-close, and I managed to also make a good return playing AMC puts last week this way.

  4. Be wary of stocks that have extremely low volumes or extremely high floats. Some research beforehand on the general climate of the stock can help you avoid playing this method with securities that require ALOT of volume to move. Also be aware of options that have very low OI. Your play can move exactly as you’d expect, but you’ll end up having to sell your contract for less than you should or get theta crushed as you’re stuck with a contract that no one wants to buy.

  5. There may be some tells in intensity of a movement based on the slope created on the trendline, however I am still doing analysis on this.

And the most important, and I cannot stress this enough

  1. Earnings money is most easily made in the first and third phases of earnings plays (per @Conqueror post on the three phases of earnings). Doing DD and getting in early or playing the post-earnings sentiment is going to net you more dependably than this method will. It takes a really good or a really bad earnings call to swing a stock 10% in the AH/PM hours.

With that, here’s some updated witchcraft.

Item 2 and 5 - Wild Movements in the Pre-Close

FedEx had wonderful earnings call movement, however if you had followed this method to the T you would have been burned badly. In bullet 2 I noted that if you see slopes of 45 degrees or more you should be concerned about using this method. I did see this with FDX and I opted to sit out of playing this earnings. Here’s the annotation I drew prior to making my move:

So why not inverse it if you see that? Well, the same day I also decided to play the inverse for RIVN. I opened calls based on significant pre-close movement that would have typically indicated bearishness, and those calls absolutely expired worthless yesterday. Anyone who has done any real DD on RIVN would roll their eyes at me for playing calls, but I did it for science and to make sure that I continue to remove confirmation bias.

What I’ve learned is that slope intensity matters, pre-closing movement matters. Too much pre-closing activity, though, may actually harm our ability to apply this. Related to Item 5, another interesting thing I’ve observed (however needs further analysis and confirmation) is that the lower the slope, the more drastic the movement.

Item 3 - Does This Stock Behave Typically?

Because I have the chart pulled up at this moment, let’s do an analysis of RIVN to figure out if the stock behaves typically. I will look back usually 4-5 days to see the ratio of following this pattern versus not following the pattern and decide if it’s worth watching right before market close.

December 15th-16th - Behaves


Item 5 revisited, note the shallow slope and the SIGNIFICANT movement

December 14th-15th - Does Not Behave

December 13th-14th - Does Not Behave

December 10th-13th - Behaves


Item 5 revisited, note the shallow slope and the SIGNIFICANT movement

December 9th-10th - Does Not Behave

Generally speaking RIVN did not abide by this pattern well (60% misbehaving). This stock’s movement was more of a coinflip than it was a tell of what happens between afterhours. It also showcases some of the risk in taking this approach even outside of earnings, as TA cannot estimate movement 100% of the time.

Item 4 - Sloth Stocks

I predictably called the movements for NX last week, however when you zoom out in a small interval chart you can see a pretty glaring issue with this stock:

The chart looks more like a scatterplot at points than it does a candle chart. This is telltale low volume or very high float, and while low volume can make you a bunch of money if it gets attention, it can also pin you against the wall with a winning contract that no one wants to buy. I bought 25Cs for NX and while it did cross $25 and was ITM for a short period, I actually couldn’t get anyone to buy the contracts for what they were worth and I ended up needing to sell it for far less as the stock started to march back down. I made money on the play, but what was a 300% gain at market open ended up only earning me around 20% (profit is profit, but that’s not a fun feeling either).

That’s what I have for now, this is continuing to evolve so as I uncover more I’ll continue to post them.

2 Likes

Have you considered watching Micron (MU) & Rite Aid (RAD) for earnings this week? From the looks of previous earnings I would at least think Rite Aid would have some pretty decent movement.