Hello, beautiful and rich winners of Valhalla.
I have come to update my chart obsession.
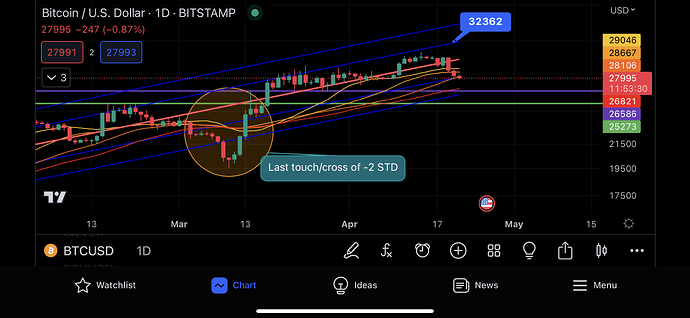
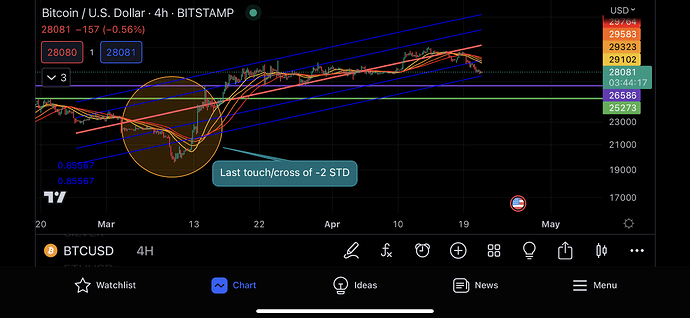
Here, we see that Bitcoin is once again trying to break out of this parallel downtrend…
- Notice we’re yet to experience a late-year big flush like that of 2018.
- I’m intrigued now as to what is keeping it up at this price point, I don’t trust any bullish sentiment right now.
It was already rejected twice earlier, once in November, and again 10 days ago on Dec. 14…
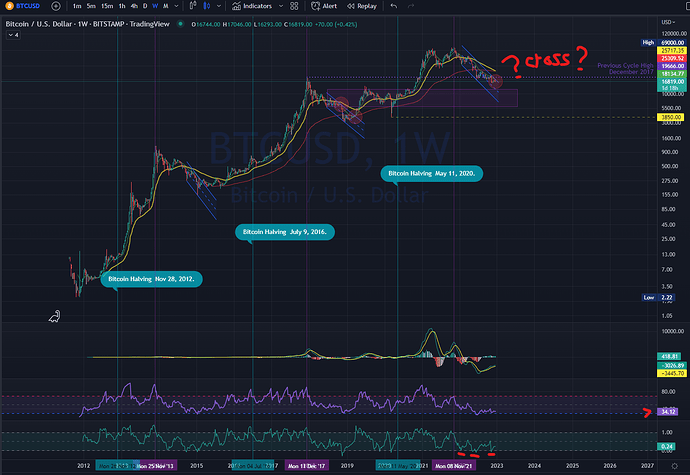
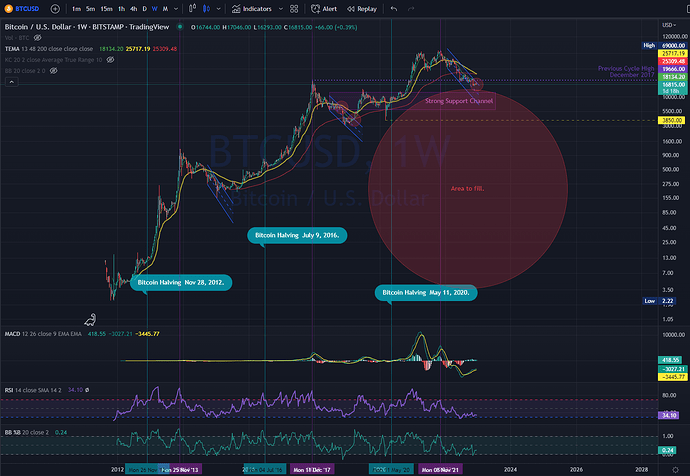
Now let’s take a loot at the Weekly candles…
- The 48day (yellow) and 200day EMA (red) lines are on the verge of crossing down, possibly bearish, but can also bounce up.
- MACD indicator remains weak underneath the Histogram, although the lines seem to be recovering.
- RSI indicator is trailing at the bottom, indicating little demand.
- BB %b indicator has already touched the bottom 4 times in 2022, weaker than 2014-2015 and 2019-2020.
I think we are half-way into the Distribution phase of Bitcoin.
The past months have demonstrated strong buying power whenever it drop a couple of grands.
Now with FTX’s death and decay, I think one remaining behemoth’s downfall will spell the inevitable end of this long bullish adventure.
Continue to monitor the broad market, because play-money still needs real money to have any fun with.


