BTC Bitcoin - Fundamentals, News, and Alerts

Main site: Bitcoin - Open source P2P money

Max Supply: 21M coins.
Total Circulating Supply: 18,884,175.00 BTC

Guide for Individuals: Bitcoin for Individuals - Bitcoin
Vocabulary: Vocabulary - Bitcoin
Guide for Developers: https://developer.bitcoin.org/
Whitepaper: Bitcoin: A Peer-to-Peer Electronic Cash System
CoinMarketCap page: Bitcoin price today, BTC to USD live price, marketcap and chart | CoinMarketCap
News Link: Bitcoin price today, BTC to USD live price, marketcap and chart | CoinMarketCap


Update: 2023-01-17

Happy New Year, everyone!
This past weekend along with the week before that given a nice green pump on BTC…


Not sure how long this will last, and I’m honestly not touching anything yet.
If you’re trading this, good on you.

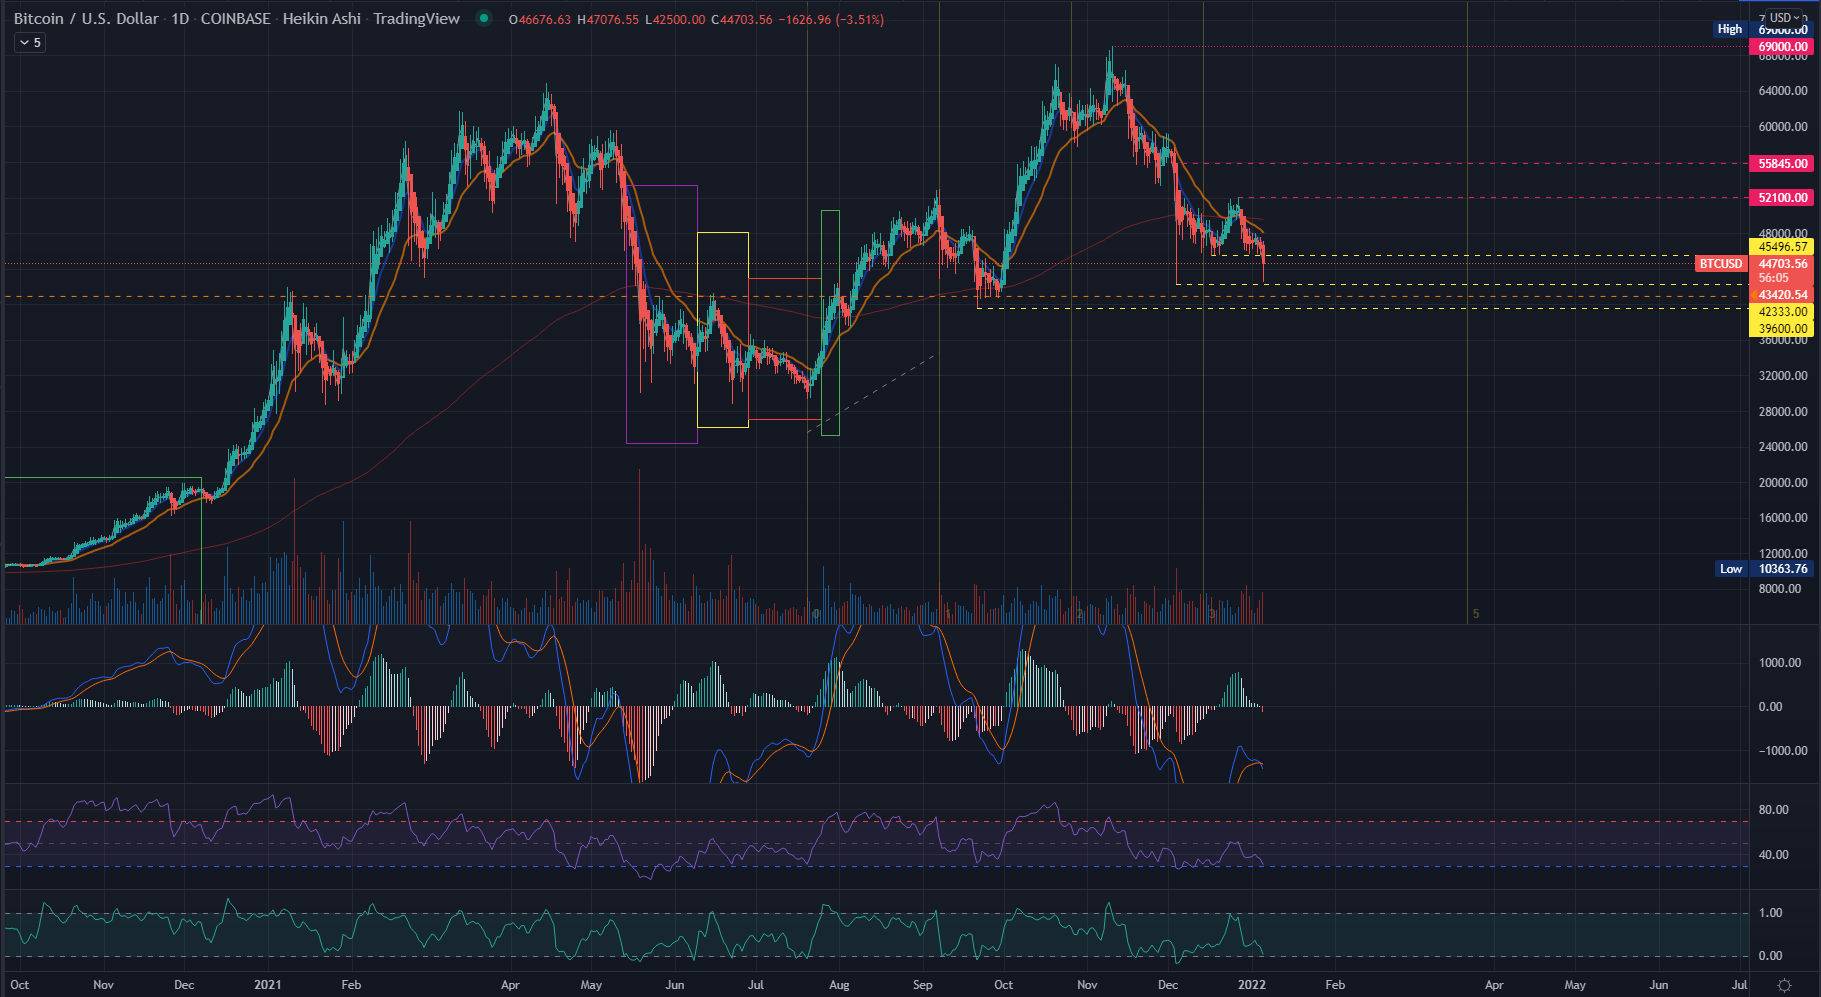
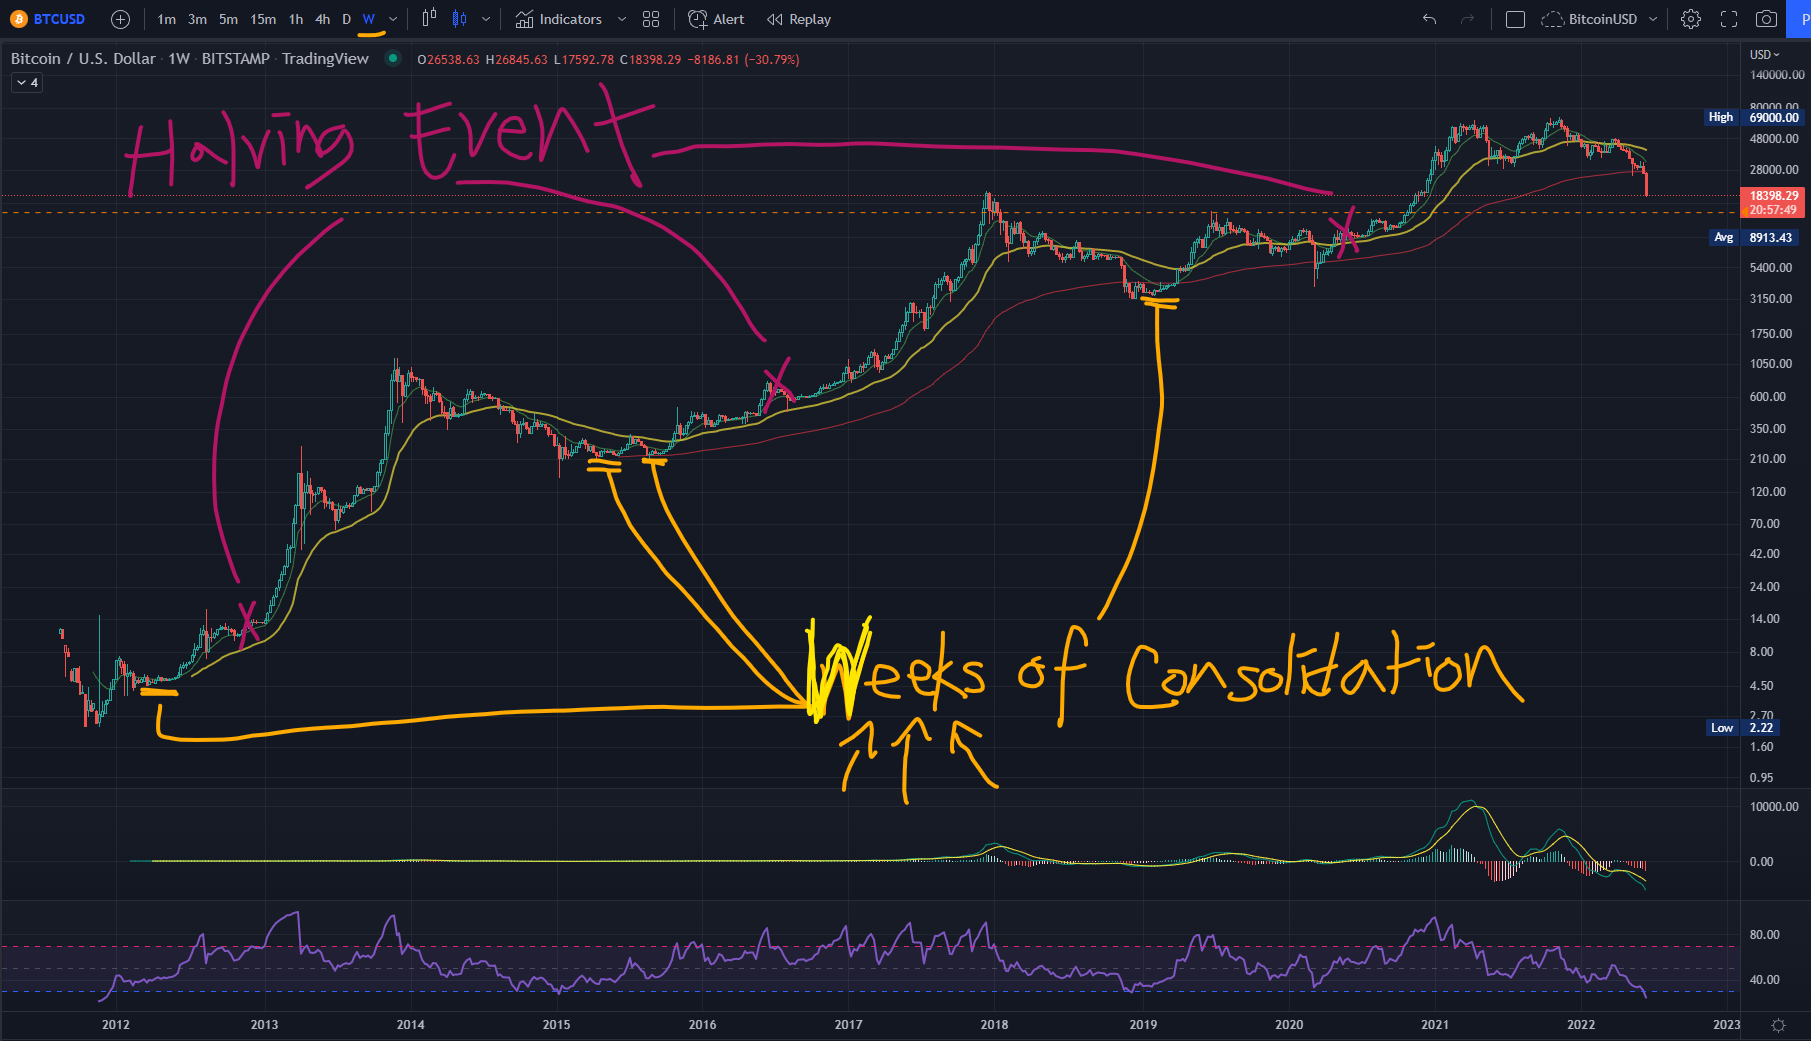
Here’s a look at the weekly candles…


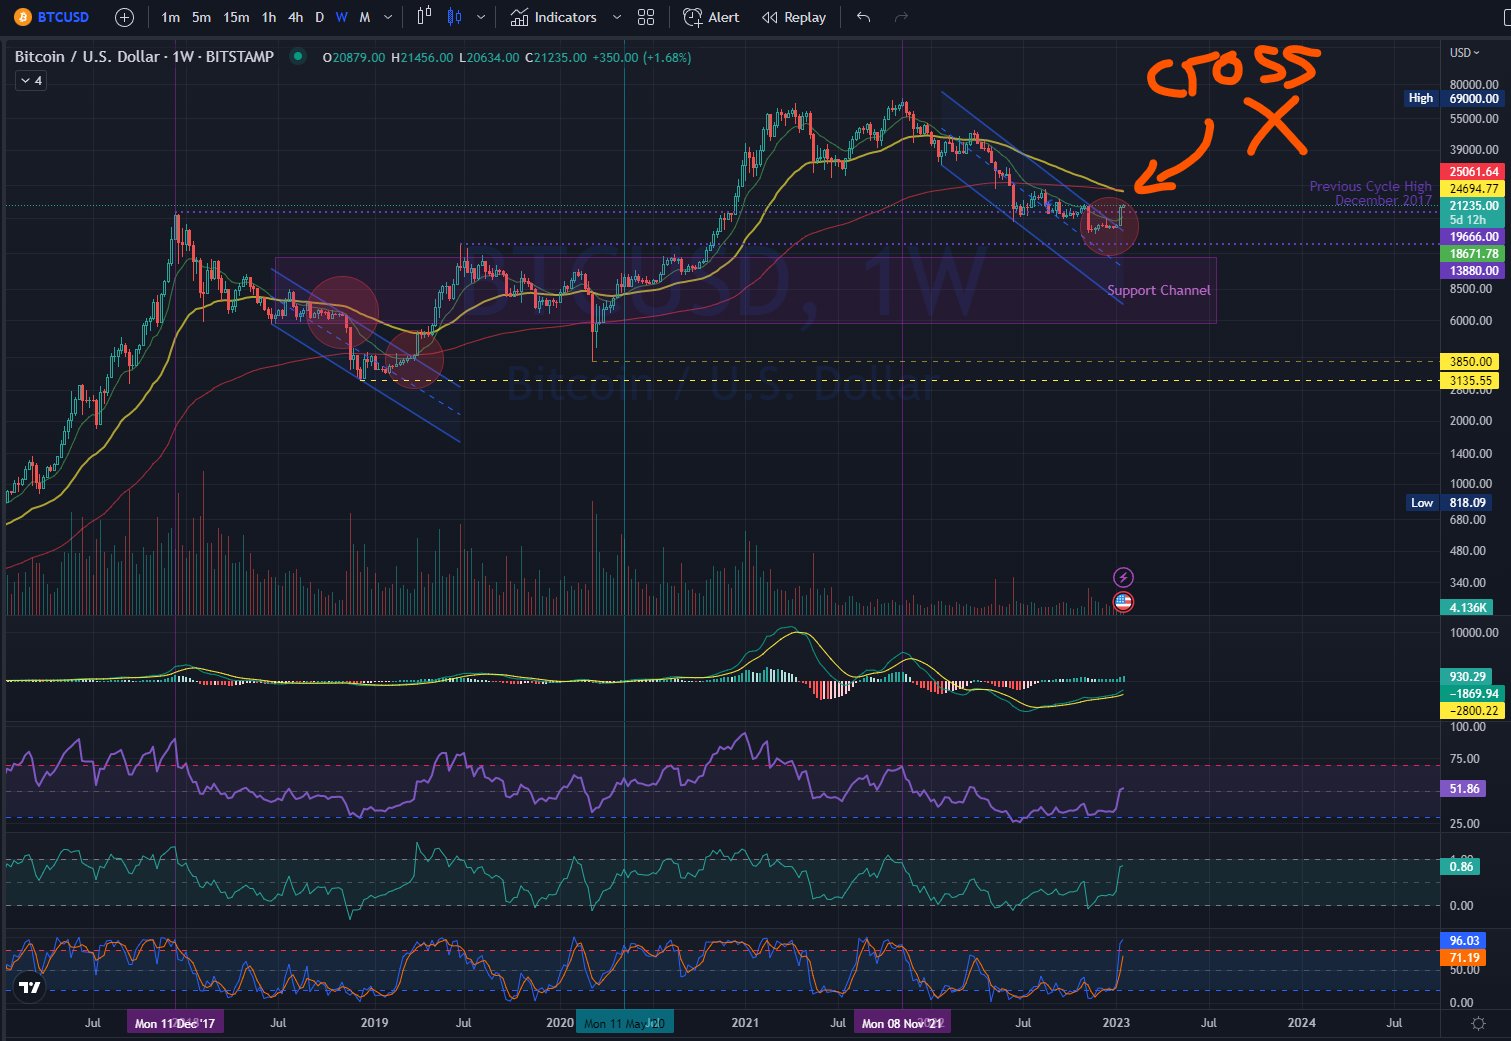
And there’s a clear cross on the 45ema and 200ema lines, sign of possible further weakness.
Be fast taking profits, be patient taking new entries.
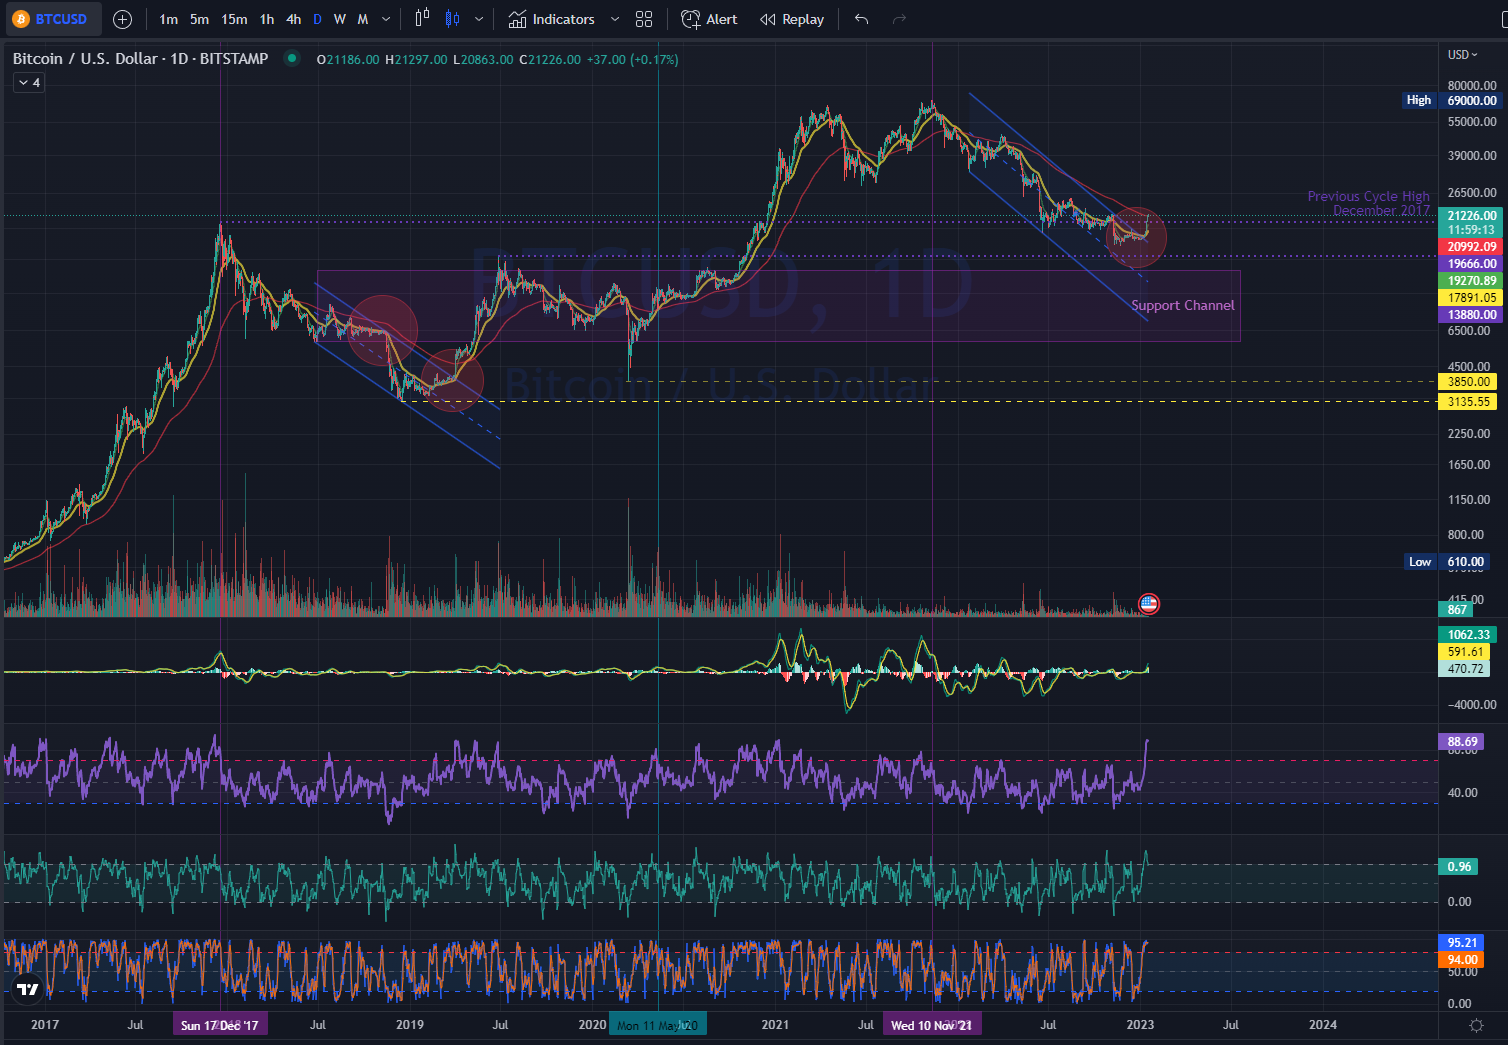

Update: 2022-06-18

As we’re witnessing Bitcoin continue to flush down in value, it’s best to be reminded of Risk Mitigation…


Do Not Try To Catch A Falling Knife!
As you can see on that Weekly candles chart above, Bitcoin will give you a lot of days to accumulate at whatever low price it settles on.
You don’t have to rush.

If you spend even a few minutes on this thread, you will be reminded that this crash below 20k has been expected since it broke under 55k.
Cryptocurrencies are speculative plays, full of Pumps and Dumps.
You best believe the biggest winners keep their cash until a collective group of fools decide to pool money back in–just enough to keep things afloat.
Bitcoin has no practical use case–it is only being kept alive (and pumped) by SENTIMENT.
Gold has practical uses.

I am not discouraging you from trading Bitcoin and other cryptocurrencies.
I am encouraging you to pull your heads out of that shit-pile you’ve been feeding on.
There will be a great window of opportunity–if Bitcoin stays alive again this time.
Stay cash until then, you want the price to hold at least 3weeks before jumping back in.
DCA if you prefer, but be sure to limit your exposure.
Don’t put all your eggs in one hand.

*The next Halving Event is not expected until 2024–and only IF Bitcoin survives.
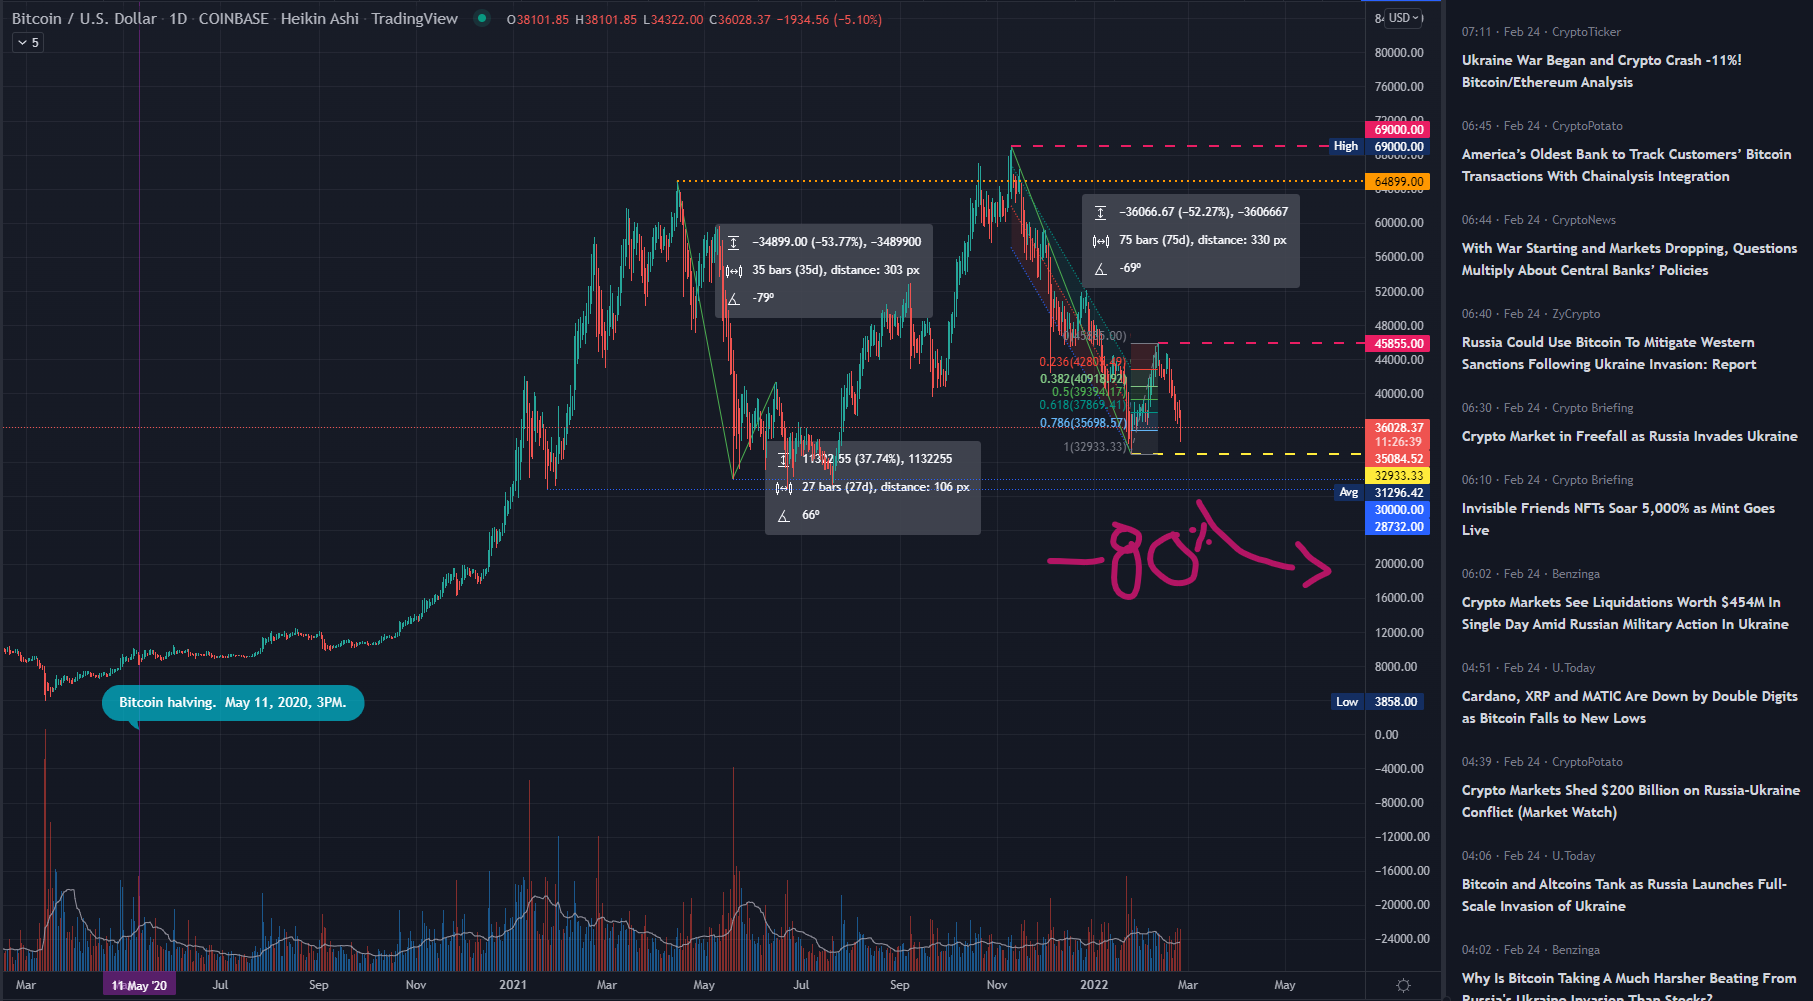

Update:
This is BTC Weekly…


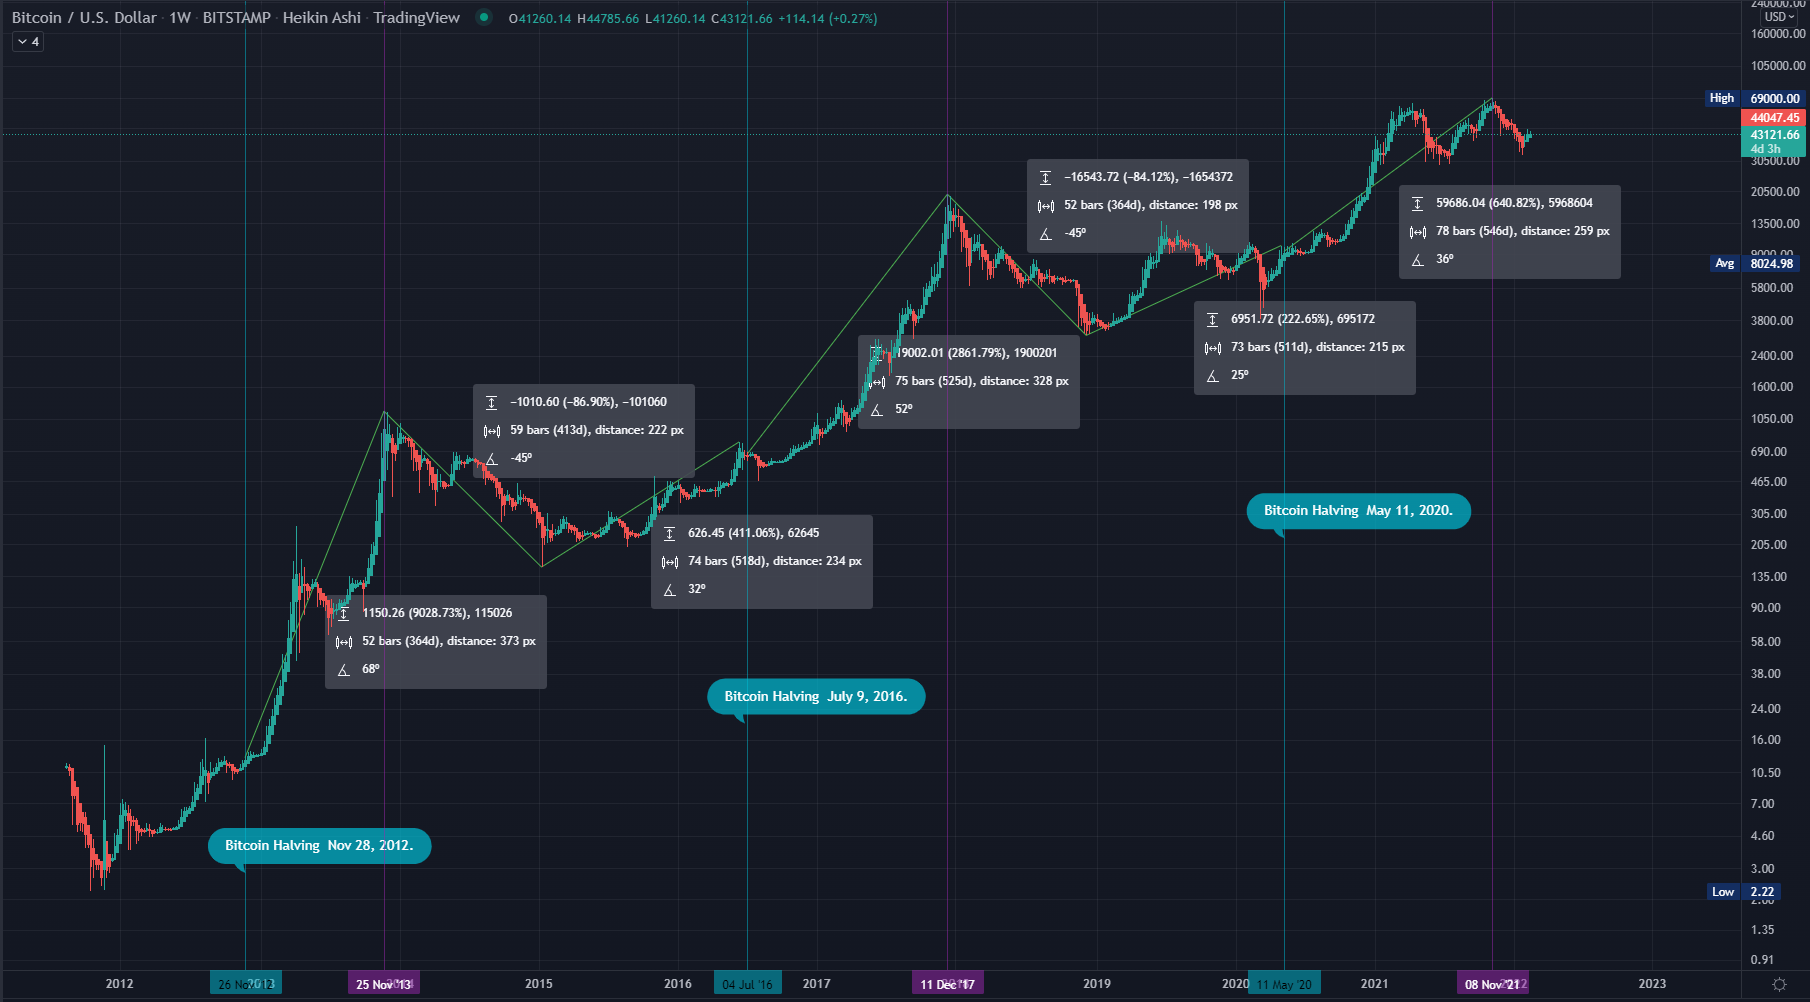
As you can see, its short history demonstrates a move down to around -85% after reaching new ATHs post Halving events.
It takes around 1year to drop that much.
There still is a possibility of a further move up, sure.
But I’m more eager to catch it at the bottom-end.
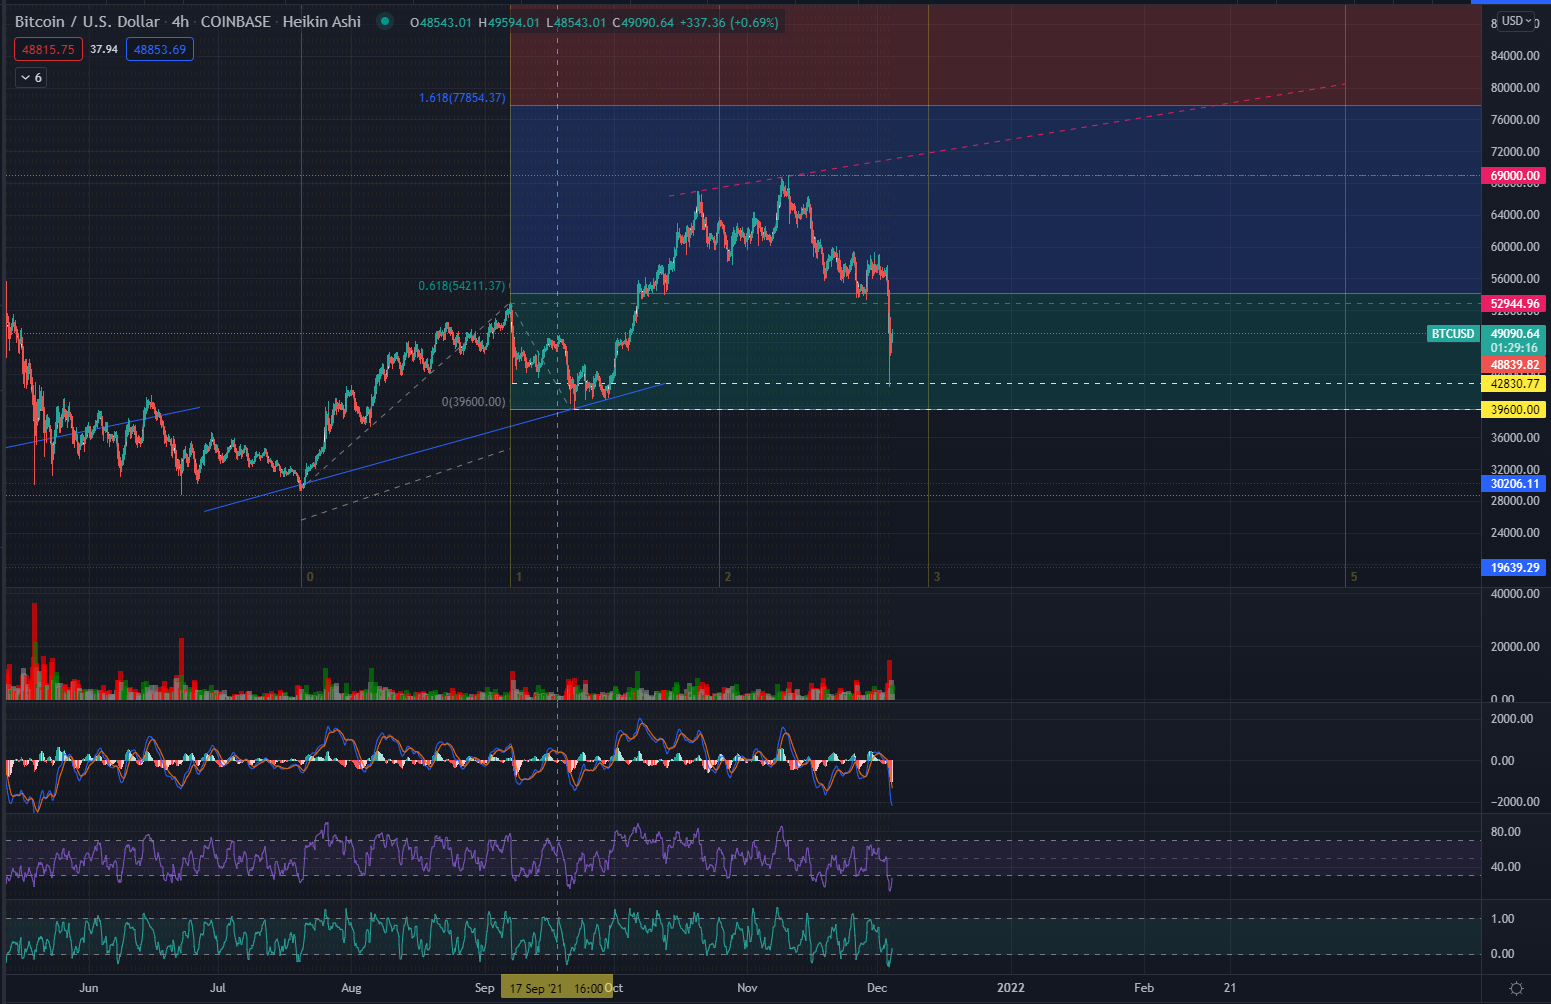
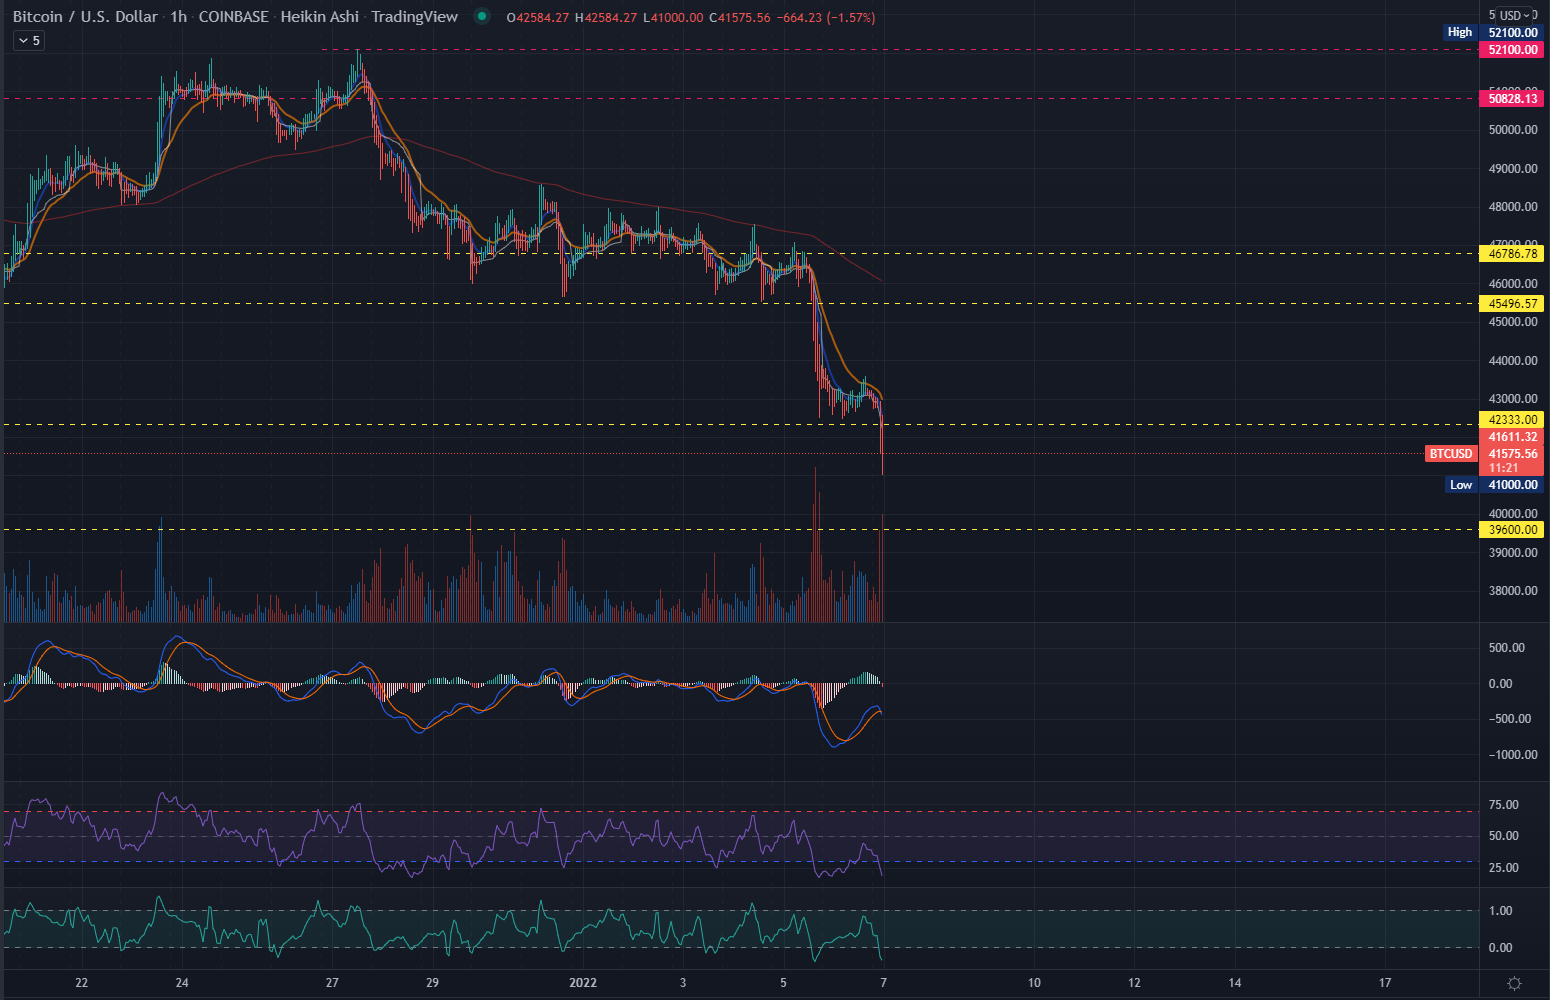
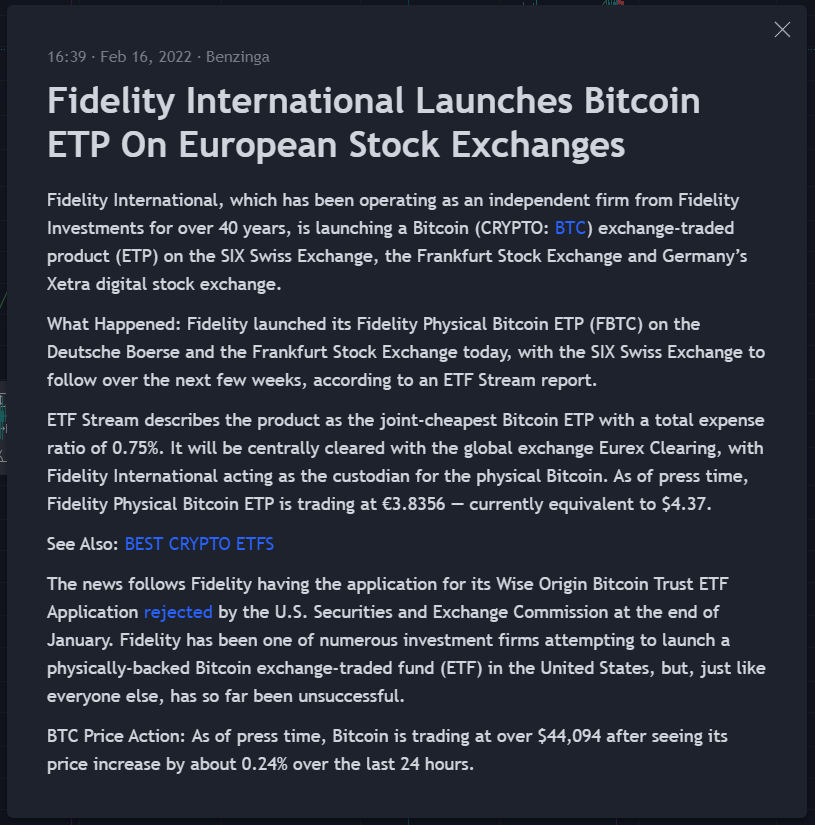

Chart:
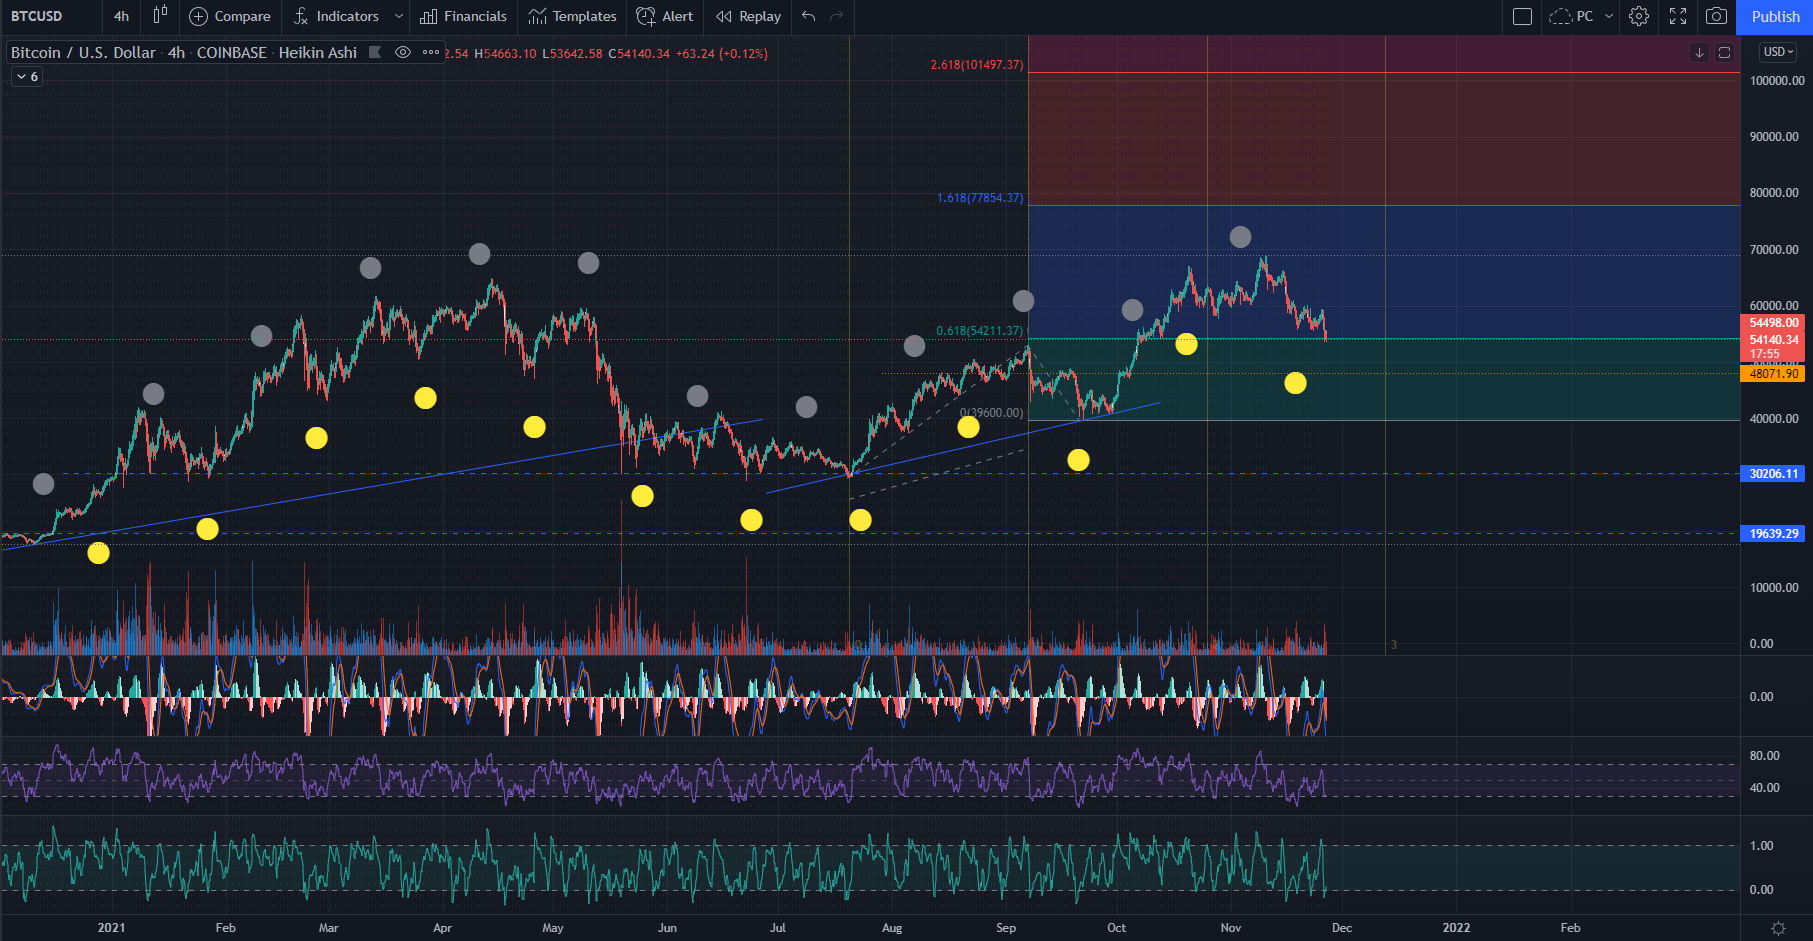
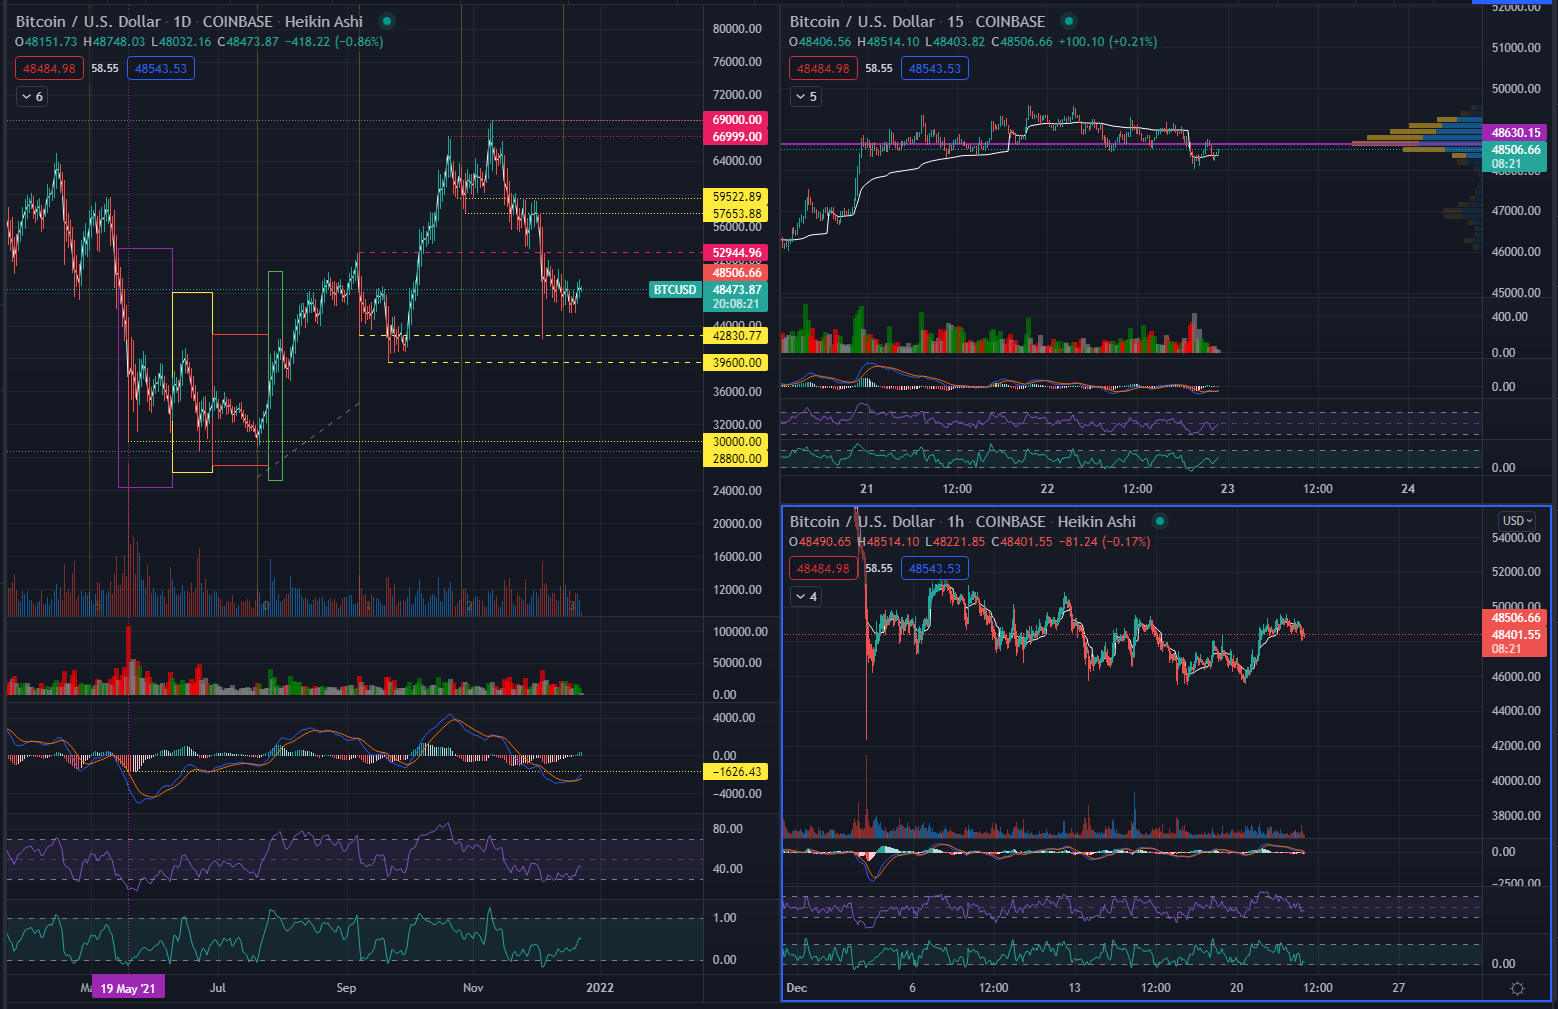
Bitcoin is currently sitting at the critical support channel of $54k to $55k.
Should this break again to 53 (already dipped 2x there today), we might be looking at $48k as the next strong support line…

7 Likes

Just a little EWT for your consideration and possibly reassurance. I see BTC running in the near future, but then correcting back to right where it is now. That would land BTC around 50% retracement which would be ideal for a wave 3 correction.

(By the way, point D is completely made up, but showcases the 5 point correction generally present on a wave 4).

3 Likes

Nice to have this, bud! Thank you.
As most are aware, crypto-currencies lean mostly on sentiment, so EWT is a great way to track and “foresee” things.

2 Likes

I agree with what you’re both seeing, these patterns are playing out on basically all timeframes. Slightly concerned at the moment due to the two $53k touch points you mentioned rexxar, along with some slightly bearish, but extremely indecisive looking charts on the 4hr and lowers, no clear sign of a break either way yet. Also, we have a much higher climb to make compared to how close a fall is…

That said, unless the parabolic blow off is no longer part of BTC’s bull cycles (which may just be the case, the market isn’t the same as it was even in 2017, SO many more institutions are involved now, you have a handful of good traders, some algos, but mostly degenerates trading on insane margin, plus the cycles have lengthened each time. Eventually that blow off top is going to be stretched out…I figured we have a few more to go though), I’m thinking we bounce around here.
$52.5k is kiiiind of a psychological support, edit-also, it’s where the 21 week EMA is sitting (historically, a few times now, we’ve bounced off this particular EMA on big breakouts), plus (I believe) a dump back under $50k to the mid-40’s would very likely cause the true shakeout of a majority of retail.
If I had to guess, the average cost basis for your everyday investor would be somewhere in the 40ks considering FOMO on both run ups this year plus DCAing, so I really do not want to end up going down and testing them… What happens from there would be interesting to see though, beginning of an extended bear/re-accumulation or a bounce back? Should check on where the buy and sell walls are sitting… But yeah, people are generally impatient, see the 2-4 weeks we’ve been set back since summer by leverage cascades, and sentiment seems to be getting a bit tired. Altcoin season arguably arrived as well. We’ll see where we close the week out, it’s gonna be a big one for sure.

Edit- 11/28, 3:06 EST Got a little bit of green on the candles, but I’m not convinced yet. Probably smart to pull some profits to reinvest on a confirmed break or bounce off a support, unless we really pump today I’d imagine when the market wakes up we dump a bit more and probably bleed a bit through the week depending on how sharp we drop to supports. We are sitting around the 100 day EMA on the daily (which has held before when other averages and indicators lined up, but they aren’t there on this one). Next weekly supports look to be right around where you’d expect on your main E/S/MAs, 52.5k, 50k, and the 48k you were originally posting the warning about @rexxxar. Probably sucks for the immediate short term, but it’s good to know where the safety nets are right before the drop, right?

Also consider that is all fundamental stuff, and we know how much sentiment and news can affect especially crypto…BTC is a bit more resilient to that due to the factors previously posted, but only a bit. If/when 53k breaks I’d imagine sentiment getting pretty fearful, and fucking news is always bearish lol. Good luck all

3 Likes


Bitcoin has just broken past the 55,300.00 resistance.
If we see this at 58K in the next few days, then we’re back on track for an even more bullish year ender.

2 Likes

Bitcoin is still consolidating in this 56-57k channel…


Note the beginning of Fib Time Zone 3 on Dec 14.

  • If BTC holds above 54k on that day, it’s a good indicator of a possible continuation upside.
  • CRO, LRC, GALA, and SHIB are also shown in this chart.
  • All are tracking well and holding their prices.
  • BB %b and RSI are showing these to be good entries for all digital securities shown.

Article from Benzinga…
09:47 Dec 03, 2021 Benzinga

You Ask, We Analyze: Is Bitcoin Consolidating Before An Impending Weekend Run?

On Thursday evening, Benzinga asked its followers on Twitter what they’re buying at the open on Friday. From the replies Benzinga selected one ticker for technical analysis.

@HodlTahoe is buying Bitcoin (CRYPTO: BTC) and noted they “stack the dip and #HODL the rip.” HodlTahoe also stated Bitcoin traders and investors “don’t have to wait for any market to open to buy the dip” because cryptocurrencies trade 24 hours per day.

@dbcstox may be planning to play a Bitcoin move through crypto related stocks and listed Hut 8 Mining Corp (NASDAQ: HUT), Marathon Digital Holdings, Inc (NASDAQ: MARA), Riot Blockchain, Inc (NASDAQ: RIOT) and Bitfarms Ltd (NASDAQ: BITF) as stocks they’re interested in.

@OGcyclist1987, on the other hand, left Benzinga hanging and posted a gif of a failed skydiving attempt without comment.

Bitcoin has recently tightened its daily trading range and has become less volatile, which signals consolidation. A tight trading range often precedes a larger move to the upside or downside and traders can watch for increasing volume on a break from chart patterns to gauge future direction.

See Also: Bitcoin Bull Anthony Scaramucci Says This Crypto Project Could ‘Potentially Flip Ethereum’

The Bitcoin Chart: Bitcoin has been trading in a fairly consistent downtrend since printing a new all-time high of $69,000 on Nov. 10. Over the past five 24-hour trading sessions, however, the apex crypto has failed to make a lower low below the most previous low at the $53,327 mark made on Nov. 28.

The crypto may be trading in a falling channel on the daily chart, between two parallel trendlines. Over the past five trading days, the crypto has attempted to break up from the upper descending trendline but has failed and wicked from it. Because Bitcoin is trading above the median line of the channel a break upwards from the pattern is more likely, although further consolidation may be needed before that happens.

It’s possible Bitcoin printed a double bottom pattern near the $55,910 level on Tuesday and Thursday. If the pattern is recognized traders can watch for Bitcoin to rise up higher over the weekend. It is also possible Bitcoin may retest the level as support and create a triple bottom pattern before breaking north although it should be noted that if the crypto falls below the level the patterns will be negated.

Bitcoin is trading slightly below the eight-day and 21-day exponential moving averages (EMAs), with the eight-day EMA trending below the 21-day, both of which are bearish indicators. The crypto is also trading below the 50-day simple moving average, which indicates longer-term sentiment is bearish.

Want direct analysis? Find me in the BZ Pro lounge! Click here for a free trial.

  • Bulls want to see big bullish volume come in and break Bitcoin up from the falling channel pattern and for the crypto to print a higher high above Nov. 30 higher low at the $59,249 level. The crypto has resistance above at $58,943 and $61,744.
  • Bears want to see big bearish volume drop Bitcoin down to print a lower low and confirm the downtrend is still intact. There is support below at $55,625 and $52,666.
1 Like

So last night was rough, but not unexpected, as I’ve been waiting for a more volatile reaction to regulations for a while…


Looking at this chart, I have marked the previous Fib Time Zone’s high as the new resistance–52,944.96.

  • IF we break over that and over 54k again, BTC will try breaking past 69k.
  • IF it doesn’t break 53k, we will see it keep trying for a few time until it dies back down.
  • The next Time Zone starts on Dec 12, so I expect to see these moves after that.

Right now, the 4Hour RSI is still at 27, we want to see it above 30 before it’s a Best Entry confirmation.
Supply is only getting LOWER, so this for me was a shake-off against retail paper hands.
I’m pretty sure the more seasoned whales and governments got their hands on that big dip.

For comparison, May 19th was a harder fall of -33.93%…


News:

  1. Peter Schiff Names Real Reason Behind Bitcoin Drop

  2. El Salvador Increases Bitcoin Holding To Over $60 Million, Tron's Justin Sun Scoops More BTC In Solidarity ⋆ ZyCrypto


BTC and ETH Balances on Exchanges charts supplied by @Jekyll_and_Hyde

*There are more tasty info being discussed in the crypto channel, but nerds will be nerds so you know.
*Come hang out there so the OGs can convert you better.

4 Likes


It’s only been 19 days since the dump from 55k.
I don’t see any significant stress across the charts, atm.
So if I’m looking at this correctly we still have over 1 month for another move up–if at all.

I’m thinking it will soon drop down to 42-43k again before ramping quickly back up to 50-52k.
Looking for that short opportunity, so I sold here above 48,600.
There’s a good chance I’m wrong of course and that it can ramp up now, but I still see it testing the supports of 39,600 and 42,830 later.

1 Like

So the FED dropped the bomb today and everything is finally breaking…


For BTC, I will now be looking at above 39K for a bounce.
If it keeps dropping below that, then I’ll know for sure that the biggest bull cycle since 2020 is finally over.
If it does bounce good, then my PT of 85K after March 2022 will be in the menu again–but that is way far from here now.

Again, I play the macros for most of my trades, saves me lots of headaches and I get to enjoy other things.
If you’re trying to play short term, then 45K is now a resistance once again.
You’ll want to sell there if you see weakness.

Here’s the Daily chart again…


39,600 is a back-test to a previous support line.
Yes that is what a proper “back-test” looks like, not the kind that’s irrelevant to the current price movement.
That was in Sept 21, 2021, 9 days before BTC decided to start flying to 66,999 for the first time in history.

2 Likes

Ok bulls, don’t rush into any long positions yet.
You want to see a good bounce first.
Unless of course if you’re riding this sell-off trend…


Trades are profitable either way, if you’re patient.
In the case of BTC, I personally wait 1-2hours of green candles.
I don’t see a strong enough bullish reversal yet–so I’ll just check it again tomorrow.

1 Like

Bitcoin is not showing a strong reversal…


While it did bounce on that 39,650 price, the rest of the day wasn’t as bullish.
I was comparing this to June 22, Monday, but we didn’t see a similar buying volume.
Daily RSI is also way low at 25.

I want to see it break 42,333 again and hold above that for a day or two, before taking a long position.

7 Likes

Bitcoin finally shows some strength today, poking through that most recent previous support line of 39,650…


I want to see it try for that resistance line of 43,511 and come back down to this channel again (lowest of 32k) to confirm a strong floor.
Glad to see this since that steep fall of -52.27%.

4 Likes

Why do you think after it hits 43k it would drop back down to the downward channel?

1 Like

Just my fundamental expectation with trading.
I trade the macros (at least 4hours) in cryptos, so I look at wider ranges.

Industry-wide, this is in line with my expectations for this year.
Still anticipating clearer direction after more regulatory announcements in the coming months.

2 Likes

Ah okay I see. Thanks for explaining.

1 Like

Since BTC may be heading back down to the downward channel is there any TA saying that there is a possibility of it bouncing off the channel and heading back up again, or once BTC is near it does it usually just get sucked into the channel again? Another way to phrase that question is; does the downward channel now act as support for BTC or affect it at all anymore.

1 Like

Here, we see Bitcoin somewhat mimicking its price drop back in Spring and Summer of 2021…


From that older peak of 64,899, it dropped to -53.77% in 35days, before establishing a new accumulation area.
This time it took 75days for it to drop -52.27% from the ATH of 69k.

This latest possible accumulation area is a bit wider than last year’s range.
What we want to see is a hard bounce around the 33k line.
30k is a possible lower dip.

Historically, Bitcoin drops all the way to around -80% before ramping back up.
It might be different this time or it may just take a bit longer.
I won’t be buying again until it’s near that 33k support line.

4 Likes

Updated main body above.


Latest News:

So here we are, RU is now forcing UE to submission…


And I was wondering what will help trigger massive sell-offs.

Looking at BTC to hit its low -80% from last year’s peak by last quarter of this year or early next year.
Probably sooner.

This only if Bitcoin breaks the support of 28K.
I’m betting on that.

1 Like

https://www.wsj.com/articles/russian-bitcoin-and-other-cryptocurrencies-could-be-part-of-future-sanctions-11645902740?mod=markets_lead_pos2