The suggestion is to watch and see if it dumps and sustains a decent options chain, and see if you can get in on a 2nd run if any. With such a low float, the stock should be able to move incredibly fast in both directions so be careful.
Surprised redemption is that high - was not expecting it.
Getty Images may be a bit richly priced, but it actually has revenue and income. So thought more people would want to hold on than usual. Clearly, SPAC aversion overrides all that.
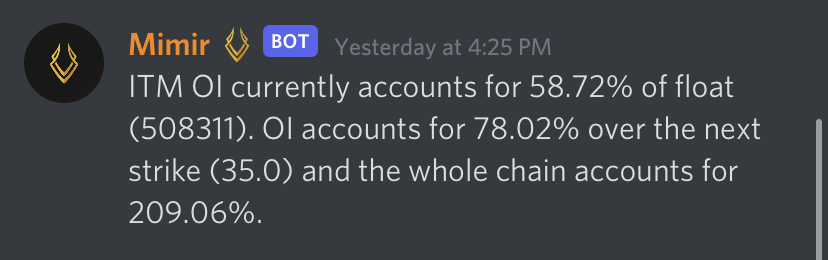
ITM OI currently accounts for 120.87% of float (508311). OI accounts for 124.14% over the next strike (17.5) and the whole chain accounts for 124.14%.
These are good numbers however these low floats aren’t running like they used to. FAZE also had decent numbers and all it really amounted to (thus far) was a brief pop directly after redemption numbers were posted. – OI % numbers can be checked by running the !oi GETY command in Discord, Trade Ideas will also feature a “Gamma Squeeze” type which will automatically post these numbers every day when OI is updated.
I’m not actively trading at the moment so I’m more just watching these out of curiosity.
Looks like SI is already a couple million. Again as noted with FAZE probably means nothing cuz they will most likely never cover. But CTB is high already and could get some retail attention as lowest float ever etc. I’d expect the chain to expand upward so MMs can capitalize on premiums. From OTM options since it’s near the highest strike.
Will probably watch this to see what happens for now.
Almost 3m shares are short, with only 250k volume yesterday and 500k so far today. You guys think this can run all day with shorts covering until it gets at least a few million more volume?
So unless this was just some crazy intraday trading, more than 100% of the float worth of OI was purchased today as deep itm calls.
I’m very curious to see what the OI shows for tomorrow, and I would caution anyone in not to hold too long if it starts running incase this is some sort of gamma squeeze pump and dump (is that even a thing?).
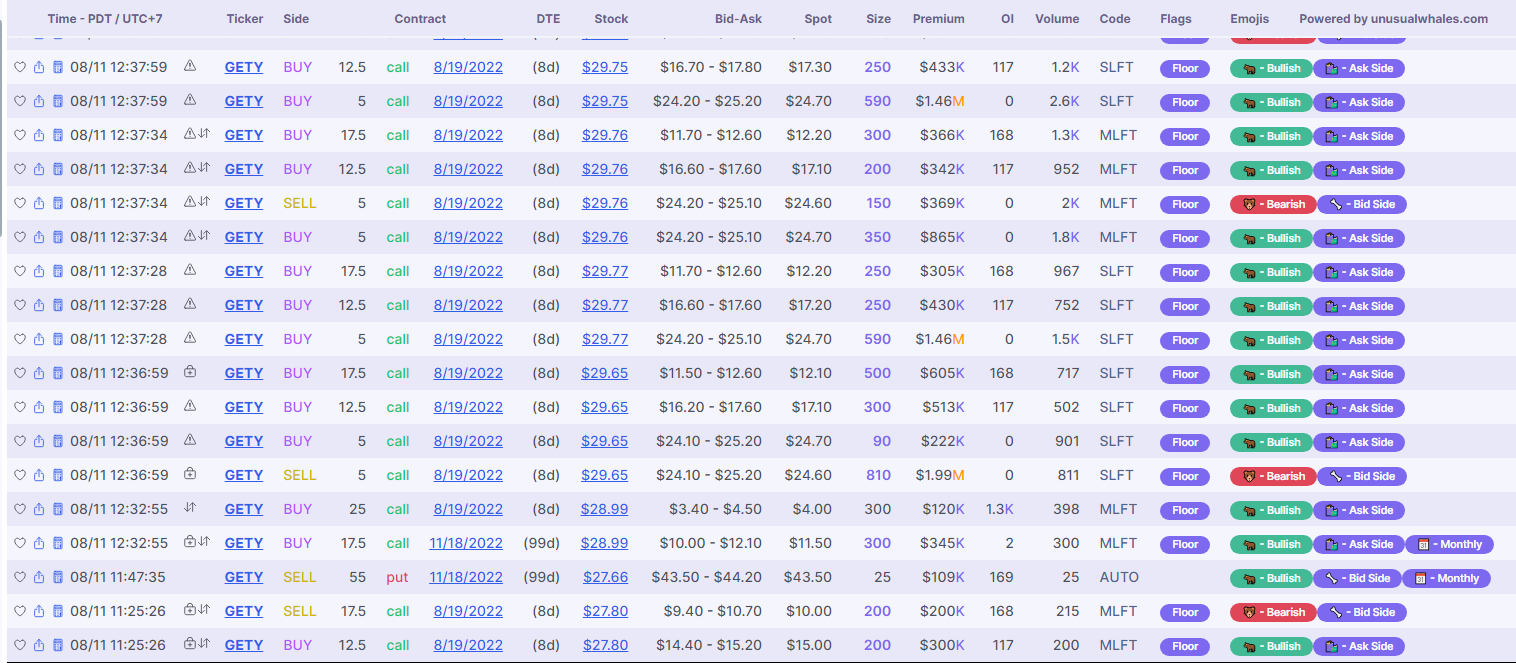
Huge sizes came in during power hour, especially the final minutes. Here are the flows >100K , note that the times are in PST since I’m west coast. Basically, flows >100K only came in during power hour. That EOD move does look like some sort of options-driven move.
meaning all of the volume I saw yesterday was just quick scalp positions being opened and closed presumably over the course of the power hour pump.
While luckily this could mean there’s no “foul play” trying to kill the squeeze, we might not need it because our ramp keeps being pulled out from under us as about 10% of the float worth of itm oi is being rolled to otm positions for the past 2 days.
As I’m looking this over understanding that we’re heading into Opex, what I do know is that 50% of the OI roughly is still in the money which isn’t insignificant as you’ve posted above.
If the float is 508k and 317k of that is out of the money short interest though, my thought right now is that any type of gamma related movement for that 50% could potentially trigger an algorithmic short covering.
I’m not saying this will run to $100 this week on some MM movements but it could get a little pop as it heads to options expiry. I think it’s worth looking at this Monday morning to see if it makes sense to grab a couple calls or some shares in the old boomer account.
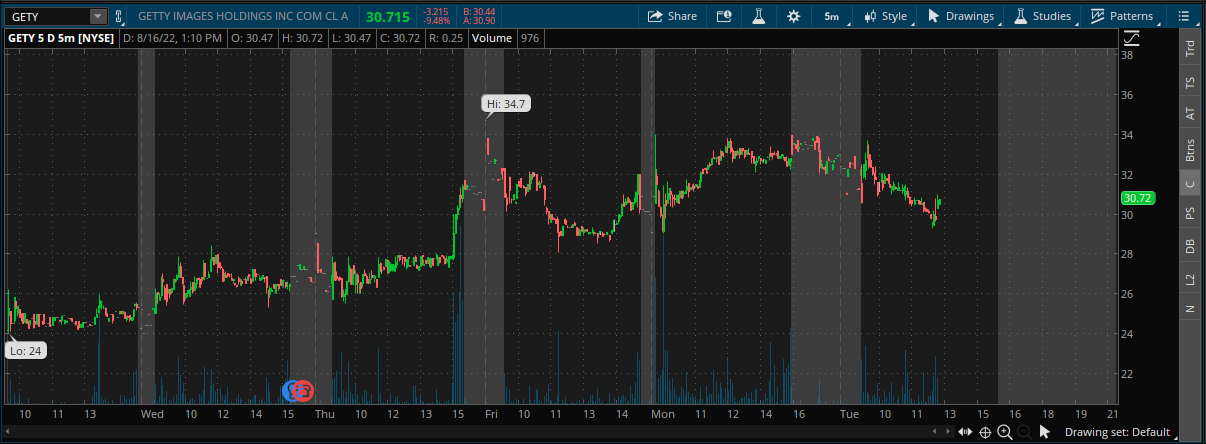
If you’re looking to lose money on GETY this isn’t a bad starting point with the third bounce off $29.30ish. Volume is low so there is a significant possibility of this one being over. This is so late in the game that I’m not really going to make a call one way or another, really just calling out the bounce.
Probably beating a dead horse. Probably chasing the specter of a play that died two weeks ago. But something is weird with this one and I can’t stop looking at it. Something about this one feels off in a promising way.
Options volume today was odd for a day that had next to no volume to say the least. Could it have been exiting? Could we be looking at increased OI? Could it have been hedging? We won’t know until tomorrow morning, but there’s a few points of interest in the below:
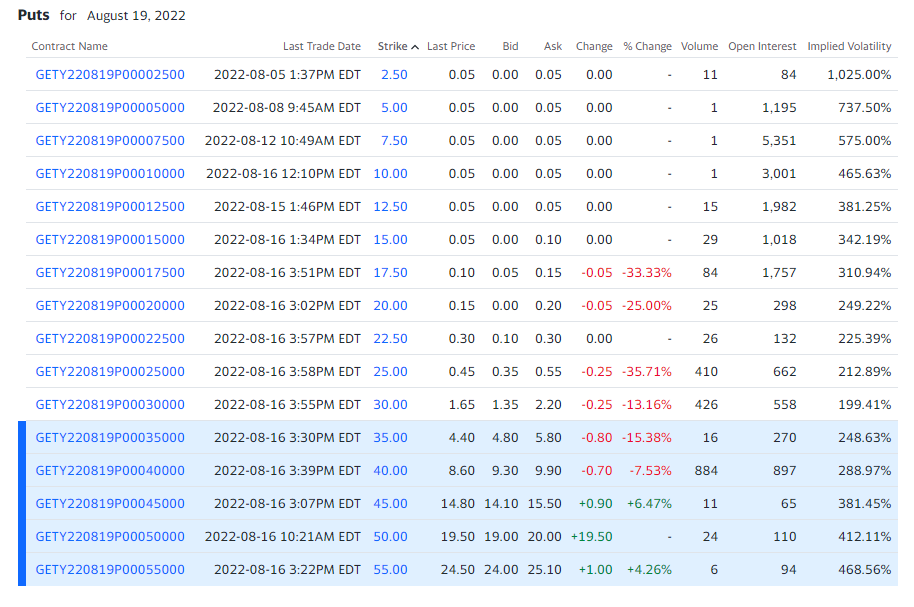
Roughly 3500 volume on the 2.5C and 5C strikes that had no open interest. Represented a 1300% and 1034% increase in IV respectively. If even a quarter of that is added as OI, that would represent an 20% increase in the ITM OI for this ticker
Just across the board, all of the ITM strikes had significant volume against them and an open interest that doesn’t come close to matching. It raises the question that will be answered tomorrow - where the hell did this volume come from and why is there such huge ITM movement?
This ITM volume was 6427 compared to 2597 open interest across those strikes. In August so far we’ve had an average daily volume of 1,231,151. Today was 589,916. To me this looks like huge movement on the options chain without huge movement on the underlying and has given me a serious case of the
Looking to the put side, we don’t see a similar increase in volume - there’s no volume on the puts side that is disproportionately larger than the open interest.
I’ve been watching this on Twitter and on Reddit and while there’s some chatter and some interest, this whole thing is quiet for the most part. That lack of retail sentiment could be a death knell for the hopes of a movement this week, but it feels like something is brewing on this ticker whether retail is on board or not.
What’s particularly interesting is that this stock appears to be becoming even more price sensitive when the volume is removed. Our last big movement on this stock happened on August 11, when it moved $6 from open to close on less than 800k volume. As a matter of fact the biggest movements of late in either direction have not come on big volume.
Seems to be a common theme. Weird that it doesn’t translate into OI. Maybe MMs really do hedge shares this way, somehow? They are from the Floor, which is where MMs trade I believe.
OI is only updated in the mornings so we may see some new numbers and new percentages before market open tomorrow. Someone smarter than me can tell you what time those numbers get updated.
I meant in general. My screenshot showed deep ITM 5c for 08/19 even on August 11 and 12, yet the OI on that option is nowhere near the amount of calls shown. This activity occurred even prior to August 11 beyond my screenshots there. Just strange. Goes to show how much we don’t know about market makers and hedging, etc.
Wouldn’t the exercising of these calls even deep ITM push price upward if they are using that to hedge it should theoretically push price up either next day or day after. If those 5c on the 12th were exercised should have had some upward pressure today however it had a moderate rise yesterday.
If this theory stays true and that’s how they are hedging. I have zero idea if that’s accurate then tomorrow should see some upward momentum. Also I suppose as devils advocate they could be using the ITM calls to dump the price if they were in fact exercised 2 days ago could have led to the big drop today. I have no idea really just throwing ideas out.
Unless the deep ITM calls are sold naked then there is no pressure to push the price up when exercised. All the shares for those contracts should be fully hedged and should not have any effects on exercise. I would think it could maybe cause the price to go down because whomever that exercised will likely sell the shares for profit.
Another point on accumulation of OI for gamma movement. What you need is an acceleration of gamma which can only be caused by a fast acceleration of delta. OI accumulation over time without a fast acceleration of delta will not get you a gamma squeeze. This is why sentiment is the biggest driver in these things because retail sentiment is what pushes the delta up quickly. I personally feel that OI is a way to gauge sentiment and interest on a daily basis but wouldn’t exactly map to hedging since I’m not sure how/when MMs hedge. Theoretically you can have a gamma squeeze without OI increase based on the math.