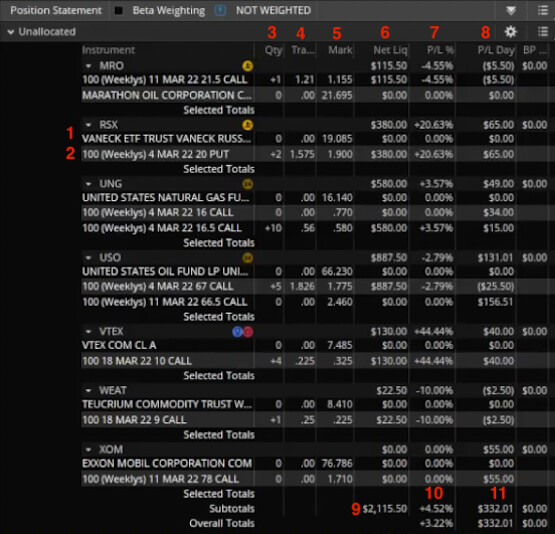
1 - Stock Title
This is the stock the option is for, this can generally be ignored as the ticker itself is right above.
2 - Option Title
This is the title of the option I’m holding, you can see the labeled one is 100 (Weeklys) 4 MAR 22 16 CALL. This contains all the info you need to pull up that same option.
- The 100 is for how many shares are in the contract so it can usually be ignored.
- (Weeklys) denotes whether its a weekly or monthly option, I typically don’t really look at this.
- 4 MAR 22 is the expiration date. From this we know I took an option that expires on the 4th of March, 2022.
- 20 PUT is the strike and type of option. We know that I took at 20 STRIKE PUT from this part.
3 - Qty
This is the number I currently hold. If an option shows up with 0 qty, it means I am no longer holding that position. +2 means I am long two options using our example on line #2. I’m not going to be selling options for quite awhile, but when I get there a -2 would mean I’m short two options.
4 - Trade Price
This shows my cost basis by averaging the contacts I’m currently holding. You can see my average on my RSX puts is 1.575.
5 - Mark
Current trade price of the option
6 - Net Liquidity
How much capital I currently have in a position. For instance my two RSX puts are worth $380.00.
7 - P/L% Day
P/L% of currently open positions. This zeroes out once I sell.
8 - P/L Day
P/L of all positions for the day. Unlike % this doesn’t zero out when I sell.
9 - Total Net Liquidity
Overall value of my positions, how much of the account is currently vested.
10 - Total P/L% Day
Overall P/L% of open positions only. When I sell the % is taken away.
11 - Total P/L Day
Overall P/L of all positions for the day.