Oh hey guys, I decided to write a novel today. The market has been rough these past few weeks. It’s been really hard to play and dependably make money, and I wanted to take a moment to put together an educational post on what has been working for me.
Volume is slowly drying up as the markets are eyeing what direction inflation moves, supply chain issues, and any other number of reasons that may deter people from investing in the stock market. This may not last forever, but there are still great opportunities to make a few bucks on the volatility intraday using some really basic TA and a few patterns that you may find useful.
[size=4]Preamble[/size]
Conq had written a really good article on how algos drive the market when there’s no news. It was really a call to action to read the news, but I’m going to focus on the algo part. Right now volume is light, the markets seem to not being reacting to news in ways that we would think is appropriate. Some of it is delayed reactions, some of it is that the news has already been priced in. Once the news has passed and the news has been sold/bought, though, it’s important to put on our robot hats and think like robots.
A few concepts I want to cover in this blog post are:
- Establishing major points of resistance and support as a daily activity before market open will give you good perspective on what to expect throughout the day
- Establishing intraday high and low Fibonacci retracement levels is a cheat code and a low effort way to establish intraday support and resistance levels
- Understanding basic candle/wick formations is incredibly helpful in identifying trend reversals and helping you time your entries better
- Most importantly, stop using the 1min candles for trend analysis unless you’re making 1min plays
Let’s begin!
[size=4]Resistance and Support Strategy[/size]
We’re trapped in a channel this week. 4080-4170 seems to be where the markets want to hang out until CPI is released, but how will we prepare if we break out of that channel? When do we expect it to stop running or dying? The answer comes in drawing our straight lines with a +/-.50 variance on wherever it lands. The BEST place to establish these lines in my experience is on the 4H/1D charts. Let’s look at today’s 1D chart.

Makes sense, right?? No. We’re going to do something wild that you guys will probably hate because no one uses these graphs practically but let’s look at line charts instead.

I like looking at line charts because they remove the noise. While staring at this chart it’s visually easy to consume double bottoms and tops because everything comes to a very clear and concise point. Is it a perfect science with a 0.01 margin of error? Absolutely not. But we’ll draw our lines and observe the levels, keeping in mind that they don’t have to form absolutely perfect levels to be a general area of interest, they just need to be close enough to make you go “huh, that’s odd.” You can even keep count of how many times that line slope changes angles around that point to add emphasis to areas where it had trouble breaking through.

While I’m not expecting such a huge move today, I can say before the market even trades that SPY will struggle to break $416.00 (I round to nearest $0.50 while doing daily support/resistance), it should be supported by $410.00. If it breaks above my next big area is going to be $427.50, and my next lowest is super doom and gloom at $394.00. If I see a break and hold above or below these levels it may be beneficial to take a 5+ DTE option near the levels I’ve drawn.
I do this EVERY MORNING. 1) I don’t want to carry any bias from yesterday into today, 2) I want to constantly challenge my own levels, soliciting information from the trading floor and asking if I’m seeing what they’re seeing and 3) It makes me a better trader to practice this skill every day.
But SuckyMayor, we’ve been trading in this same stupid $6 channel since 5/27/2022. Should we just try to time the tops and bottoms?
Oh god no. Trying to time reversals is generally a really bad idea. Instead play the intraday levels.
[size=4]Intraday Fibonacci Levels[/size]
I’m not going to lie to you guys. This is the hardest of the two straight line theories to explain because it’s all about gut feelings and constant recalibration when you find out you were wrong, or when upper or lower channels have been breached. There are three ways that I’ve employed fibb retracement on the intraday charts:
- Wild movements in the premarket have allowed me to establish a very clear high and low based on premarket activity
- Premarket was super boring and landed between yesterday’s high and lows, so I’m just going to use yesterday’s levels
- Some wild stuff has happened since market opened and now I want to recalibrate to todays high and low
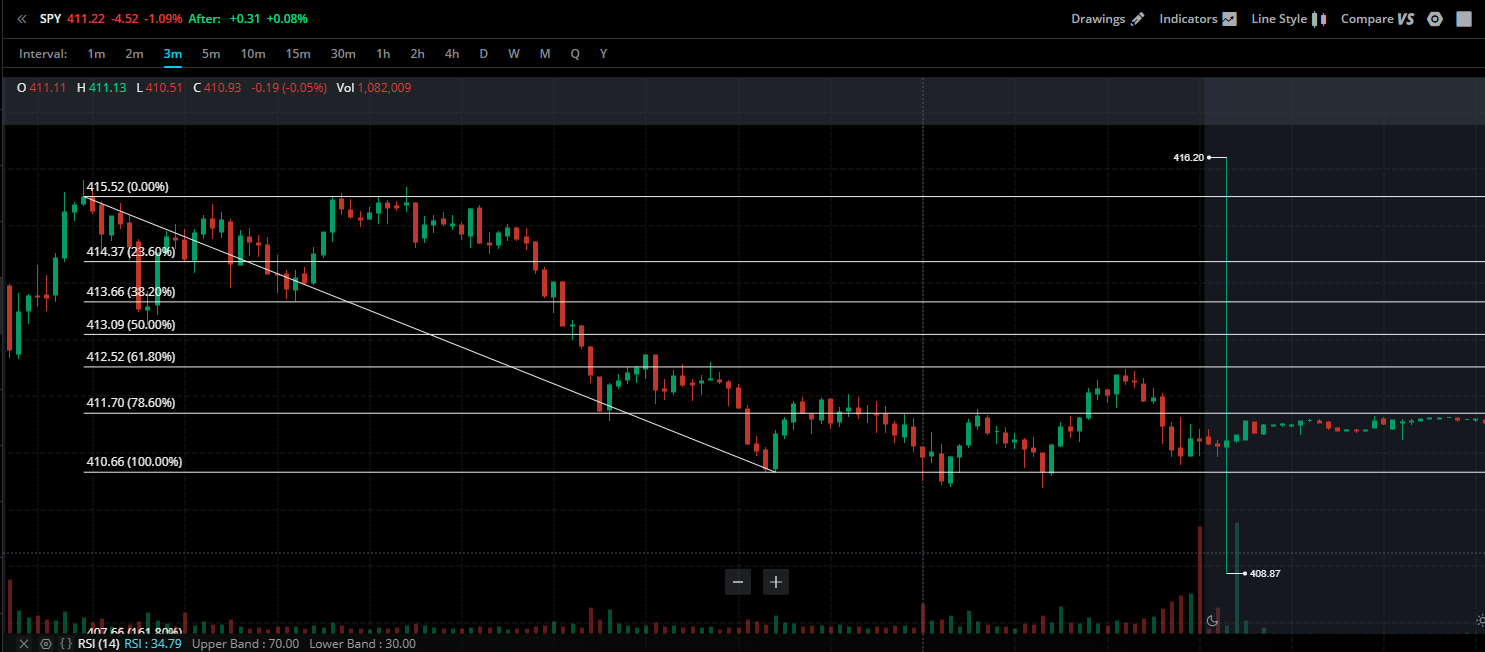
[size=3]Favorable After Hours/Premarket Movements[/size]
Big news loves to drop at 8:30 before we can degen our ways into options, and we’d all be silly to try to Nostradamus the news and try to guess a direction the night before. When there is a big news drop that results in wild movement on SPY or crazy gaps overnight, we can use the tops and bottoms of the premarket to establish some Fibb levels to try to find soft support/resistance throughout the day. For example, on June 3, SPY went from 418 at close to 412 by open. This created a nice big gap between the top and the bottom to draw fibb retracement that pairs with our major support.

While SPY continued to break down for the rest of the day, you can see that it respected the channels created between the fibb levels and the previously drawn supports for the entirety of the day.
[size=3]Premarket Sluggishness[/size]
As strange as it sounds, today, June 8, was a really good example of a super boring premarket. Using the highest and lows of yesterday afternoon’s run up, I can pair a fibb retracement to yesterday and look at how it extends out through today.
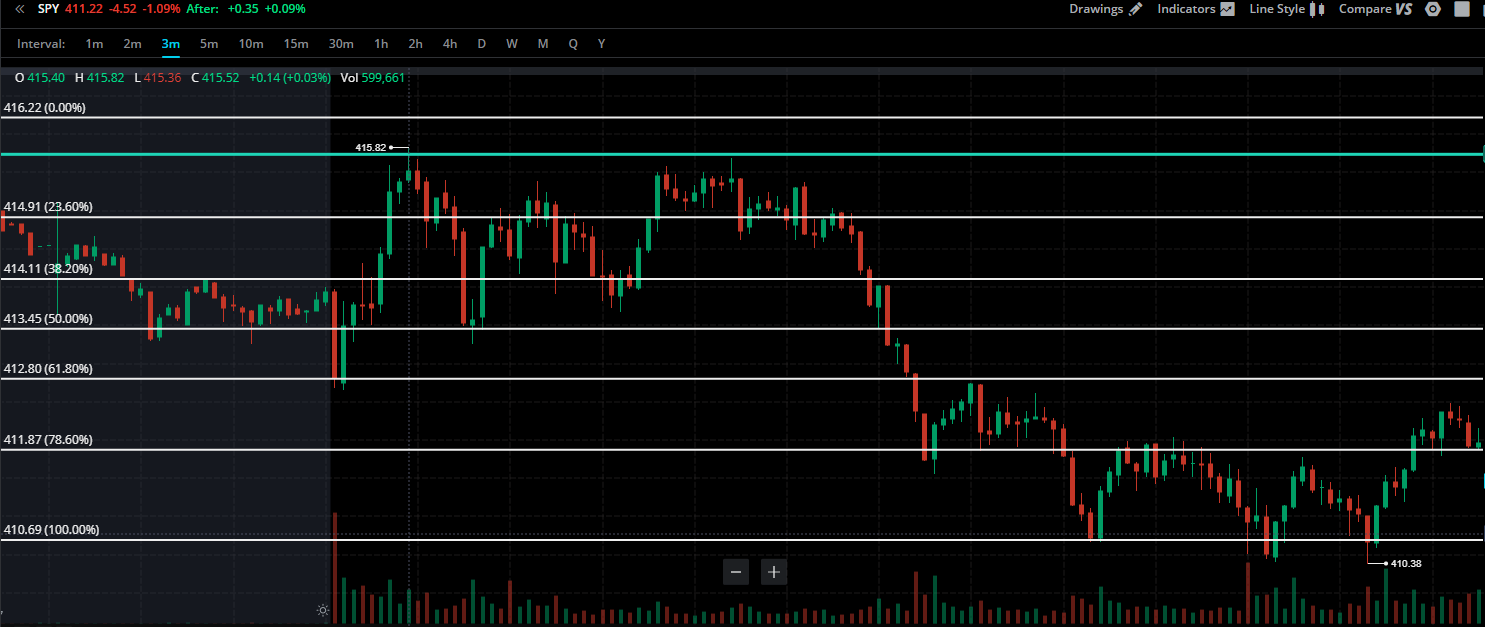
While, again, it’s not perfect, you can see that it maintained these levels pretty well. It also breaks into my next section.
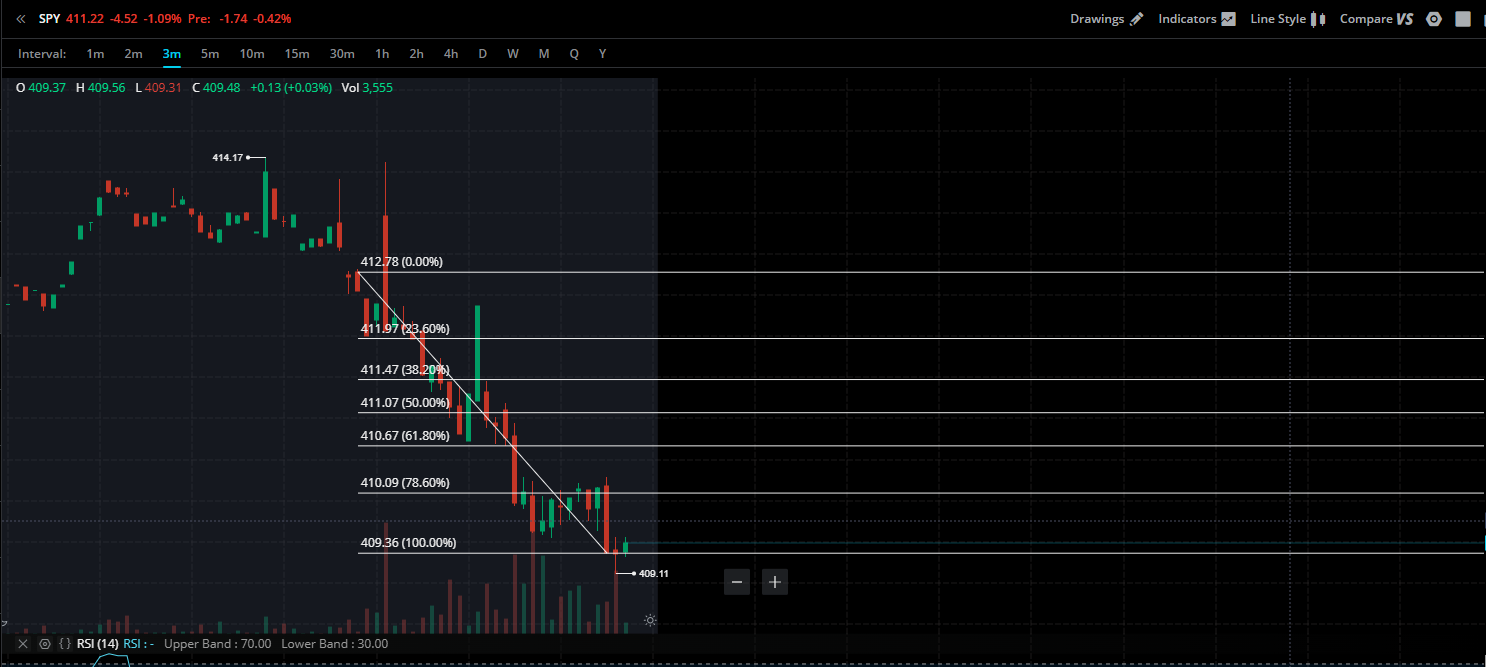
[size=3]Let’s Recalibrate[/size]
The levels established from yesterday are pretty good but they could be better. Especially around 11AM they start to get a little stale. We’ll want to recalibrate to the highs and lows of today.

We’ll see with the new highs and lows established in a smaller range, they’re a little more dependable in terms of the where the candles open and close. As you move on through the day you continue to recalibrate, establishing those highs and lows as they go along, and you’ll find that they start fitting very nicely in channels.
It’s a constantly evolving process, monitoring the behaviors of the candles as you move along. If you start to notice reversals at any of these points or forming double tops and bottoms, that’s when you start to leg into a position. I will take small positions and slowly average down, or if I managed to get it perfectly right I’ll let it ride until I see it approaching new supports/resistance.
Understanding that I’m talking about reversals off of support though, we need to understand how to identify that a reversal is happening or has already happened. That’s where we get into the market psychology of candle formations.
[size=4]Candle Patterns[/size]
I’m not going to write up a big novel on what each candle formation means or which ones you should watch out for. There’s a video I watched that’s actually SUPER informational and also INCREDIBLY cheesy. I’ll just post the link here and I do recommend watching it.
")
This video deals with longer timeframes which is absolutely good if you’re playing LEAPS or other longer-term holds. But it raises an important point for my final section.
[size=4]Chart Intervals Should Reflect Your Trading Strategy[/size]
Alright that’s a long section title. Basically I see alot of people on the trading floor looking at 1min charts and then getting burned when they hold their position for too long, even if they got the entry and the movement correct. Your chart interval should be reflective of the length of time that you intend to hold your position. Don’t make full day and overnight hold decisions based on what you see on the 1 minute chart. Use the 1 minute chart when you’re intending to make a play that’s going to last less than 5 minutes.
Smaller intervals yield smaller gains but are more dependable. If you’re playing @thots_and_prayers 2% challenge, you may find that the 1m interval is beneficial because you can get in, get out, and be done for the day. If you’re looking to make 10-500% in a day don’t expect to get in on a 1min candle without degen-ing into a far OTM small DTE option (and even then, please don’t bank on it, they turn on you really quickly).
Personally I use the 3 minute chart all day because I never intend to hold for more than 15 minutes unless things go terribly right for me. 1 minute is a little too dramatic, 5 minutes is a little too slow. If you watch the above video, the final section will give you some tips on cycling between different intervals to get different perspectives or confirmation of reversals.
[size=4]Conclusion[/size]
TA is time consuming and really only meaningful to the person who is drawing the lines as they understood what they meant when they drew them. Really basic methods can be used to give yourself a leg up in the intraday trades, and you should take a moment to practice really basic, really stupid methodologies because these are the same stupid things that algorithms employ when they’re automatically trading.
Always evolve and adapt your strategies to what works for you. Use basic well-respected foundations and update them to suit your trading style and availability. Remember that what works for me may not work for you, but if you build up a strong foundation of strategy you can be successful in even the choppiest of markets.