Progress update. Still trucking along on development of the dashboard.
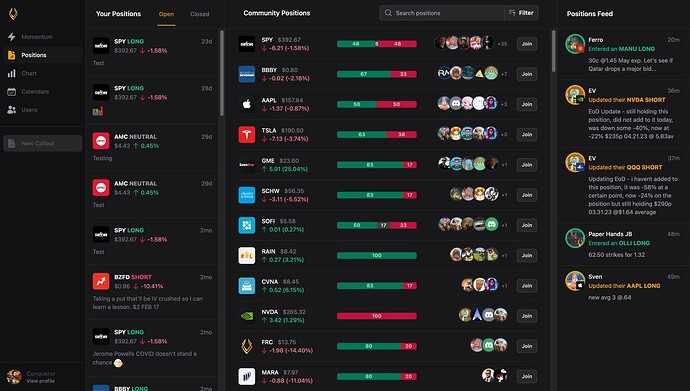
The main positions view is more or less complete at this stage. The goal was to provide a view that allows for easier creation and maintenance of callouts as well as better metrics and visuals for following positions throughout the community as they evolve over time. All the views on the page are dynamic and automatically update as new data arrives.
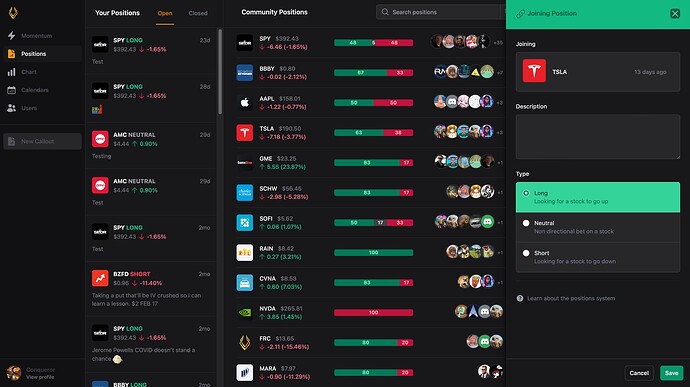
Everything works as you’d assume, positions can be created, updated and exited via the “Your Positions” interface. And both the “Community Positions” and “Positions Feed” UIs allows for joining positions. As you can see below, joining a position pre-fills the ticker field and if you’re joining from an item with a defined direction (ex: the Feed), the direction field is pre-filled as well:
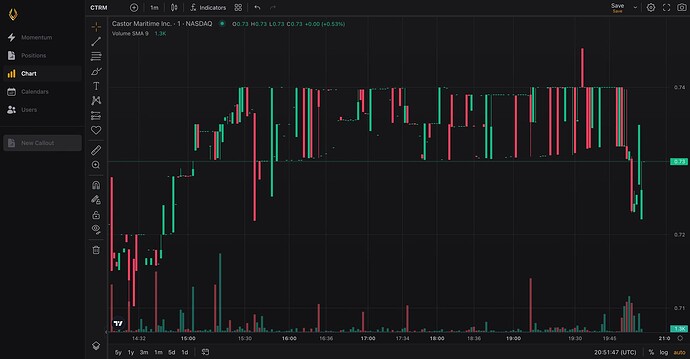
Integration of the TradingView charting library has been completed:
Just have some minor bugs to fix in the moment. Next step is to integrate our positions system markers as well as new markers on the timescale for earnings and events (similar to what you see on TOS) as well as our own overlays which will include the ability to overlay news headlines and tweets onto the bars.
Once the markers are integrated the chart can be used to watch entries in real time as well as provide a potentially more complete picture of a stock’s movement over traditional charting by providing warnings of coming data releases and as I’ll explain in a second, our own community generated events directly on the chart and candles of any stock you’re watching.
Where’s the watchlists dawg?
So all the basic stuff is in but when I went to integrate the current watchlist system I opted not to in favor of starting from scratch with a better version that more directly addresses the issues with the forum as a vehicle for digesting and researching information. That’s been our biggest issue for quite awhile is how to actually file away information and browse it in a way that is more fitting to our short attention spans and the dashboard I think will have the solution via an expanded toolset and it’s integration with the forum.
Catalysts
The idea is similar to the original goal of the watchlist command but slightly more detailed (and actually going to be finished). Catalysts will be the combination of the Positions system, Events system, Scanners and Forum.
A “Catalyst” will take the place of a forum thread as one will be automatically created and maintained by Mimir. There are two types, “Market” and “Individual”. Market catalysts will encompass anything that affects the broader market. Individual tickers can be attached to it to provide examples of what may specifically be impacted by a particular catalyst, but in terms of the system, market catalysts will be global as in their warnings and events will be attached to all tickers. Individual catalysts will only be attached to their specific tickers.
A Catalyst will work as a folder of sorts, anything in the system can be attached to a Catalyst for example in the UI, news will be searchable and if I see a news headline related to a certain catalyst, I can attach it from the UI which will update the thread with that information just as posting to a form thread would. Events can be attached as well, for instance if there is a specific date that I’m waiting for something to happen, I’l be able to create that event in the system and attach it to the specific catalyst.
All this comes together in the Catalyst view where individual items can be broken out, for instance I will be able to see all “attached” tweets if I want, or all events, or all comments, positions, etc. that are related to a particular catalyst.
While I know this sounds somewhat vague here’s a real-world example of this in play:
I see that company A has good earnings via a news headline or the earnings calendar and I’m going to play it at some point today. Let’s say it’s the earnings calendar. I click the item and select “Create Catalyst”, click “Bullish” and type in “This earnings beat was solid, thinking about taking calls”. Mimir then creates a catalyst entry (forum thread) with the pertinent information already attached (the earnings results). Now let’s say they have a press conference later that same day, so when I’m creating the entry I also quickly create an event for the press conference.
This is where the magic happens. Anyone that happens to browse to Company A’s chart will see the catalyst marker AND the event marker directly on the timescale and bars in combination with any positions that have been taken and even “Market” events that may be occurring around the same time. By clicking the markers, they’ll be able to quickly view the related information that was attached, including my initial comment and the earnings info that Mimir attached itself.
Additionally this will be the point where Mimir’s automated functions kick in and watch news and tweets for any sharp changes in sentiment. Any findings will also be attached to the catalyst automatically and again, appear on charts.
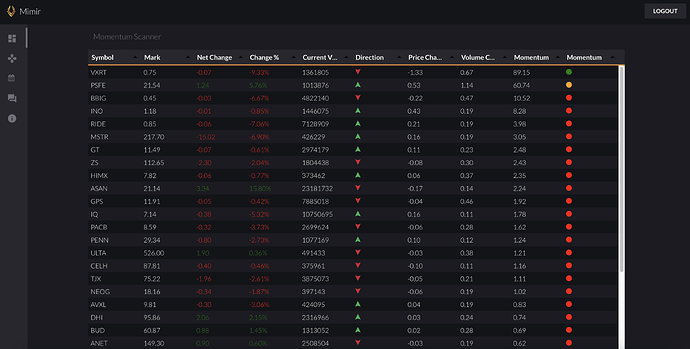
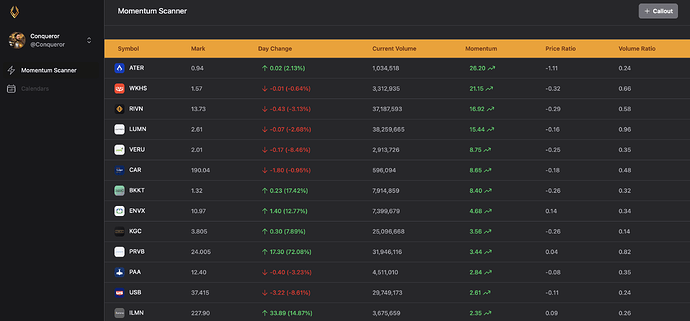
Wrapping up, the Catalysts will receive a view similar to the positions view above with each individual catalyst that is “active” which will be filterable and sortable. Mimir will automatically archive catalysts that have expired events and no positions or go stale but additionally the view will be aided by the various scanners that Mimir just recently got (i.e. momentum and % of volume watchers).
Sorry for the word diarrhea but I wanted to get the general roadmap down since I’m about to begin on the build-out of this part. I think, when finished, this will be the comprehensive tool that the community has needed to efficiently research and stay on top of trading opportunities.
More soon.
EDIT: Using this as a sort of notebook for the moment. The catalyst system should include a ‘fast facts’ function to summarize previous catalysts as a part of an evolving “state”.
