[size=4]Financial & Strategic Analysis of Nvidia Corporation[/size]
By: UnknownPhilosopher
Charts as of Feb 2022, ER updated to present.
Repost from my publication on Word.
==Table of Contents:==
1- Introduction
2-Eternal Environment of the Retail Market For Coffee & Snacks
2.1- Industry Overview and Analysis
2.2-Industry Life Cycle and Market Share Concentration
2.3-Industry Demand Determinants and Profitability Drivers
3-Nvidia SWOT Analysis
3.1- Strengths
3.2- Weaknesses
3.3- Opportunities
3.4- Threats
4- Present-Day Economic Stock Market Challenges
5-Stock Performance & Industry Comparisons
5.1- Technical Analysis & Competitors:
5.3- Implied Volatility Measure & Performance
6- Nvidia Corporation’s Financials
7-References

Introduction:
Nvidia Corporation is an American company founded in 1993 in Delaware and currently located in Santa Clara, California. It is a multinational technology company that innovates microchips and semiconductors while designing CPU’s, GPU’s and supercomputer sites around the world and other processing units for the video game industry and professional market. In addition, it makes microchips for mobile computers and for automobiles which demonstrates its advanced technological reach across various industries and sectors around the world. Nvidia has 7,493 employees working around China, Europe, Asia Pacific, Taiwan and United States and in 50 offices worldwide. While operating on a universal basis, it aims to follow its core values such as innovation, speed & agility, intellectual honesty, and excellence in teamwork. A few companies owned by Nvidia include Mellanox Technologies Ltd, 3dfx Interactive Inc, MediaQ, and Hybrid Graphic Ltd, all contributing to Nvidia’s cloud computing, graphics chips, and software. Nvidia has total revenue of $26.91 billion as of fiscal 2022.
2) Eternal Environment of the Retail Market For Coffee & Snacks
2.1) Industry Overview and Analysis:
Nvidia primarily operates in the gaming and GPU industry, several other sectors such as artificial intelligence, semiconductors, consumer electronics and computer hardware equally contribute to their revenue. Nvidia integrates a platform approach which helped it begin to accelerate revenue in 2013 as it’s TAM rapidly expanded and the demand for GPU’s began to rapidly increase. While in 2020, the GPU market was valued at $25.41 billion, by 2028 various analysts project an increase to $246.41 billion which represents a compounded growth of 32.82 %. This accounted for 87% of total revenues in fiscal 2019 which illustrates the size of the industry. As a result of the large expansion of the video game industry over the past few decades, GPU’s accounted for $3.06 billion of its 2021 second quarter revenue and it continues to develop this technology through streaming multiprocessors, incorporated memory and other advancements in graphics cards. However, Nvidia’s popular and superiority in the computer gaming industry dates back to 1997 when it first launched the RIVI graphics processor and soon it’s 256 GPU which provided a unique and much more enhanced graphics card that rivaled competitors such Intel, AMD, and MSI. Much of the chips that Nvidia is supplied with comes Taiwan Semiconductor Manufacturing Company which is the world’s largest chip manufacturer valued at $550 billion. Asides from the gaming industry, the semiconductor industry has grown from under $100 billion in 1987 to around $600 billion in 2022, a 5.25% compounded annual growth rate. One of the notable investments that consumers look for is in cryptocurrency while selling over $155 million in crypto mining chips in the first quarter of 2021; as a result of the decline in cryptocurrency prices in 2018, the market value of Nvidia nearly declined by 50% while maintain a strong performance since then of just over 650%.
2.2) Industry Life Cycle and Market Share Concentration
This industry is in the growth stage of a company with a medium-level concentration company in semiconductor and GPU industry. Nvidia relies on its diversification across the GPU industry, and with comparison to two peer competitors, Nvidia has over 20% market share as of Q3 2021 while AMD has 18% and Intel with 62% respectively. Although Nvidia does not produce semiconductors, it incorporates it within it’s GPU’s which Nvidia shareholders with strong exposure to the industry.
2.3) Industry Demand Determinants and Profitability Drivers
The industry’s demand for CPU’s, computer processing units and superior GPU’s are a result of technological advancements in computer speed and quality which are a valuable asset across the world. Nvidia’s largest revenue source comes from Taiwan and is estimated to $8.54 billion in 2022 where many individuals utilize the company’s advanced computing performance. Taiwan also produces 90% of the world’s chips which elaborates on the mutual business relationship with Nvidia. This industry is highly affected by global ship shortages that arise from slowdowns in production which can be attributed to Covid-19 in 2020 with many factories and producers shutting down. However, the demand for chips exponentially increased as technology such as iPhones and other streaming devices became rampant as many individuals stayed at home. This increased the prices for the chips and restricted Nvidia from purchasing semiconductors from Taiwan as prices rose sharply. Geopolitical concerns surrounding China and American access to this industry also temporarily halted Nvidia’s ease to renew inventory. However, Nvidia’s demand current exceeds it’s supply as their RTX 3000 cards remain out of stock and its mining graphics cards, CMP’s, are being purchased in large quantities with the recent boom of cryptocurrencies. Due to the decreasing rate of GPU performance speed from its projected 60-80% new line increase in resolution and frames per second (fps) speed, Moore’s law of doubling transistors in microchips every two years is invalidated and poses a threat to Nvidia’s future growth in this sector. However, prices of semiconductor chips are expected to grow 10% in 2022 while Nvidia’s growth is projected to increase in ranges from 50% in 2022 to 10-15% in 2026 due to its total business expansion.
3) Nvidia SWOT Analysis
3.1) Strengths
- Diverse global Technological Innovation: Nvidia specializes in various technological aspects such as accelerated computing, artificial intelligence, virtual reality, 3D cloud-based projections, robotics, and many others.
- Strong Brand Prescence: As one of the few original companies to make GPUs at the early stages of the internet in 1999, they are a highly recognized brand in the PC gaming market, and they set a precedent for their computing achievements in computer video game graphics. The business integrates a go-to marketing strategy (GTM) which is a tactical plan that details how a company can engage with its consumers to persuade them to acquire their product or service and to gain a competitive advantage which helps Nvidia in further expanding their brand. As a result, they are advertised in over 250 media properties and have brand recognition across various gaming devices such as Xbox and PlayStation.
- Wide Strategic Partnerships and Product Portfolio: One of numerous business partnerships include Taiwan Semi-Conductors (TSMC) and an acquisition in 3dfx Interactive in 2000 and MediaQ along with many other graphics and software companies such as Mellanox Technology in 2019. These acquisitions include a variety of talent and technology such ASICs and other network software that benefit Nvidia’s innovation and accelerate inventory turnover. In addition, Nvidia has a partnership with over 229 businesses in the technology sector such as Amazon Web Services and SAS Institute and large channel providers such as Google, Dell, IBM, and many more.
3.2) Weaknesses:
- Market Competition: Competitors in the GPU industry such as AMD and Intel take a 66.1% market share collectively as opposed to Nvidia’s 20%. While AMD does not pose risk at 4.1% to Nvidia’s core demand for its main consumer product, the industry is compressing with older rivals such as Gigabyte, MSI, and ASUS and others such as Shanghai Tianzhu Semiconductors that can make GPU’s much cheaper overseas.
- Low Inventory Turnover: Inventory Turnover is essential for a business to operate smoothly by freeing up cash and not facing liquidity issues with maintaining inventory as the business churns over products. Nvidia’s ITO as of Jan 2022 was 3.27 with an average inventory processing period of 112 ranking it #1111 in total ranking in the overall market and #41 in the semiconductors industry. Taking an inventory average of 5 with a standard deviation of 2.5, Nvidia is facing challenges in this part of their business as a result of a demand and an excess of computer units and parts that it is unable to sell fast enough.
- Macroeconomic Challenges: Due to the semiconductor and chip shortages that occurred since 2020, Nvidia’s production line has slowed down and the company spent billions of dollars to uphold their contracts with large manufacturers such as Taiwan Semiconductors in order to guarantee a supply of GPU’s. While Nvidia announced its next graphics card, RTX 4080, many consumers are pessimistic about the shortages of GPU’s and CPUs as a result of an increasing in manufacturing prices and a decrease in overall supply which can be detrimental to Nvidia’s revenue. Due to global demand and supply shock increasing prices for manufacturers and suppliers, the semiconductor industry has slowed down by 5 to 15% in 2020 from 2019. As a result, Nvidia will spend an additional $10 billion in funding securing RTX 4000 series components to increase its availability which will cost around $700 each. The PC industry is also projected to decline by around 5% while the demand for wired communication will increase by 10% as a result of broadband and cloud more technological infrastructure.
3.3) Opportunities:
- Data & Supply Advantage in Emerging Industries: Due to increasing demand in the technologies industry in 2020 and Nvidia’s innovation, the company has an opportunity to grow its existing Cloud Computing sector and develop advanced computer modelling incorporated into AI. This data center increased sales by 71% year over year and will provide Nvidia with a first mover advantage in developing AI with its existing supply of data and computer inventory.
- Demand in Gaming & VR Sector: The number of US digital gamers amounts to 180M in 2022 and projected to grow by an average of 1% into 2025. This represents over half the population of America and although is already saturated by many technology companies, the Total Addressable Market is valued at $200 billion in 2021 which represents a huge opportunity for growth in selling GPU equipment for gaming. Virtual reality is an emerging market and with Facebook making the switch to Meta in 2021, the products in this industry are expected to be valued around $15.5 billion while increasing by 78.5% since 2020. Nvidia delivers next-generation technology in the VR industry and can become one of the global leaders of drivers and developers which can be an additional revenue stream.
3.4) Threats:
- Skilled Labor Shortage: Manufactures and producers require skilled labor both to work in creating the units and equipment such as microchips manufacturing facilities and designing the technology to gain an edge over competitors. Due to the layoff of workers and the shift to remote labor and an increase in turnovers, Nvidia can have difficulties not only finding the right candidates but in maintain in their current production and product growth.
- Hackers & Cybersecurity: As programmers become more advanced in coding and encrypting data, the rise of malicious hackers can pose a threat to technology companies in cloud computing and processing. These hacks can damage Nvidia’s internal systems and can disrupt sales of products such as GPU’s that mine crypto with the rise of data and technology hacking. While projects such as Nvidia Morpheus have been launched to face this cybersecurity challenge, it has to require more developers and allocate a larger portion of their revenue in order to protect their technology against viruses and malicious attacks.
- Present-Day Economic Stock Market Challenges:
- Due to inflationary concerns (7.5%) and the risk of the FED hiking rates in March in order to being their QT period back on track since it was started in late 2018 and ended in early 2020 as a result of covid, there will be significant outflows in the stock market which will negatively weigh on overleveraged and elevated asset prices when the excess cash is taken out of the system. This will cause corrections throughout indexes. It is also key to note that the supply chain issues as a result of inflation caused numerous chip shortages as suppliers demanded a steeper price for the same products. Inflation also causes supply chain bottlenecks and increases America’s chip shortage since domestic auto production decreases while modern vehicles cannot be produced without microchips. Furthermore, manufacturing industries use semiconductors and as the price gap between the dependence of the chips increases, the manufacturing output drastically decelerates. As Taiwan Semiconductors supplies Nvidia, the FED hiking rates can strengthen the dollar which can mean that Nvidia can sell less goods and prices can be elevated domestically. Nvidia along with other semiconductor businesses will cut back on spending with elevated interest rates and decrease revenues. The current interest rates are near 0% and can be raised to 2% if the FED becomes more hawkish and seeks to challenge the ongoing inflation.
5) Stock Performance & Industry Comparisons ($NVDA):
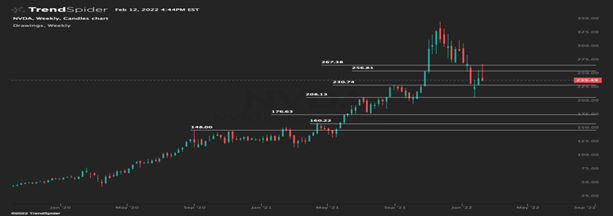
5.1) Technical Analysis & Competitors:
5.2) Nvidia Stock Overview:
- Average Volume (3M) = 50.66M
- 5Y beta = 1.38 (Volatility)
- P/E Ratio = 75
- P/S = 36.56
- Shares Outstanding = 2.5B
- Free Float = 2.4B
- Free Float Market Cap= 581.87B
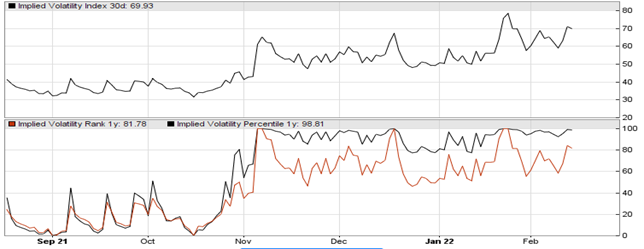
5.3) Implied Volatility Measure & Performance:
Semiconductors 1.5x more volatile than SP, Nvidia being in top quartile of volatility (70-80%).
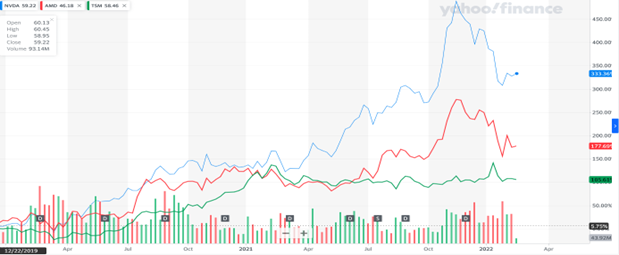
From January 3, 2020 – April 4, 2022
Nvidia Corporation ($NVDA) appreciated 316% ($60-250), AMD appreciated 135% ($45-106), Taiwan Semiconductors appreciated 70% ($60-102). As comparison to S&P 500 (SPY), it appreciated 46% and semiconductors index ($SOX) 80%. While past performance does not indicate future success, Nvidia has demonstrated that it is the industry leader despite it being more volatile.
6) Nvidia Corporation’s Financials:

8) References:
1.1)
- “NVIDIA Company History: Innovations Over The Years”. NVIDIA, 2022, NVIDIA Corporation: History.
2.Burud, Hemaja. “Nvidia Company Belongs To Which Country?-Everything About Nvidia - Technozive”. Technozive, 2021, Nvidia Company Belongs To Which Country?-Nvidia Company Details 2023 - TechnoZive. - “Nvidia”. Fortune, 2022, https://fortune.com/best-companies/2020/nvidia/.
Johnston, Matthew. “4 Companies Owned By Nvidia”. Investopedia, 2022, 4 Companies Owned by Nvidia.
2.1)
- Mujtaba, Hassan. “Intel & AMD GPU Shipments Decreased In Q3 2021, NVIDIA Sees 8% Increase In GPU Market Share & Retains Discrete GPU Share Leadership”. Wccftech, 2021, Intel & AMD GPU Shipments Decreased In Q3 2021, NVIDIA Sees 8% Increase In GPU Market Share & Retains Discrete GPU Share Leadership.
- McKenna, Beth. “Why NVIDIA Stock Plunged 31% In 2018 | The Motley Fool”. The Motley Fool, 2019, Why NVIDIA Stock Plunged 31% in 2018 | The Motley Fool.
- “Semiconductor Market Size 2022 | Statista”. Statista, 2022, Semiconductor market size 2025 | Statista.
- “GPU Market Size Worldwide 2020-2028 | Statista”. Statista, 2022, GPU market size worldwide 2023-2029 | Statista.
- Bovaird, Charles. “These 2 Nvidia And Intel Suppliers May Surge On AI”. Investopedia, 2019, These 2 Nvidia and Intel Suppliers May Surge on AI.
2.2)
- Mujtaba, Hassan. “Intel & AMD GPU Shipments Decreased In Q3 2021, NVIDIA Sees 8% Increase In GPU Market Share & Retains Discrete GPU Share Leadership”. Wccftech, 2021, Intel & AMD GPU Shipments Decreased In Q3 2021, NVIDIA Sees 8% Increase In GPU Market Share & Retains Discrete GPU Share Leadership.
2.3)
- “Nvidia Revenue By Country/Region 2022 | Statista”. Statista, 2022, Nvidia revenue by region FY2024 | Statista.
- Weber, Jonathan. “Nvidia Stock In 10 Years: What You Should Consider (NASDAQ:NVDA)”. Seekingalpha, 2021, https://seekingalpha.com/article/4442717-nvidia-stock-in-10-years-what-you-should-consider.
3.1)
- Bhasin, Hitesh. “Marketing Mix Of Nvidia - Nvidia Marketing Mix”. Marketing91, 2019, Marketing Mix of Nvidia and 7Ps (Updated 2024) | Marketing91.
- “Nvidia Acquisitions | Acquiredby”. Acquiredby, 2022, https://acquiredby.co/nvidia-acquisitions/.
- “NVIDIA Partnerships · Partnerbase”. Partnerbase.Com, 2022, NVIDIA Partnerships · Partnerbase.
3.2)
- Syed, Areej. “AMD’s Dgpu Market Share @ 4.1%, NVIDIA @ 20%, Intel’s Igpu Share At 62% [Q3 2021 Overall GPU Market Share] | Hardware Times”. Hardwaretimes.Com, 2021, https://www.hardwaretimes.com/amds-dgpu-market-share-4-1-nvidia-20-intels-igpu-share-at-62-q3-2021-overall-gpu-market-share/.
- “Nvidia (NVDA) Inventory Turnover Ratio, From Fourth Quarter 2021 To Fourth Quarter 2020, Current And Historic Results, Rankings And More, Quarterly Fundamentals - Csimarket”. Csimarket.Com, 2022, https://csimarket.com/stocks/singleEfficiencyit.php?code=NVDA.
- Bauer, Harald. “Coronavirus: Implications For The Semiconductor Industry”. Mckinsey.Com, 2020, https://www.mckinsey.com/~/media/McKinsey/Industries/Semiconductors/Our%20Insights/Coronavirus%20Implications%20for%20the%20semiconductor%20industry/Coronavirus-Implications-for-the-semiconductor-industry.ashx.
3.3)
- Cohen, Peter. “Nvidia Reports Record Q4, FY21 Revenue On Strong Data Center Growth”. RCR Wireless News, 2022, https://www.rcrwireless.com/20220217/telco-cloud/nvidia-reports-record-q4-fy21-revenue-on-strong-data-center-growth.
- Intelligence, Insider. “US Video Gaming Industry In 2022: Gaming Devices & Video Game Content Viewership Trends”. Insider Intelligence, 2022, In-Game Advertising: US Gaming Stats, Ad Types, & Video Game Trends.
- “Futures Of Virtual Reality- Market Trends And Challenges”. Siftwaretestinghelp.Com, 2022, https://www.softwaretestinghelp.com/future-of-virtual-reality/.
3.4)
- Selko, Adrienne. “The Skilled Labor Shortage Threatens Manufacturing’s Full Recovery, Says Study”. Industryweek.Com, 2021, The Skilled Labor Shortage Threatens Manufacturing Sector’s Fully Recovery Says Study | IndustryWeek.
- Gately, Edward. “Threat Actors Leaking Information From Nvidia Cyberattack”. Channel Futures, 2022, https://www.channelfutures.com/security/threat-actors-leaking-information-from-nvidia-cyberattack.
4)
- Leibovici, Fernando, and Jason Dunn. “Supply Chain Bottlenecks And Inflation: The Role Of Semiconductors”. Research.Stlouisfed.Org, 2021, Supply Chain Bottlenecks and Inflation: The Role of Semiconductors | St. Louis Fed.
5)
6)
- Corp, NVIDIA. “NVIDIA Corp (NVDA) Trailing Returns - XNAS | Morningstar”. Morningstar.Com, 2022, https://www.morningstar.com/stocks/xnas/nvda/trailing-returns.
- “NVIDIA Current Ratio 2010-2022 | NVDA”. Macrotrends.Net, 2022, NVIDIA Current Ratio 2010-2024 | NVDA | MacroTrends.


