Reddit post where someone said they analyzed all the data for Q3 from the website I linked above. They think OPEN will blow out earnings by 35% on revenue, with good guidance/outlook for Q4. Based on the sales that I saw in that one Texas market, sales do seem to be going well, and the stats website indicates that is their biggest market at the moment.
I’m kind of new so this might be a dumb question, but I’ve been keeping up on all of your posts and you’ve convinced me that they will do good on earnings. But I’ve seen companies do good on earnings, yet the stock still goes down. Is that a possibility or not?
So just to be clear, this is definitely a gamble play - I don’t know for a fact which way this will go. I think most of the negative sentiment is just based on Zillow, with the data indicating that OPEN should be performing much better than Zillow did, and much better than OPEN’s original guidance indicated. The thing that would make me concerned is that the price has been dropping, but a lot of their revenue numbers should be based on public information (if you have access to the MLS in their markets, you should be able to see what they buy and sell their houses for). Granted, it’s not that easy to pull all this info together, but I would think large institutions should be able to see this information easily enough. So if that’s the case, is the stock dropping just based on the poor sentiment, or is there a data driven reason the price is dropping?
1 Like
Anything is possible, but I would think that if they crushed earnings estimates and had great guidance, that they would at least return to where they were and not drop further. Do you have examples of companies that had good earnings and good guidance that also went down?
When I see them go down from good earnings I usually only look at that number, so I’ve never thought about how the company is being guided or maybe they missed what they were predicted to hit. So I’m sure they probably weren’t going in the right direction. But I do see how if they crush the earnings and the guidance they have it’s more probable for the stock to go up.
Thanks for answering my question.
No problem - just think about it like this (with an extreme example): if a company made a few billion dollars (beating their estimate of $1B that quarter by a few hundred percent) but then said they plan on going out of business next quarter, do you expect their stock to go up or down? It should go down because who would want to own stock in a company that is going out of business?
1 Like
Not just out, this article is a week old, but if true then the question as to whether just a few, or most, markets slowed down recently may be “most”.
Is it really that surprising?
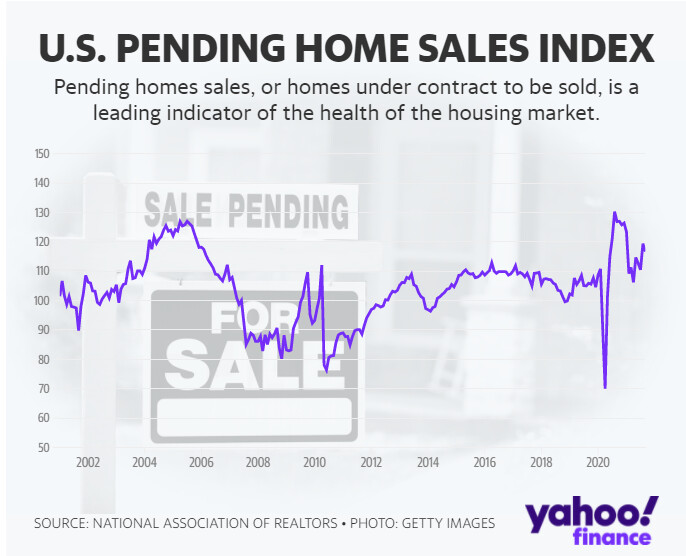
Comparing to year over year home sales, those probably peaked last year as people were trying to get out of cities so they weren’t confined to an apartment the whole time (at least that’s what it seemed like, living in New England). At this point, there is probably less of that happening now that things are some what “back to normal”. They do say that the Northeast recorded the largest drop in activity, and luckily (for earnings at least) OpenDoor has no activity in the Northeast yet.
From a month to month perspective, looking at that graph, the index is almost always lower in September compared to August. I would think this also makes sense since if you are moving with kids, you probably want to be in the new place so they start at their new school at the beginning of the year.
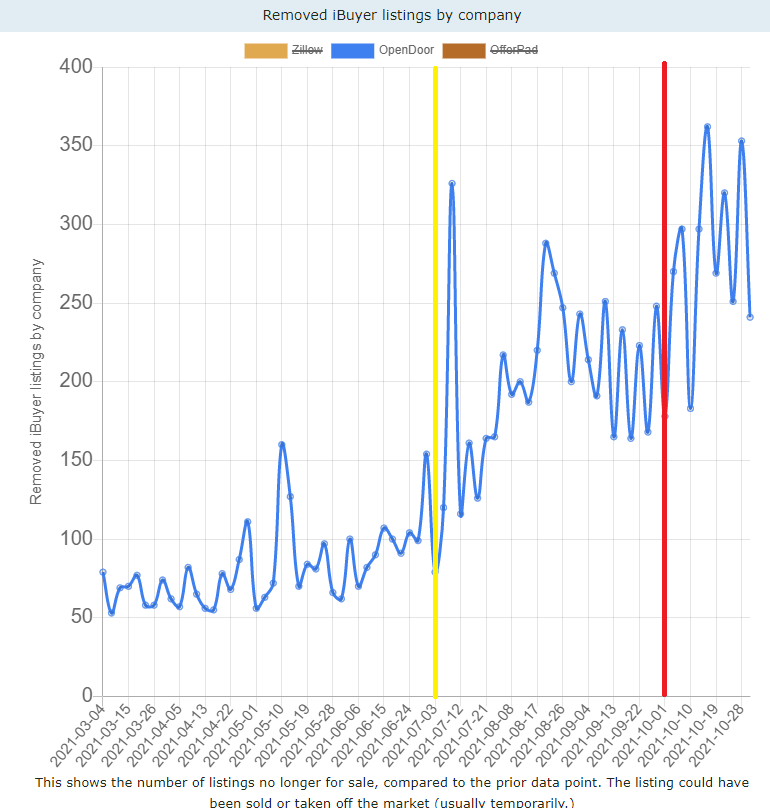
Here is the ibuyerstats.com graph, that shows removed listings for OpenDoor (as noted, this could be because of sale, or to remove it temporarily, but for our purposes, lets assume that the ratio of sales vs. removal for other means is fairly consistent). I’ve added lines indicating the start of the quarter in yellow and the end of the quarter in red. While July and August had some big spikes, September looks pretty strong and consistent. And the October numbers look even better.
Some more charts, because why not:
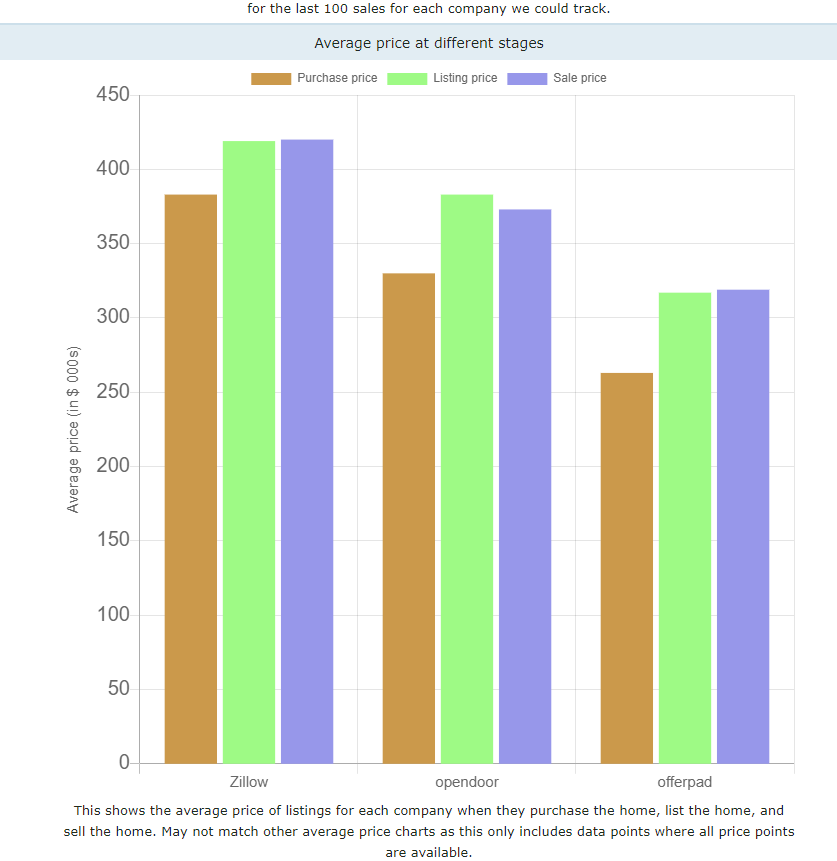
Average sale price for OpenDoor, for the last 100 sales was $373k. Based on their financial statement, their revenue for Q2 divided by homes sold was $340k. Now, keep in mind that revenue also includes things like the buyer fee and any other value-added services that get tacked on to the selling price, so $340k is probably high for the average house sale price, but $373k house sale price is probably low for overall revenue. Let’s say their average revenue per house sold in Q3 is $357k.
I went through the graph I posted in the above post and grabbed all the values of all the points for Q2 vs. Q3. Note that OpenDoor indicated they sold 3481 houses last quarter, based on their financial statement, but the graph only have 2656 houses removed that quarter - the person who runs the site said that it appeared they were undercounting the number of OpenDoor houses for some reason. Let’s say that the proportion of undercounting is equivalent between quarters (i.e., multiply houses removed in Q3 by the number of houses sold in Q2 divided by the houses removed in Q2), that would mean they sold 6890 houses in Q3. If they made $357k per house sale, revenue would be $2.4B, which is under what the Reddit post I forgot to link to indicated, but still higher than their previous guidance and the Webull estimate. And if the estimate from the Reddit post is correct, that’s even better.
| Houses Removed | Houses Removed | ||
|---|---|---|---|
| April | 721 | July | 972 |
| May | 938 | August | 2185 |
| June | 997 | September | 2100 |
| Total removed | 2656 | 5257 |
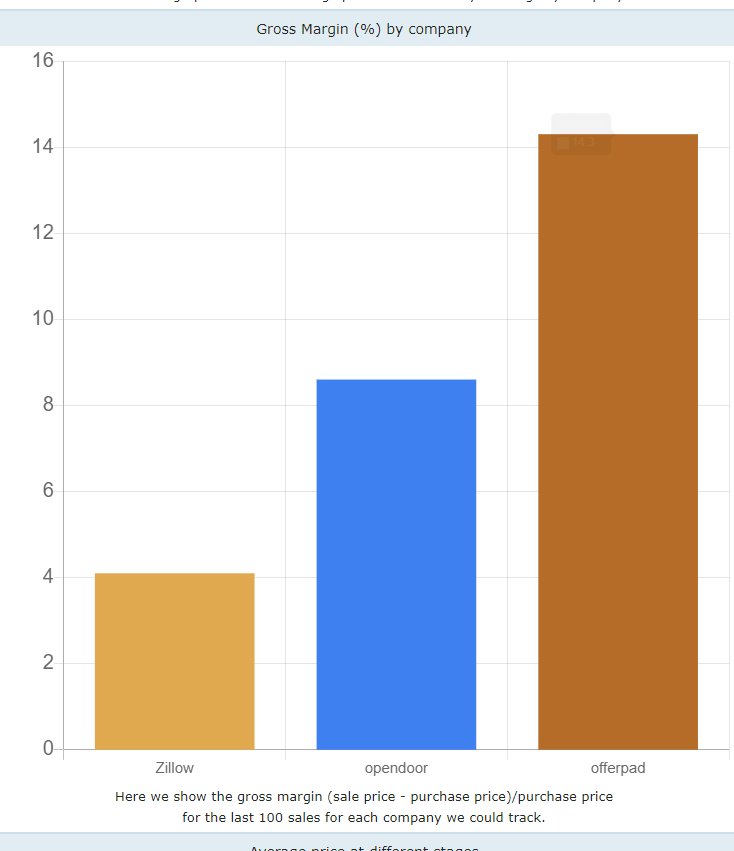
The only negative that I see from the stats website is that OpenDoor’s gross margin seems down, but since they only looks at the difference between sale price and purchase price, it’s missing a portion of the revenue calculation. They’ve also indicated in their guidance that they anticipate lower gross margin as revenue climbs, so this should not be unexpected.
Again, this is still a risky play, but looking a bit more at the data makes me feel a little better about OpenDoor meeting and exceeding expectations for the quarter. And based on the data so far for October, it seems like they may even improve their outlook for Q4.
1 Like
This was mentioned in one of the linked Reddit threads in passing, and I think deserves more attention. Keith Rabois is an incredibly smart but incredibly egotistical fellow and has been posting tweets that suggest OPEN will crush Q3 earnings, bordering on MNPI. You can almost taste the bitter vengeance of ZG’s failure in his tweets as well. He’s basking.
SPAC daddy Chamath also spoke briefly on the latest All-In Pod episode about why OPEN is distinctly different to Zillow in strategic approach but also in their margins. I don’t have a position but will be considering a lotto play tmr. Thanks for writing up this DD, great stuff.
1 Like
Yeah, I’ve been following Keith Rabois since I saw the links posted in the Reddit DD. He says he has no MNPI and that statement to see the Q3 numbers was a typo lol. Some tweets:
https://twitter.com/rabois/status/1456287903022260232?s=20
https://twitter.com/rabois/status/1456273934064578561?s=20
thank you for the dd man. i got one call just to join you and down bad on spy calls. im also feeling pretty good about this DD analysis (actually slightly better than the wish puts) so hope it works out!
EDIT: congratulations to all that played this. we eating sushi tonight
1 Like
Impressive work Dakk and crew. Thank you!