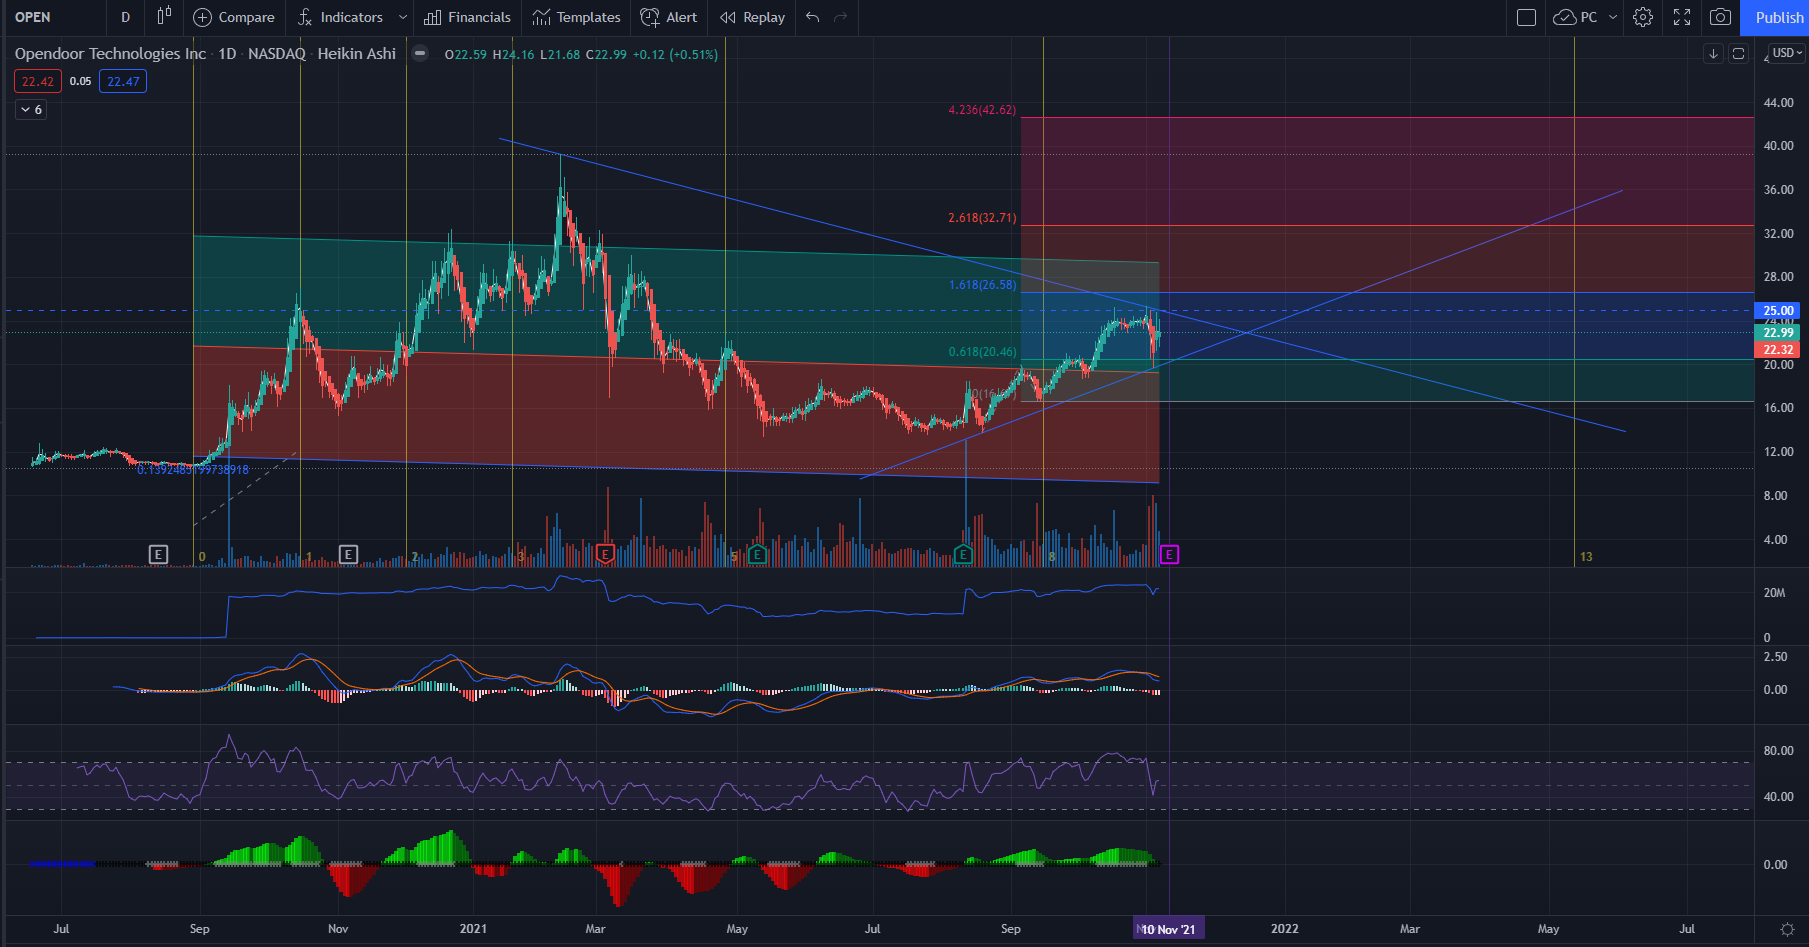
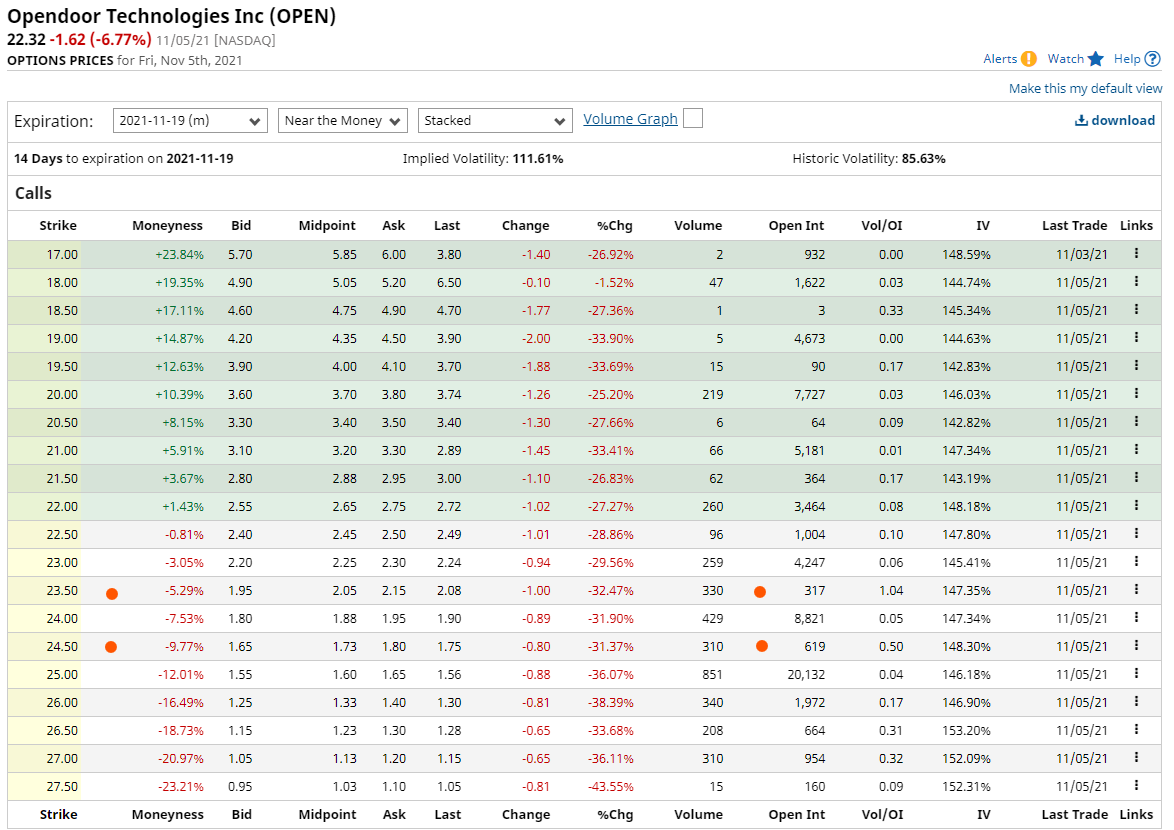
OpenDoor Technologies Inc. has its earnings call scheduled for 5pm (ET) next Wednesday, November 10, 2021. They provide a digital platform for buying and selling real estate, using an “iBuying” platform. Between the last earnings call and before Zillow’s earnings call, the stock had climbed about 66%, from about $15 to $25. After Zillow’s earnings call, when they stated they would be exiting the home buying/renovating/selling market, OPEN’s stock tanked about 15%, likely based on the premise that if Zillow was having trouble in this market due to labor/material cost issues, that OPEN would also be having this issue. After two days of drops, OPEN rose about 15% yesterday, November 4th, but it is back down about 8% so far today (1:25PM), November 5th.
If this drop is purely associated with Zillow’s issues, I think that this is a mistaken association and OPEN should rise on earnings, because their business model does not rely on buying houses to “flip” them for maximum sale price (by renovating/remodeling and reselling). OPEN’s model is to buy houses for cash that are in good shape, keeping closing time short for buyers (maybe with minor repairs, which would be on the homeowner, as far as I understand it), and then resell them as soon as possible. They charge the seller a fee, similar to a real estate agent mediated sale, between 5 and 14%, which is dependent on how long they anticipate holding the property before sale. They are not buying houses that need work, the expectation is that the house should be ready to be sold, they are just helping the buyer get out of the house after than they would be able to if they were waiting for a sale on their own. So, as long as OPEN is accurately pricing the houses so they aren’t holding them very long, this should be pretty lucrative.
I had some discussion related to OPEN with someone in #spy-qqq-earnings last night, some of that can be found below:
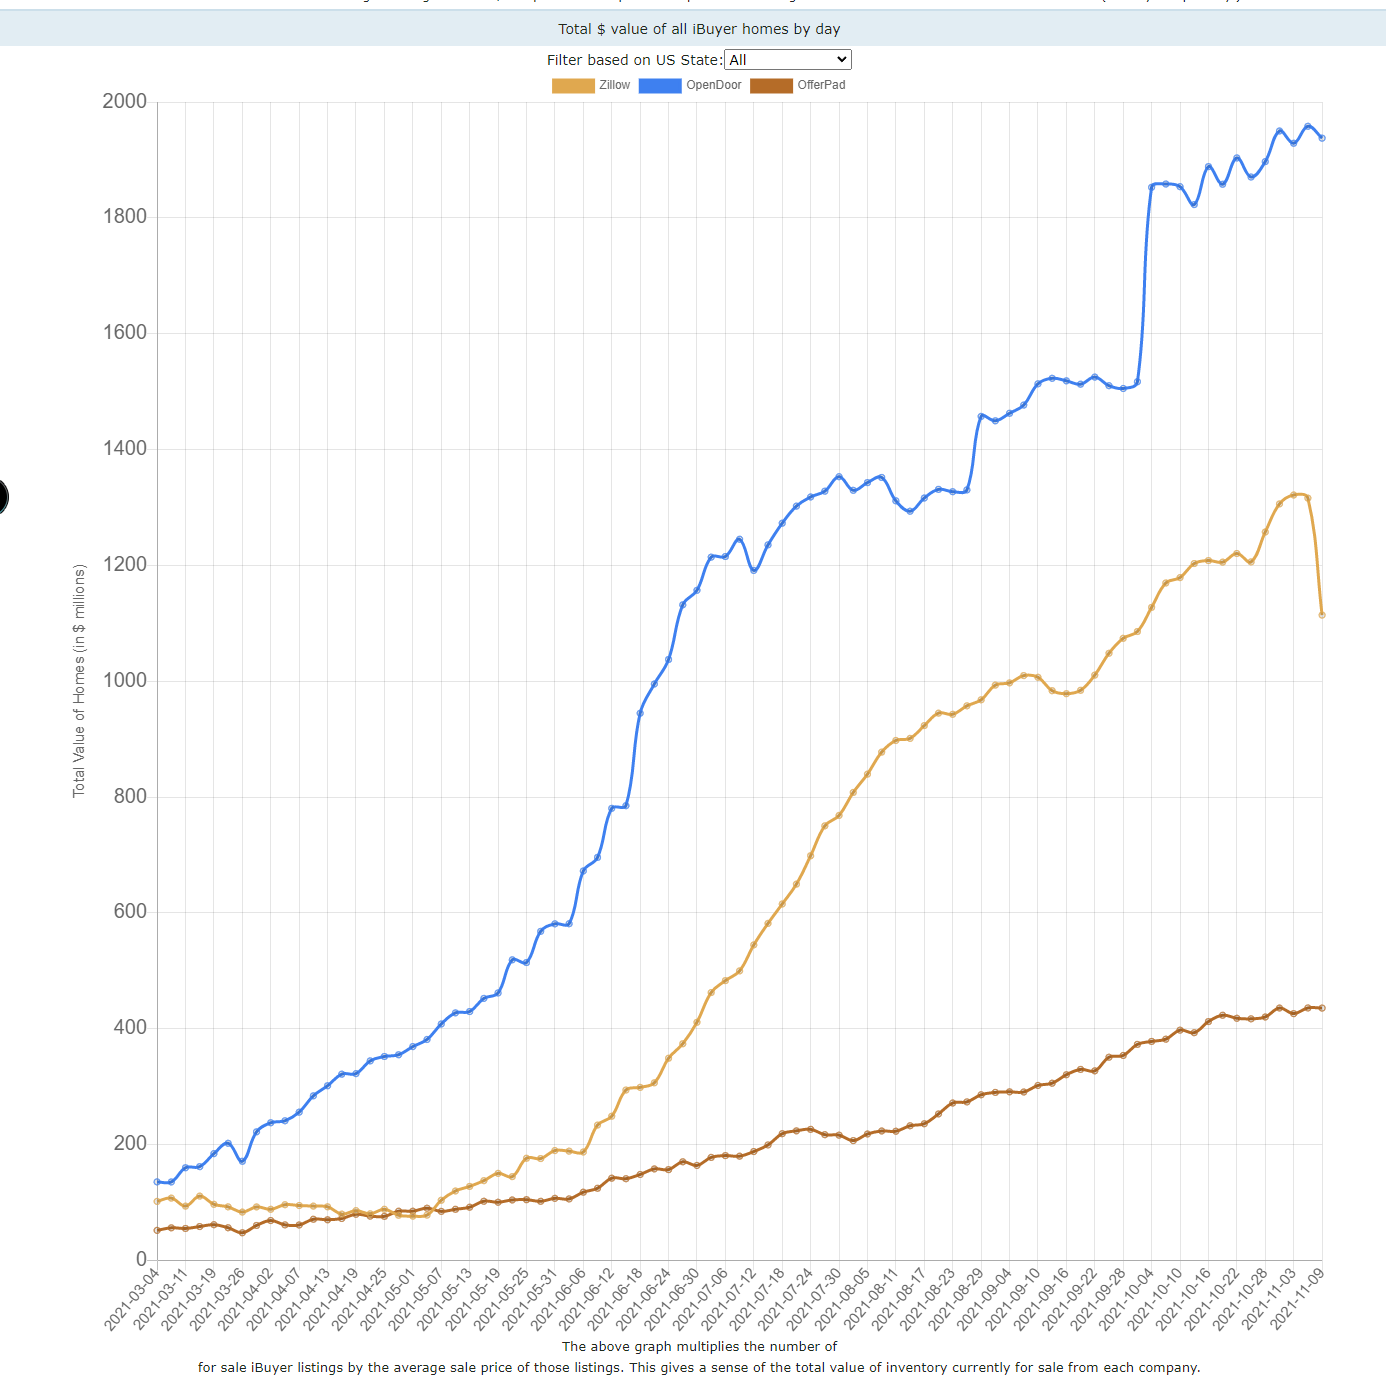
kaisersose FWIW. I sell houses to open door and the like. They all overpay. I will say OD has started to get more accurate with their repair costs but they pay far more than any local investors I sell to. Zillow wasn’t very aggressive in my market but OPAD and OPEN are.
DakkJaniels that’s good info, thank you. Do you have an idea how long they hold those houses?
kaisersose Both OPEN and OPAD turn them around pretty quick. Some are immediate if they’re in good enough condition. But they both buy shit that I could list myself and not get what they pay. Something has to give at some point. None of the iBuyers seem to have figured it out just yet. I don’t see how it’s sustainable. OPEN has the best shot IMO.
DakkJaniels wait, just so I understand are they basically just relisting for the price they paid? are they going lower? higher? they also take ~5% of whatever their offer is, right?
kaisersose 8%, hence the brokerage comment above
DakkJaniels yeah it sounds like they do repairs, but they take that out of the cost, right? It sounded like they give you a list of things that need to be done
kaisersose They do but the some/most of the folks coming out to look at repairs don’t know what things cost. But as I said they’re starting to figure that side out better. But they still grossly overpay. OPEN doesn’t require near the seasoning requirement for someone like me to have owned something before they’ll buy it.
DakkJaniels I think I’d be ok with “overpayment” as long as they aren’t taking a lose on the property resale. They are probably trying to make it up with volume, I would think. What are your thoughts on that?
although, it does seem that they do have a loss from operations, so that does need to get figured out, but gross profit is like 13% of revenue which is nice - they just need to work on low
kaisersose Well I’m okay with overpayment so long as it’s to me. But yes they are doing volume and are getting more aggressive with their direct mail. I’ve received mailers every month for the last 3 months. They’re a bit of a hybrid ibuyer/ibroker. No agents or real boots on the ground other than the contractors that go out and do bids and repairs.
DakkJaniels are you doing home flipping yourself, and then just unload it to them? I think as long as they can get their overhead costs under control (or increase volume enough to make this less relevant) their model could work
kaisersose No I market to their criteria as a local buyer and then close on it and sell to them. When executed properly I know what they’ll pay before I even show up to make an offer on the home. I’ve had to adjust my thinking because I can pay more than I normally would pay for these house based on what I know they’ll pay.
There is also some DD on Reddit regarding OPEN and their CEO Co-founder and Executive Chairman: https://www.reddit.com/r/wallstreetbets/comments/qlyhml/open_the_most_undervalued_moat_of_all_time/
I think the problem with Zillow is that they were trying to predict what they could potentially get for a house after performing renovations. In OPEN’s case, while kaisersose indicated they are “overpaying”, I think they are just paying what it takes to get the transaction to move quickly - local investors might not pay as much because of their smaller size and/or because they are looking to make renovations to improve the sale value and want to conserve as much cash as they can.
Prior Quarters Key Metrics
So looking at key metrics, gross profit had dropped from Q4 2020, but it was moving up in the latest results. I do like that it is still double digits. The number of markets they are in also increased by 44% in Q2, compared to 29% Q1, however, based on their FAQ, it looks like they are in just 5 additional markets for this quarter up (13%).
One thing that I do not like is that growth in revenue and sales slowed in Q2 compared to Q1, with growth in purchases, inventory, and inventory value also increasing substantially in Q2 compared to Q1. The growth in homes purchased was three times greater than their growth in selling these homes, so hopefully they pulled back so they aren’t keeping too much money tied up in inventory. Looking at the CEOs co-founder’s tweets that were in the Reddit DD, he was bragging about being positive on gross profit, so maybe this isn’t really an issue for them (if he can be trusted, of course).
Another thing that I noticed was that the average cost of their inventory ended up being larger than the revenue they gained per home sold in Q2, when typically the revenue per home was larger than the cost of inventory. The number of houses. Since the number of homes sold exceeded their home in inventory for the prior quarter, I don’t know that this is necessarily an issue, since this could be attributed to moving into pricier areas (which would be good for their revenue generation).
| | Period Ended | ||||
|---|---|---|---|---|---|
| (in thousands, except percentages) | Q2 2021 | Q1 2021 | Q4 2020 | Q3 2020 | Q2 2020 |
| Key Metrics | |||||
| Total Markets | 39 | 27 | 21 | 21 | 21 |
| Total Revenue | $1,185,386 | $747,274 | $248,886 | $338,613 | $739,827 |
| Homes Purchased | 8,494 | 3,594 | 2,016 | 799 | 461 |
| Homes Sold | 3,481 | 2,462 | 849 | 1,232 | 2,924 |
| Homes in Inventory | 7,971 | 2,958 | 1,827 | 661 | 1,094 |
| Inventory | $2,723,648 | $840,632 | $465,936 | $151,512 | $263,709 |
| Revenue per home sold | $340.53 | $303.52 | $293.15 | $274.85 | |
| Average Cost of Inventory | $341.69 | $284.19 | $255.03 | $229.22 | |
| Non-GAAP Financial Measures | |||||
| Adjusted Gross Profit | $159,674 | $97,038 | $38,228 | $33,073 | $51,125 |
| Selling Costs | (26,813) | (17,340) | (5,243) | (8,909) | (22,128) |
| Holding Costs | (5,299) | (3,552) | (1,528) | (4,151) | (8,900) |
| Selling Costs per House Sold | $(7.70) | $(7.04) | $(6.18) | $(7.23) | $(7.57) |
| Holding Costs per House in Inventory | $(0.66) | $(1.20) | $(0.84) | $(6.28) | $(8.14) |
| Selling Costs as percent of per House Revenue | 2.262% | 2.320% | 2.107% | 2.631% | 2.991% |
| Holding Costs as percent of Inventory Cost | 0.19% | 0.42% | 0.33% | 2.74% | 3.37% |
| Contribution Profit | $127,562 | $76,146 | $31,457 | $20,013 | $20,097 |
| Contribution Profit After Interest | $122,865 | $72,911 | $30,279 | $16,362 | $11,633 |
| Adjusted EBITDA | $25,579 | $(2,141) | $(27,075) | $(20,998) | $(21,661) |
| Adjusted Net Income (Loss) | $2,475 | $(20,801) | $(41,323) | $(36,443) | $(41,506) |
| Margins | |||||
| Total Revenue | 100.0 % | 100.0 % | 100.0 % | 100.0 % | 100.0 % |
| Adjusted Gross Profit | 13.5 % | 13.0 % | 15.4 % | 9.8 % | 6.9 % |
| Contribution Margin | 10.8 % | 10.2 % | 12.6 % | 5.9 % | 2.7 % |
| Contribution Margin After Interest | 10.4 % | 9.8 % | 12.2 % | 4.8 % | 1.6 % |
| Adjusted EBITDA | 2.2 % | (0.3)% | (10.9)% | (6.2)% | (2.9)% |
| Adjusted Net Income (Loss) | 0.2 % | (2.8)% | (16.6)% | (10.8)% | (5.6)% |
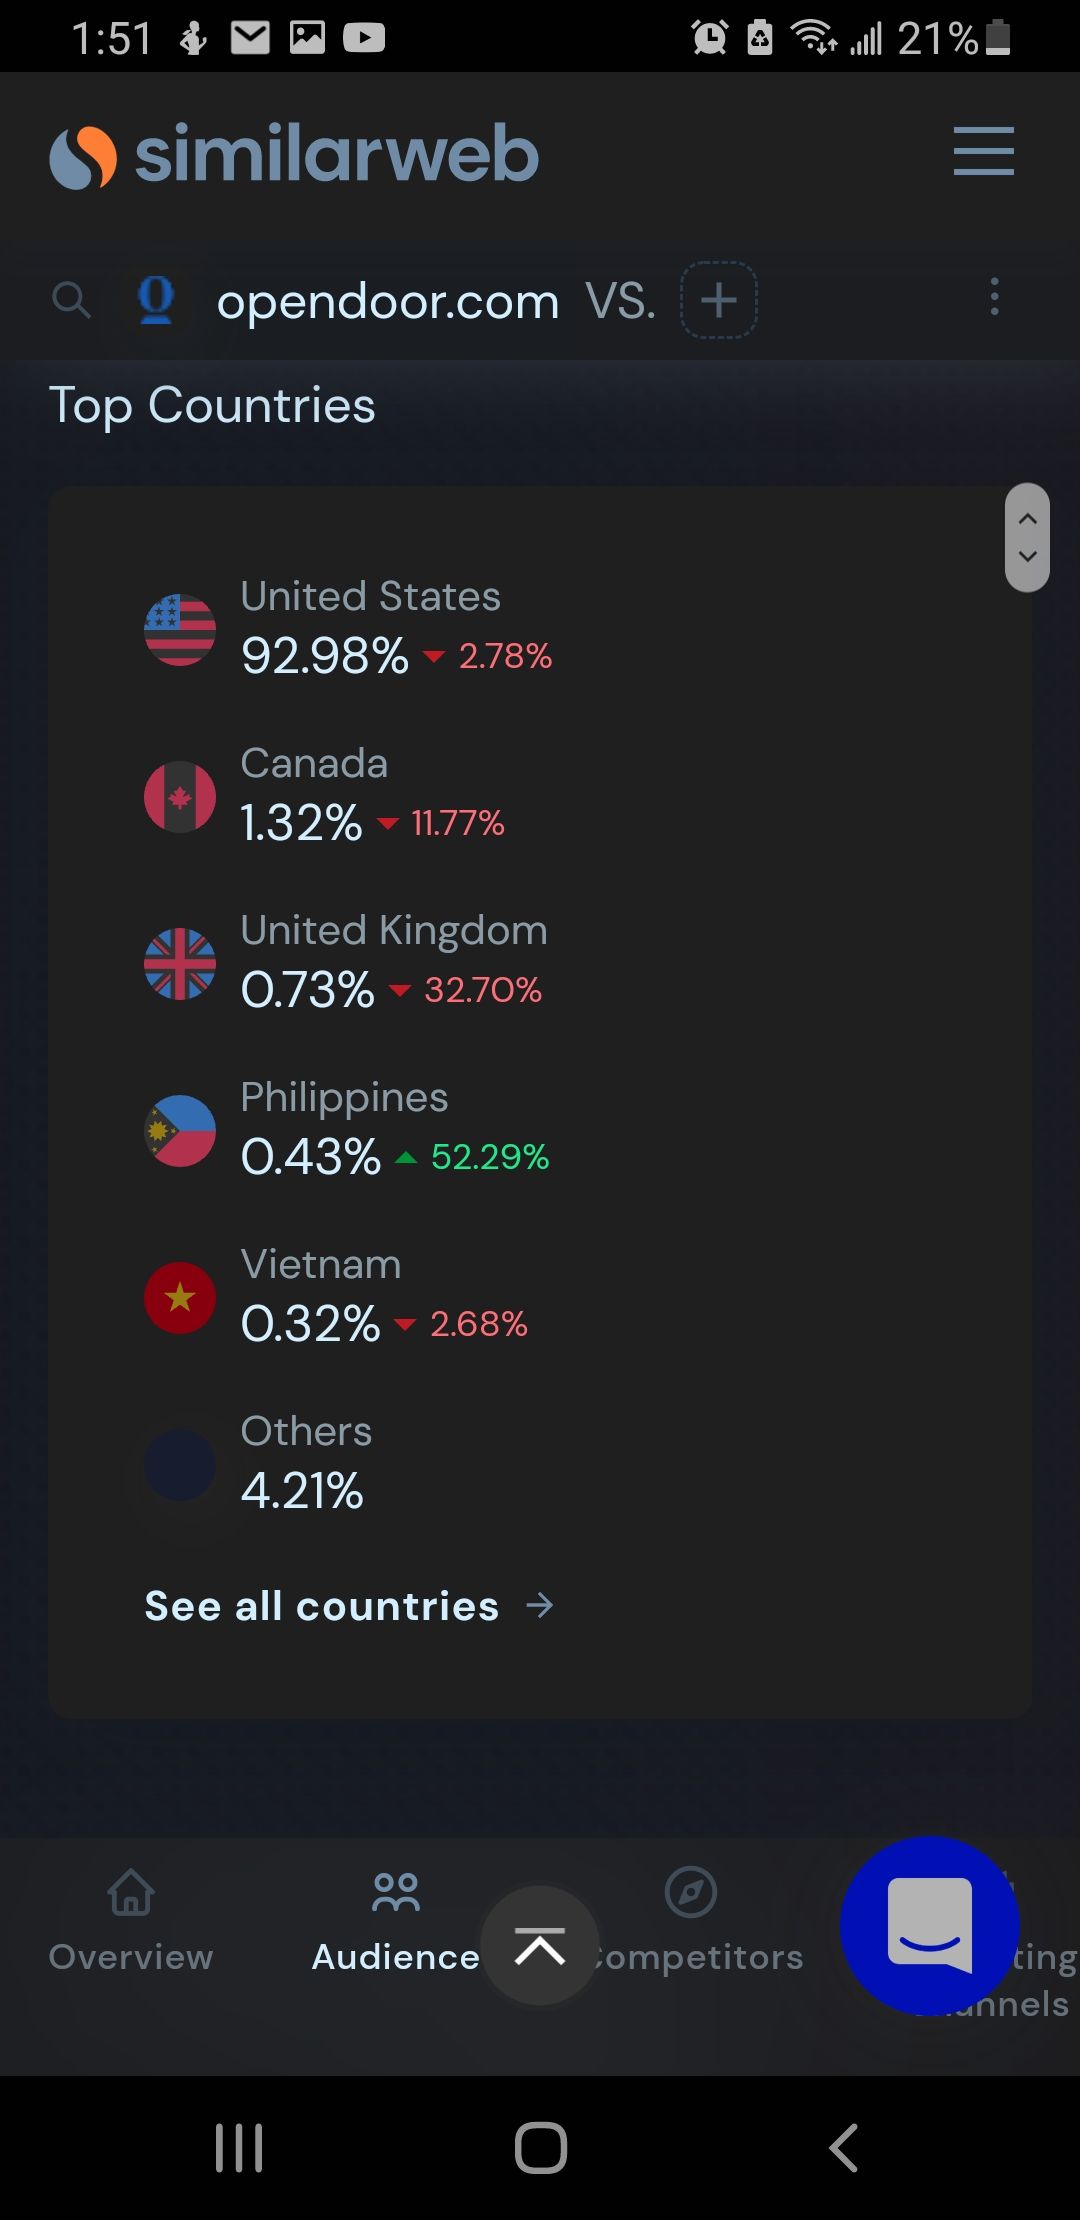
SimilarWeb Info


Interesting
Discussion on all in one (buy/sell as one transaction) on OpenDoor x.com
Why Zillow failed 🏡 5 Reasons Zillow Is Quitting The iBuying Business For Good
OpenDoor seed deck Opendoor Pitch Deck Teardown | An Amazing Example | Pitch Decks
Future work
I want to see if I can find some additional information about their website stats, and also if they have any other info lurking around that I can use to predict how they have done this past quarter.

")