Option Optimization Tools

One project that I’ve had in the back of my mind for a bit is developing tools to optimize the selection of options on potential plays. There are tools which do something like this already, mainly Options Trade Optimizer - Maximize ROI or Chance of Profit | OptionStrat. However, I don’t think it really offers enough features to make it reliable.

So here’s the goal, this thread isn’t so much about creating the tool, I can do that in Mimir easily, however, it’s about the calculations and determining the formula/conditions that we’re after to select “the right option” in a situation. Obviously there will be an element of choice, but we want to know if there are things that maybe should impact our decision.

So here’s what I’m thinking, two main features:

1. Option Optimization Tool

We have our own internal process for selecting “the right strike” and I’d basically like to turn that into an automated tool.

This tool should be capable of taking in a ticker input and outputting the optimum strikes and expirations to take. I would imagine a combination of analyzing greeks and OI/volume should be included. In addition to this, I’d like to build in warnings against taking an FD on the same week of expiration and other helpful hints to help everyone make a little better choices.

2. IV Crush/Spike Projection Tool

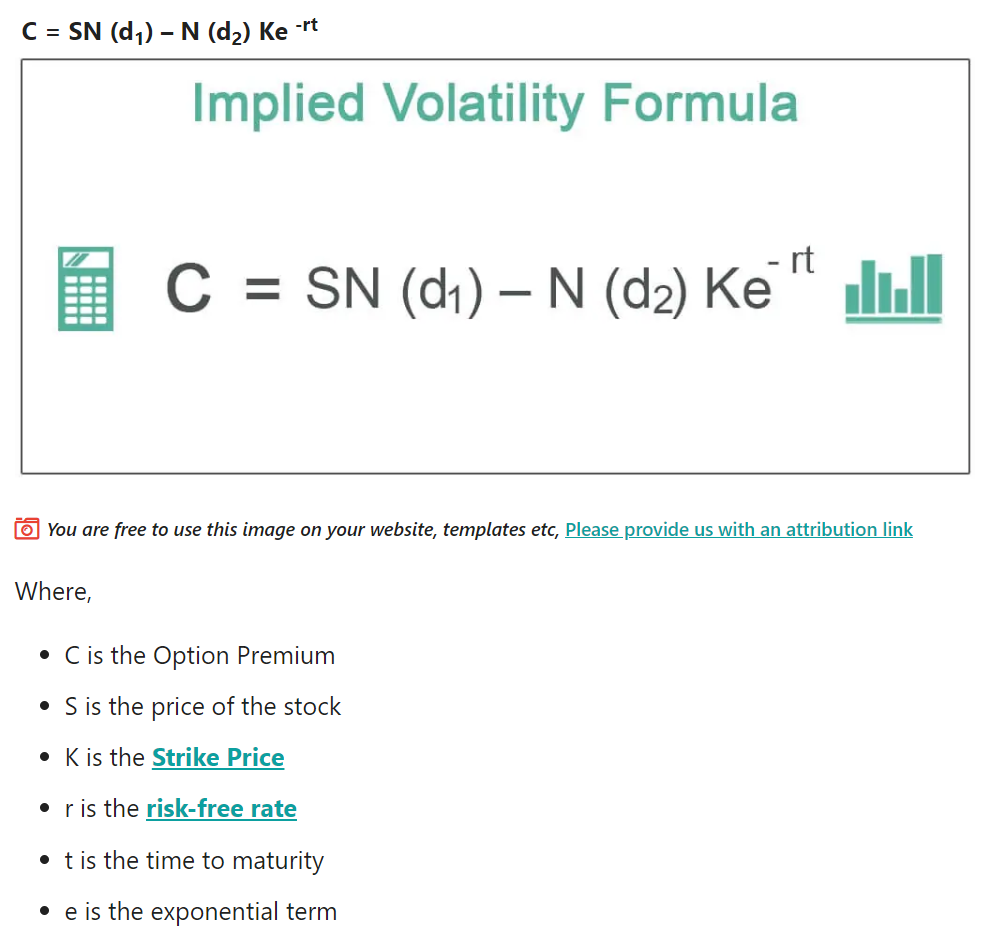
This is something that I’ve wanted for a bit. This tool should be capable of taking an option contract input and predicting IV movement to the bullish and bearish direction. There are methodologies for doing this, however, I’m not an expert in this field so I’m going to have to lean on your guys to accomplish it.

With these features combined, I think we could move towards taking some of guesswork out of options and help boost the profitability of the server by reducing “wrong choices” because we missed a certain variable.

I’m open for input on what we should be looking at and how it should be implemented.

14 Likes

I love this idea, would definitely have tremendous value. I’ll do some digging this weekend and look into data points, but also looking forward to hearing what more well versed traders think too.

1 Like

Appreciate the help. @Kryptek I’m sure will have some input on selection criteria as well.

I’ve found that many online option profit calculators are based on the Black-Scholes model (BSM).
BlackScholes Columbia UNI.pdf (863.4 KB)
A free paper from Columbia University (I apologize it being a pdf download). From my understanding, the model contains two unknowns, being call price and implied volatility. This is because the model makes an assumption that volatility is constant and known, which could be a big reason why these calculators feel unreliable at times. You can solve for iv in real time using current option prices, but idk about predicting iv direction using BSM.
There also exists other models that assume volatility to be arbitrary. Maybe we use one of those to predict a future option price, and then input it into BSM to predict future iv. That’s all I have so far, hopefully this a good enough foundation for everyone to start

1 Like

You can use Bitsection - SpreadSheet Template, and Full Write Up here - Calculate Implied Volatility with the Bisection Method (investexcel.net)

Step-by-Step Guide to Numerical Bisection

Step 1
If you want to calculate the implied volatility of an option, conceptually we want to find the root of this equation

f(v) = BlackScholesCall(S, X, T, r, d, v) – Price

i.e. the value of v for which f(v) = 0 .

Start by picking upper and lower bounds of the volatility ( volLower and volUpper ) such that f(volLower) and f(volUpper) are opposite in sign. This means that the root (i.e. the implied volatility) lies between volLower and volUpper

Step 2
Calculate a volatility that lies halfway between volUpper and volLower , i.e. volMid = (volLower + volUpper)/2

Step 3
If f(volMid) = 0 (or is less than a threshold value, called epsilonABS in the VBA), then you’ve found your implied volatility. You can stop now!

Step 4
Evaluate f(volLower) and f(volMid) . If these two are opposite in sign, i.e. if f(volLower) × f(volMid) < 0 , then the root lies between volLower and volMid .

If, however, f(volLower) × f(volMid) > 0 , then the root lies between volMid and volUpper .

Implied Volatility using the Bisection Method
Step 4
If f(volLower) × f(volMid) < 0 , then let volUpper = volMid , and go back to Step 2. But if f(volLower) × f(volMid) > 0 , then let volLower = volMid , and go back to Step 2.

Bisection is as simple as that, and the VBA code below implements this algorithm. It’s a robust method to calculate implied volatility. But when using bisection for other applications, you could need to account for several complications in the way your function behaves between the upper and lower bounds.

For example, a function may have two or more roots between the upper and lower search bounds.

Bisection of a function with two roots

Or there may be no roots between your upper and lower search bounds

Advantages and Disadvantages of the Bisection Method

The bisection method benefits from several advantages

  1. The method always converges when the function changes sign – there’s no way for the method to diverge
  2. The maximum error will always be the difference between the upper and lower bounds of the volatility. By increasing the number of iterations, you can control the error; each iteration halves the error

However, the method also suffers from several disadvantages.

  1. Convergence is slower than with other methods (e.g. Newton-Raphson iteration)
  2. The number of iterations needed to accurately calculate the root of f(x) increases if either the initial upper or lower bounds are close to the actual root.
  3. The method only works if f(x) changes sign. If the root is tangent to f(x) = 0, then the method will not converge
  4. The method only works if f(x) is real and continuous between the upper and lower bounds. Numerical bisection will not work for complex-valued functions, or if it hits a discontinuity
1 Like

I found this video pretty helpful to get the formula setup in python (he also has one for google sheets or excel) but admittedly I don’t understand IV crush well enough to reverse engineer the equation to fit what we need.

google sheet setup

Based on this tool - it might help generate some idea’s - though even with 100% probability this can and will go wrong.

Probability of a Successful Option Trade (investexcel.net)

These equations gives the probability of a successful trade for a

  • European put finishing in the money (that is, the probability that the strike price is above the market price at maturity).
  • European call finishing in the money (that is, the probability that the strike price is below the market price at maturity)

Probability of a Successful Option Trade

  • N() is the normal distribution function, and is equivalent to Excel’s NORMSDIST() function
  • S is the stock price
  • X is the strike price
  • v is the implied volatility
  • T is the time to expiry

These equations are closely related to the Delta of an option. Traders often use delta as approximation of the likelihood of an option finishing in the money.

Delta is given by this equation,

Option Delta

where r is the risk-free rate. As you can see, Pcall, Pput and Δ are closely related.

A delta of 1 indicates that the option price moves in lock-step with the stock price. A delta of 1 also means that the option will be in the money at expiration.

I’ve thought about the two objectives since it was posted but unfortunately I think the problem statement and the requirements here are still fairly vague.

  1. It is not enough to say that I’d like to buy the best contract right now, because the ‘best’ to choose depends on the strategy one chooses to pursue on the trade. For example, expecting a slow ramp up bullish earnings 2 weeks from now would warrant a very different choice than a squeeze, and very different from a merger vote. Barring a few obvious ones that can be generally excluded, e.g. low volume, low OI, super wide spread. Each scenario where you may want to enter a trade will have a different requirement for the ‘best’ in my opinion. Additionally, it also has to factor in your risk tolerance and profit expectations.

Probably a flow chart is the best to guide towards the best choice. Something like ‘Do you expect immediate price movement’ that leads to ‘Do you have high risk tolerance’, etc.

  1. As others have posted already, black scholes is how option pricing is determined, and IV is computed using the output of black scholes on the option contract. It is possible to create an IV calculator by implementing black scholes and the IV formula and allow you to see where the IV might be based on the underlying price and options price. I’ve posted the formula in TF before and it would be a straight forward implementation.

However, because options pricing is theoretical and in reality very often deviates from it. For one to get a realistic picture of predicted IV, you’d have to correctly predict the stock price and the option price (actual not theoretical). If the goal is to let people see theoretical IV movement then yes you could have a slider bar for option price and underlying price then you can see the estimated IV. I wouldn’t be surprised that this tool already exists somewhere though since the formula is already well known enough.

If the goal here is to be able to use such tool to make a decision on whether you should buy a particular contract or not, I don’t think it would be much more useful than your intuition.

3 Likes

This calculation is how TD computes the Probability ITM and Probability OTM column. My experience with these values is they work best on large cap stable stocks and fails miserably on volatile or even somewhat volatile stocks. I generally don’t put too much emphasis on these values because the trades I’m choosing to enter are the ones I’m pretty sure these calculations will fail on.

Also, these projections are at expiration, most of the folks here will never hold their calls/puts til expiration.

1 Like

Im just going to say I found out im completely out of my element with this. Chewing through these formulas does not come easy for me. Thought I could add some value but you guys are miles ahead of where I was at! Good luck on the rest of the project

2 Likes

I completely agree with this, however, we’re kinda looking to provide “our intuition” to the general membership of the server. For instance, something that automatically pulls the highest OI strikes within a certain range and suggests taking one week out if you’re too close to opex. Basically putting “rules” that we already implement into an automated environment to take out some of the guesswork.

2 Likes

Awesome, much appreciated.