First, thank you all for everything you do here. I have learned a lot and I am continually amazed by the knowledge and free time given to this place.
My goal is to be able to build up a 3-4k account minimum before August of next year before I start medical school and be decent enough at trading options off of TA to be able to make a small/fun income off of that and also a way to decompress from school. Anyway I believe by being here and focusing on learning I can achieve a much higher starting account before school.
I want to be able to play options that are good set-ups for 2-3 weeks out based on TA. Now I still do not know how to pick one so I just randomly picked NWL to post here in hopes of some feedback from you all. I am completely new to this and welcome any advice.
I can not get the image to upload but I pulled this from Finviz if someone can take a lot at it on there. NWL - Newell Brands Inc. Stock Price and Quote ( I can not get the image to upload)
So this bounced off of support trend line at the beginning of December and climbed to the resistance trend line as well as the 20/50ma and instantly started the down trend. Based on the cart it is looking like it is going to go down to 21 or below over the next week or so.
When you zoom out to the weekly on Finviz it shows there was support around $21-$22 back in December of 2020.
When you zoom out to the monthly on Finviz it shows there was resistance at 20-21 way back in 2012? ( This may be way to far back to account for anything but maybe its going to drop down to all time lows?
Given this trend in my eyes it looks like it is going to drop after it gets below 21 a significant amount.
I also looked at the options chain for last week and the OI on the $20 put is 2068.
Thank you to anyone who comments / offers advice or direction. I hope it makes sense what I tried to type up.
This shouldn’t come as a surprise but different people prescribe to different TA methodologies. While I do enjoy dabbling in Elliot Wave Theory, I have found that my most successful TA follows Occam’s Razor - The simplest answer is usually correct. I’ll walk you through how I use explicitly horizontal lines to help demystify some TA.
Straight Lines are my Friend Method
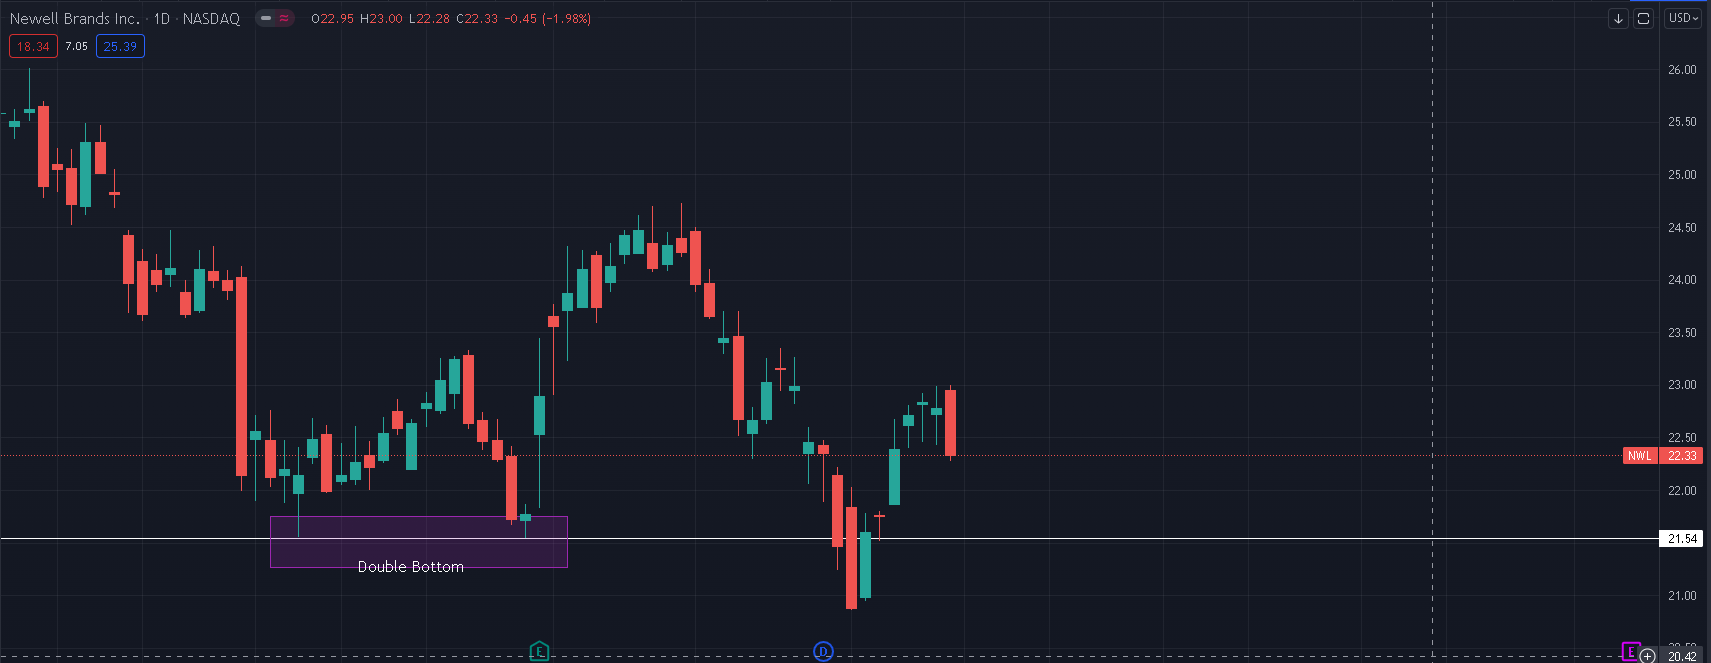
When I’m looking at macro trends via the daily chart, I see a double bottom on October 6th and October 28th. This was our support line that it expectedly bounced off and I would declare this the strongest display of support in the past few months
There’s the saying that old resistance becomes new support, so we can actually add a few lines to start tracing other support and resistance areas within the recent vicinity. You can get way more in-depth than this, but here’s what I see:
Based I would say that it is has broken through support established on December 8th and is now heading towards the resistance established on December 1st. It may hit the $21 PT you’ve referenced, but it has to first crash through the PT of $22 to do that. It may be safer to look at that line than it is to jump back to the strong support we built in October.
This is hardly the only way to do it, but this is one approach you could take towards establishing support and resistance yourself. This is my “one-tool” approach and certainly will leave you with you some gaps.
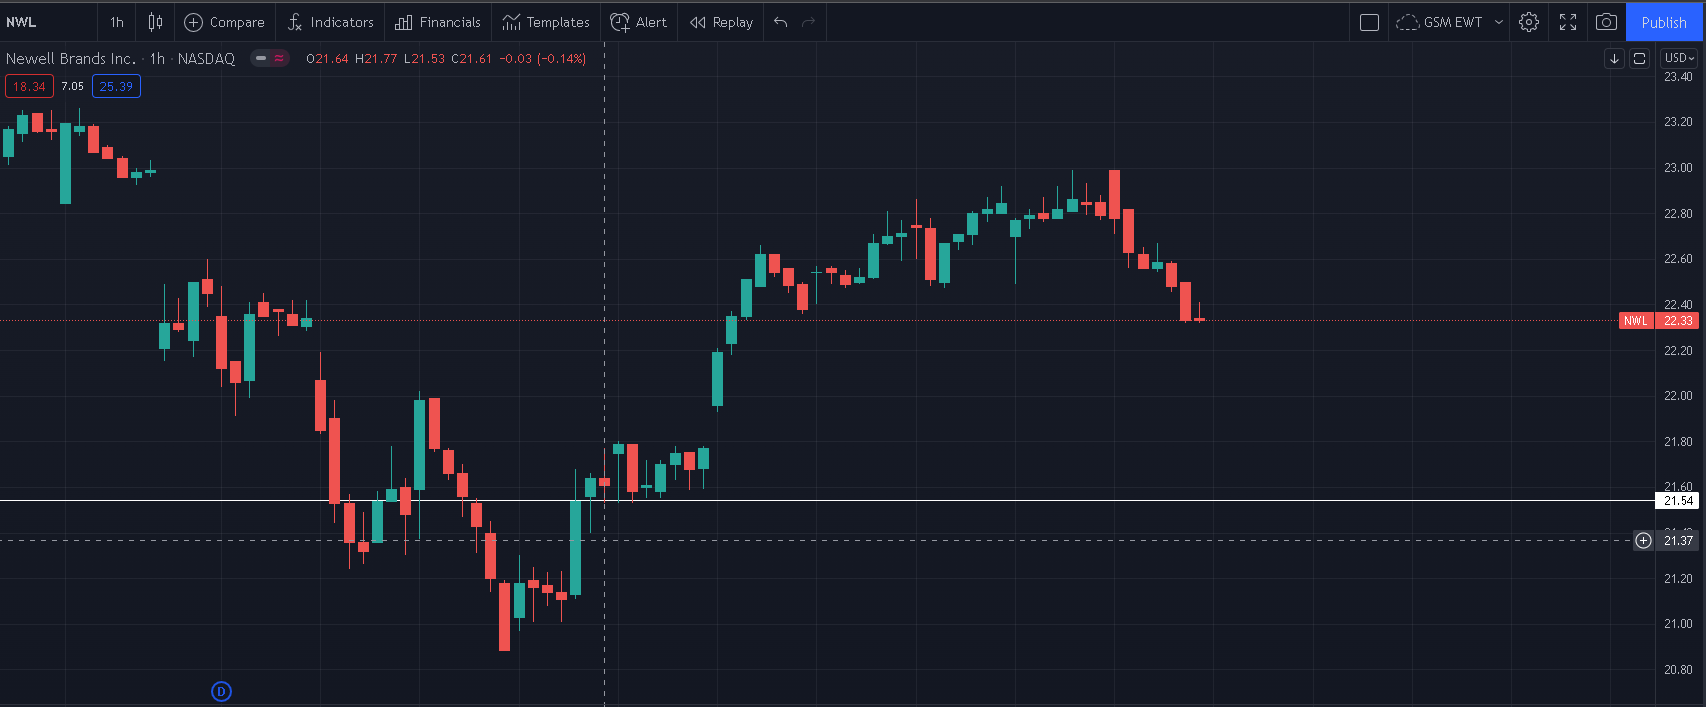
(Edited because I actually had a better picture I never pasted in)
Thank you! I see all of that you referenced and it makes sense. This is how I would like to start by simple lines and then build of that. For now I can play the plays listed here but I want to eventually play my own plays that fit my schedule and I will not have to watching as much to make a profit.
Macro analysis is your friend! 2H, 4H, D, and W charts are something I watch often because I don’t always have the time to babysit my positions. Always be mindful that good or bad news can come in and wreck your TA though, the two coexist and should be considered equally.
I don’t but my play style is high risk, high reward which wouldn’t really jive with what you’re going for here. I would recommend starting with 5-10 stocks that:
You understand the industry well enough to not be blindsided by facts you don’t fully understand
You’ve done some research into their charts and feel decently comfortable with the patterns it presents
You have the time to monitor for certain news catalysts that may cause you to revisit your support/resistance levels
Options are inherently risky, so along with this make sure your position sizes reflect your risk tolerance. If losing 10% of your portfolio would cause you significant stress and/or financial despair, you need to factor that in before taking any position.
As long as you remember there’s no such thing as a “sure thing”, you should be okay.