All,
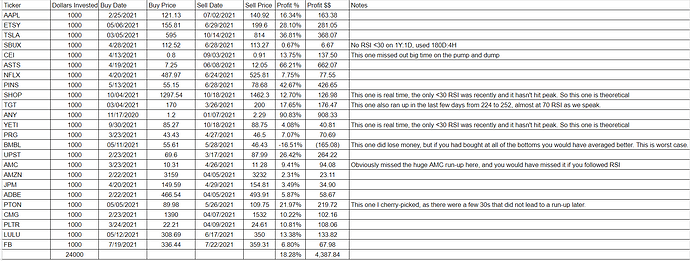
Bottom line up front: Why don’t people trade solely based on RSI on popular tickers? The data I ran shows that over the medium term (not year to year trading but not day trading), these have something like 95% success rate if you’re patient and buy/sell using RSI 30/70% indicators. (I chose not to post this in DD because I didn’t think it really met the muster, and I’m not suggesting a trade on any of these tickers right now.)
I’ve done some preliminary research on technical analysis, and the indicator that caught my eye is RSI. I’m specifically interested in trading shares, not options as I can’t even trade them on the platform I use (Fidelity - I got approved for Level 1 only), and I’m too risk adverse right now to do options.
So I did a basic review of RSI in thinkorswim on these tickers:
AAPL
ETSY
TSLA
SBUX
CEI
ASTS
NFLX
PINS
SHOP
TGT
ANY
YETI
PRG
BMBL
UPST
AMC
AMZN
JPM
ADBE
PTON
CMG
PLTR
LULU
FB
What I found is that if you look at the 1Y:1D or 180D:4H candles (1Y:1D seems more reliable) for these tickers and you bought them at <30 RSI and sold at >70 RSI, you would make money in all cases (except BMBL, but even here it was only in a couple instances). These break down when you look at shorter duration candles, which makes me think these wouldn’t be day-trade types of trades, but rather buy and hold for maybe a couple months in some cases or days/weeks in others.
To vet this out, I played out 1 trade on each ticker over this time period and put $1000 into the stock at <30 RSI, then sold that stock at > 70 RSI. What I found was that just doing one trade in each of these would have netted you 18% return (vs. ~15% in the S&P since about February when most of these trades took place after). So that’s not super impressive, but keep in mind for most of these stocks there were multiple opportunities over the last year to do this. Meaning you can double your return by doing this twice a year per stock. Further, this seems pretty low risk at least for the stocks I reviewed.
So my question is, why don’t people just buy based on RSI? From the brief research I did, RSI is a reliable indicator, but obviously things like volume, sentiment, earnings releases, etc. play a factor as well. But from what I found, even if you held it through high RSI, it often went even higher later and rarely did it ever end up being a loss when you bought at the 30 RSI level. Am I missing something? Does this only work because the bull market has been raging?
