Retarded double EMA9 & 21 crossover pattern?

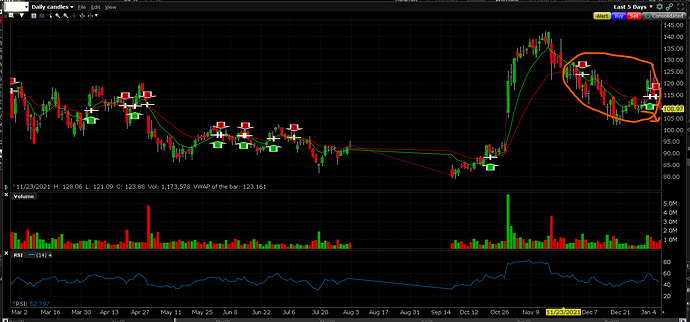
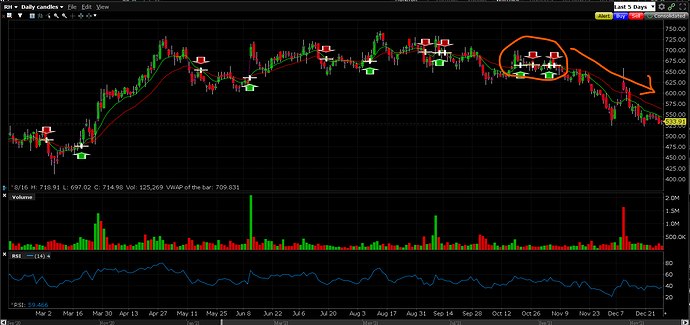
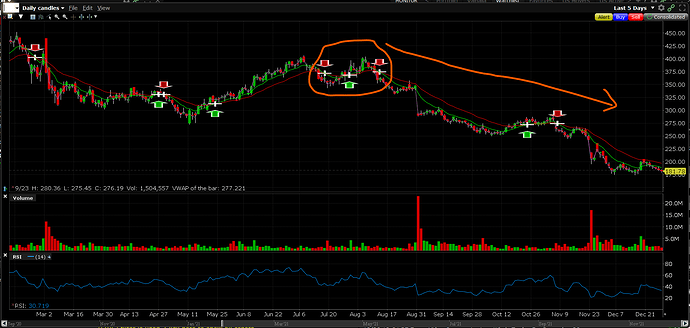
So I’ve been playing around with my charts and going over some of the tickers called out in the server and came across a pattern that keeps leading to a long-term (2 months+) decline in price. It’s when the EMA21 crosses over EMA9 twice within a 1-6 week period. I understand there are “Golden Crosses” and other such technical indicators but I’d welcome some feedback from our technical wizards if they have some time to tell me why this is stupid and a waste of time (seriously, please don’t spare my feelings)

Here’s RH on the daily:

Here’s ZM on the daily:

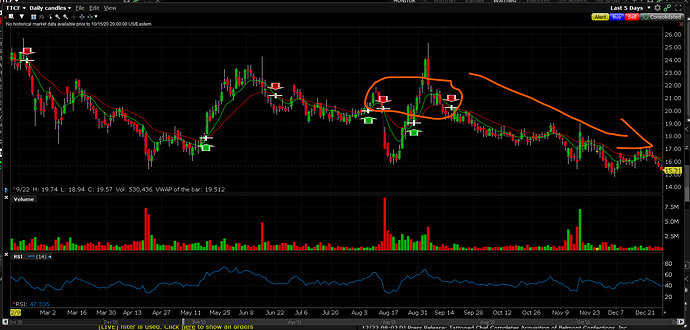
Here’s TTCF on the daily:

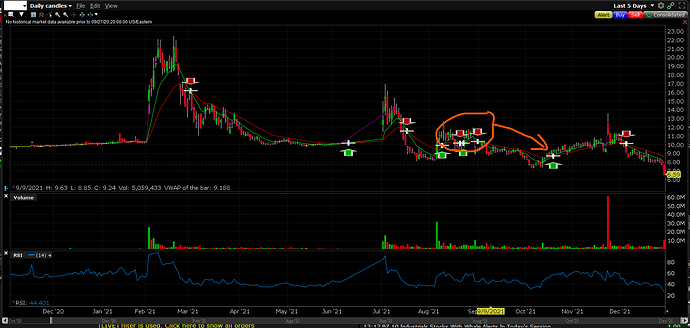
Here’s ASTR on the daily:

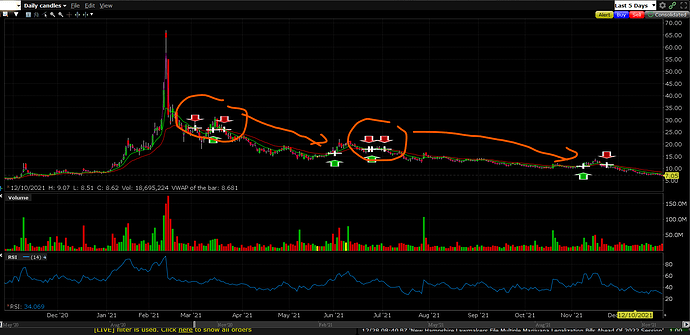
Here’s TLRY doing it twice on the daily:

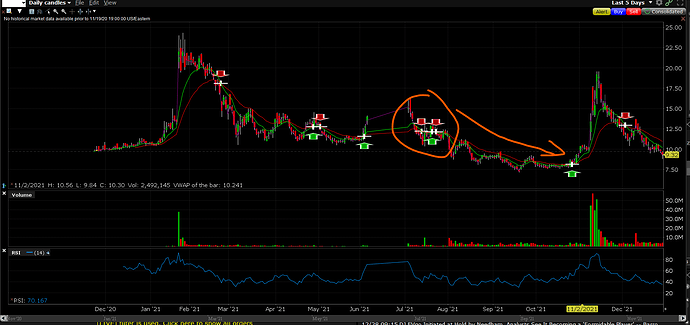
Here’s EVGO on the daily:

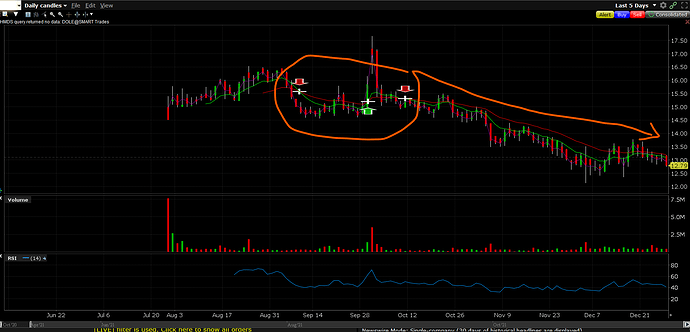
Here’s DOLE on the daily:

What’s my point? Well the double crossovers happened at least a couple of weeks, sometimes months, prior to when I took a look at these stocks. And in the even that the downward trend continues into an event such as ER, it helps to re-enforce a put play.

I’m wondering if I do come across this pattern, I would start a small position with a put that is 15-20% OTM with at least 60DTE. Should the trend continue down, and no crossover occurs, I would continue to build on the position. Also, if there is an earnings play where I was confident that post-earnings it would be a put, I would like to see if this pattern fit into the continuation of the downward trend and then increase a post-earnings play. I would really like to flesh these ideas out more with more experienced traders as I don’t think we’re in for mighty bull markets in the coming months and there will be more pressure on companies to outperform market expectations leading to downward pressure on underwhelming stocks.

Also, are there any suggestions to set up a scanner to capture a crossover? I’m having trouble editing my existing in IBKR. Finviz just allows for percentage changes?
5 Likes

Really like this, will go backtesting tonight but am by no means a technical anything.

1 Like

Thanks, I really appreciate it!

At first, I just wanted to dismiss it as showing a lagging double-top like in ZM it’s pretty damn obvious with the two peaks and break in support around 350 range. but just messing around with other tickers, some had price spikes in-between the crossovers and some where just sort of flat.

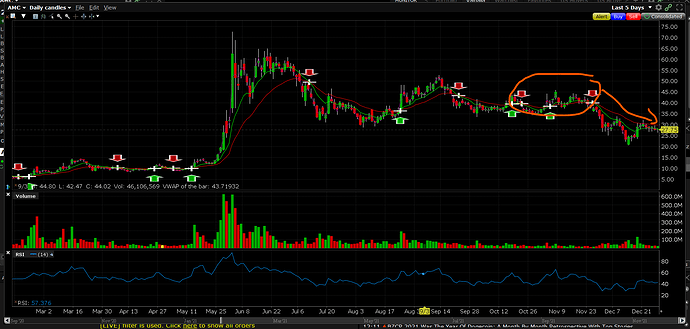
Even AMC fits this pattern:

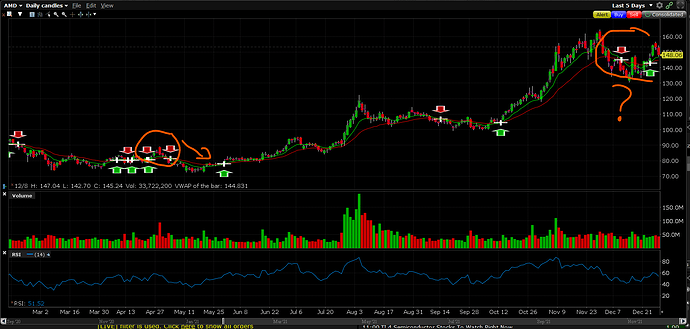
Sorry for the constant edits. Trying to squeeze this in. But AMD did a mini drop fitting this pattern and it looks to be forming it right now. If there is another crossover within the next couple of weeks, AMD might be a ticker I’d like to try this strategy on:

1 Like

Interesting, thanks for posting.

I like that there is evidence of this occurring over a fairly wide timescale, i.e. they’re not all at the same time of year and the action is caused by some macroeconomic event we’re not thinking about.

I’d like to look into this further to find the false positive rate, but really interested that you posted this - thanks!

1 Like

Thank you! I’m really grateful for whatever insight you can provide. Cross-referencing macro data, even SPY correlation, would definitely test how robust this pattern can be. Definitely more capable than I am if false positive rates can be further studied.

Since I’m not an experienced trader, I’m trying to analyze the charts by asking myself, “What’s the narrative (most over-used word) here?”. Because in the end of the day, these candles are just buyers and sellers acting on a company, that’s compartmentalized into a sector, thrust into a market, overlaid onto economic and political events in the world we live in.

And what I’ve found with this is that since the crossovers occurs within 6 weeks of each other I’d like to call this volatile consolidation. It’s not puttering along like AGC during market hours. These are swings, some transpiring during OPEX dates, whereby buyers and sellers are generally conflicted on the value of these companies. This would be a complete nothingburger if not for the tight time period within which it happens. Afterwards, if the result is the EMA9 crosses above the EMA21 in a downward trend, it’s a bearish indication that this during this volatile consolidation the result was that this stock no good.

Now no good isn’t necessarily trash. It’s just the buyers couldn’t defend their thesis, the sector might be put under stress, and catalysts shake people’s convictions. And it’s enough that the buyers are defeated by the sentiment of the sellers for at least another 8 weeks and results in the downward trend.

However, to make the trade more robust, after the second crossover, I would look for a couple of red candle days, maybe even up to a week, to confirm the play. Also, I would look for the RSI to trade above the 30 range, in order to not approach oversold territory, so that the puts can continue a slow crawl downward. Moreover, I would try and avoid this pattern if it occurred during a yearly high in volume as to roughly weed out significant catalysts.

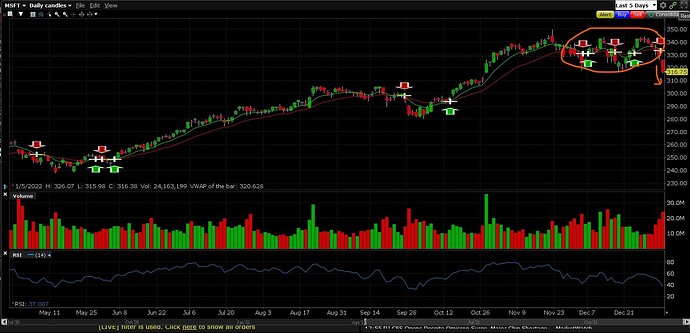
Today, SPY tanked on FOMC fears and rise in 10-Yr Treasury yields. Bad all around but particularly not so good for the tech sector. MSFT is starting to fit this pattern. Here it is on the daily:

The crossover actually happened yesterday. Closing yesterday at $329.01, a conservative 15% drop in price would put it at $279.66. So something like 02/18 280p would fit the strategy. This is without any analyses of the greeks. Notice that this actually the 3rd crossover within a span of 5 weeks - something to take a note of.

Also, AMD has also begun this pattern but I’m going to post a reply to ILoveYou’s thread cause it’s boss and just for continuity sakes.

I’m not in this play and don’t plan to. If the pattern holds this trade will only get more expensive within the next couple of days. I don’t recommend trading this. It’s just a random observation from some dude on the internet that has not been tested thoroughly at all. Also, MSFT has earnings on Jan. 25 with bullish sentiment on https://www.earningswhispers.com/stocks/msft so that is a headwind to this play. Looking forward to seeing how this pans out!

1 Like

So SPY continues to trade sideways or go down as JB has noted. Tech continues to suffer given the recent FOMC minutes. 10-Yr Treasury Yields continue to climb. CPI numbers are released on Wednesday before open and I think a lot of traders are waiting in anticipation for the release and then speculating the Fed’s response. Anything higher than the 6.8% last month would put added pressure on the Fed to raise rates sooner or at least confirm that they should. The cost of living has risen as everyone knows. Food costs, car prices, gas prices, shipping, mortgage rates. With that backdrop let’s take a look at some charts that are starting to fit the mold of this retarded pattern lol:

Here’s WOLF on the daily:

From the second crossover close of $113.05, a 20% reduction in price is around $90. Notice that the second crossover is markedly lower than the first and on a general downward trend when the second crossover occurred. WOLF is a US semiconductor company with big ties to GM and it’s future EV plans. But SPY, 10-YR Yields, and interest rates, can all drag this down until earnings later this month. Moreover, WOLF is in that sweet spot where the volume is average, or below average, and the RSI is hovering over 40 on the dailies. I like this company but the pattern is the pattern.

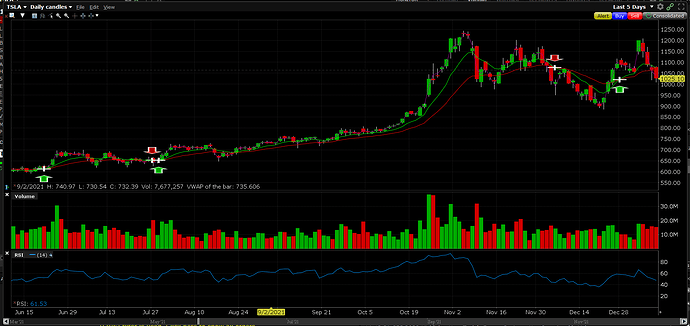
Here’s one that looks to be forming: TSLA!

TSLA crossed over on 12/03 so has about a week and a half to have the second crossover occur. TSLA’s recent deliveries blew past expectations but has since started bleeding out. Also, more vocal traders have started to disclose their shorting of the stock https://www.bloomberg.com/news/articles/2022-01-05/short-seller-who-bet-against-wirecard-wagers-tesla-is-overpriced

Moreover, TSLA has a significant amount of BTC and without knowing if they have sold their positions, can be assumed to have seen a large decrease in value as BTC is trading at around 41K. TSLA reports earnings on Jan. 26 after market close. This doesn’t given a lot of time for this pattern to play out if the second crossover occurs next week but it’s been a mixed bag in terms of TSLA’s share price after ER. I’m expecting TSLA to beat estimates but further out puts would allow this pattern to develop. Obviously you need a lot of cash to play these so it’s extremely risky if you don’t have tens of thousands in your account. But I’m putting it here because TSLA is such a widely traded ticker.

Hope everyone has a great weekend and let’s hope East Stone goes to the moon!

1 Like

Just to recap some of the tickers that began to exhibit this pattern during this thread are WOLF, MSFT, AMD, and now TSLA. Even SPY, although an ETF, has double-crossed over the EMAs.

Earnings are coming out for these tickers within the next two weeks and it will be interesting to see if a strong ER can overcome the negative weight of the markets right now as the 10-Yr climbs, FOMC meetings are held, and rates will begin to hike.

As a counter, Hoss has said (to my understanding although sometimes it goes over my head) that the rate increase anticipation could be an overreaction. And his insight is invaluable. Rates will be hiked gradually - softening the blow. There is still a shit ton of liquidity in the market. By the time rate hikes actually effect the balance sheet of Big Tech, these companies are money printers, and any increase in borrowing/financing costs could be negligible.

I would defer to this opinion but could still fit within the pattern as any rate hikes won’t be until March (supposedly, the Fed can change their mind and do it earlier) and the “overreaction” of the market could continue for a bit.

Anyway, this was an interesting exercise and if anyone would like to add in that would be great. But for the sake of clutter @Tedro is it possible to archive this thread as I don’t know how much there is to add other than observations?

2 Likes

This is now in the archives. Thanks for the contribution, supermacrodick!