Scalping - How to Determine the Safest Entries & Exits

There was a good discussion on TF Tuesday around when to enter puts/calls on SPY. @Sejit mentioned that he bought a put when SPY fell through support. Only for SPY to reverse and trigger his stop loss. This is not the time to buy, it’s a time to sell.

Once SPY breaks through support, you want to wait for it to come back to that point, and see if support has now become resistance. The opposite applies to taking calls. Don’t buy them when SPY breaks through resistance, wait for the price to come back down, and test the resistance line for support.

Another to thing to think about is the trend on the day. SPY was in a downtrend on Tuesday and there was not much positive news coming out. Buying puts on green candles (near resistance) would have given you the best entry. Don’t take a full position so you can average down if needed. Tuesday, for example, $421 and $422.30 become resistance throughout the day. If you were to take a put at $421, be ready to average down at $422 with another. Plan to cut at either the $420 or $419 support lines. With so much volatility in the market, taking small positions to preserve capital and compounding small gains is key. Way too easy to get blown out.

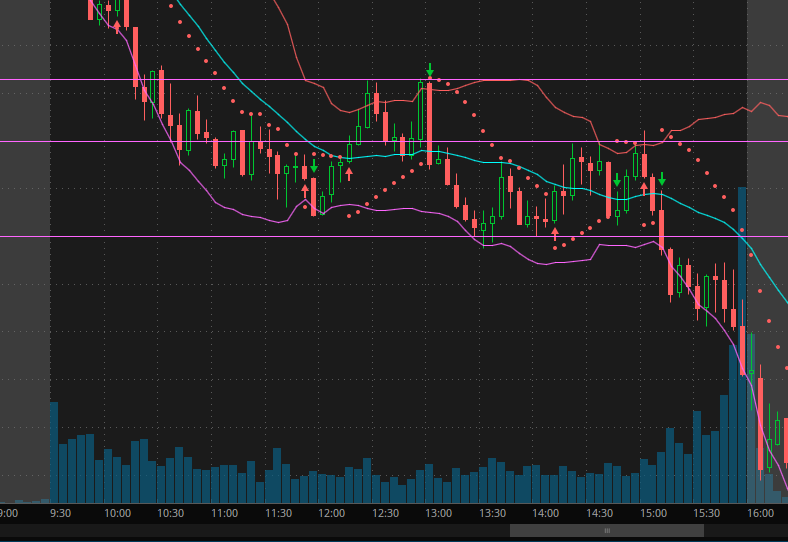
Lastly, when thinking about your stop losses and/or cutting if the trade moves against you, many use a fixed 5, 10, or 15%. This is a perfectly valid strategy, but another would be to set your stops just above a know support/resistance line. In the above example, you could set your stops at $423 (or $422.50 / $422.75 depending on your risk tolerance), to allow for a rejection of the resistance break.

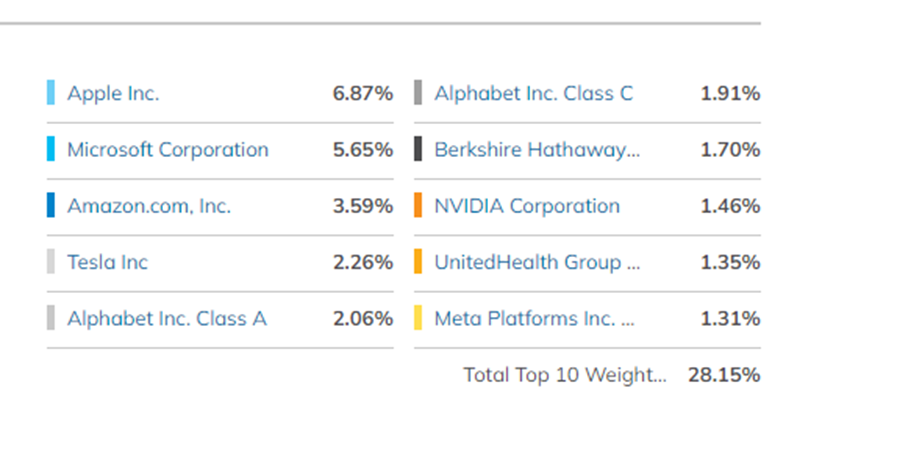
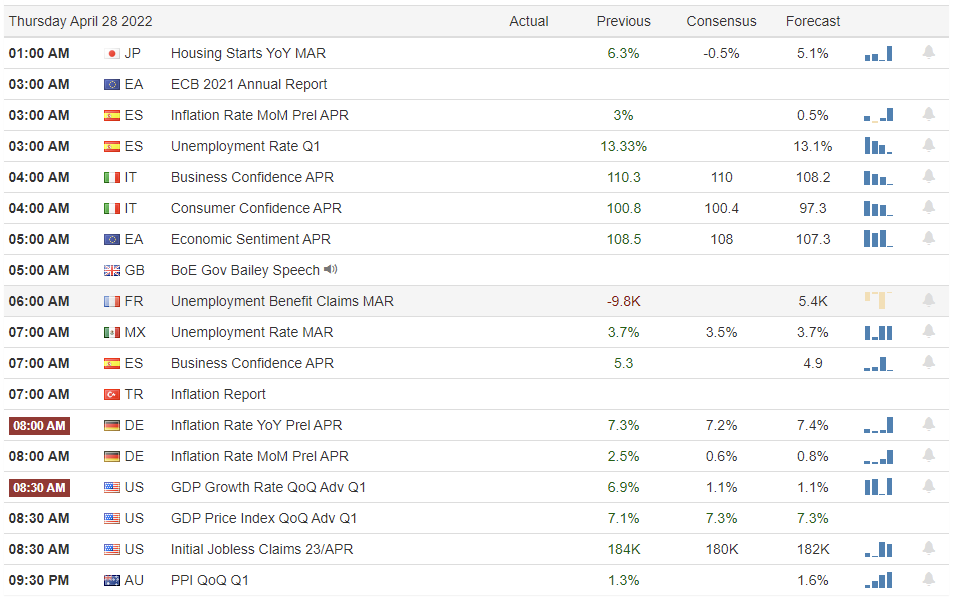
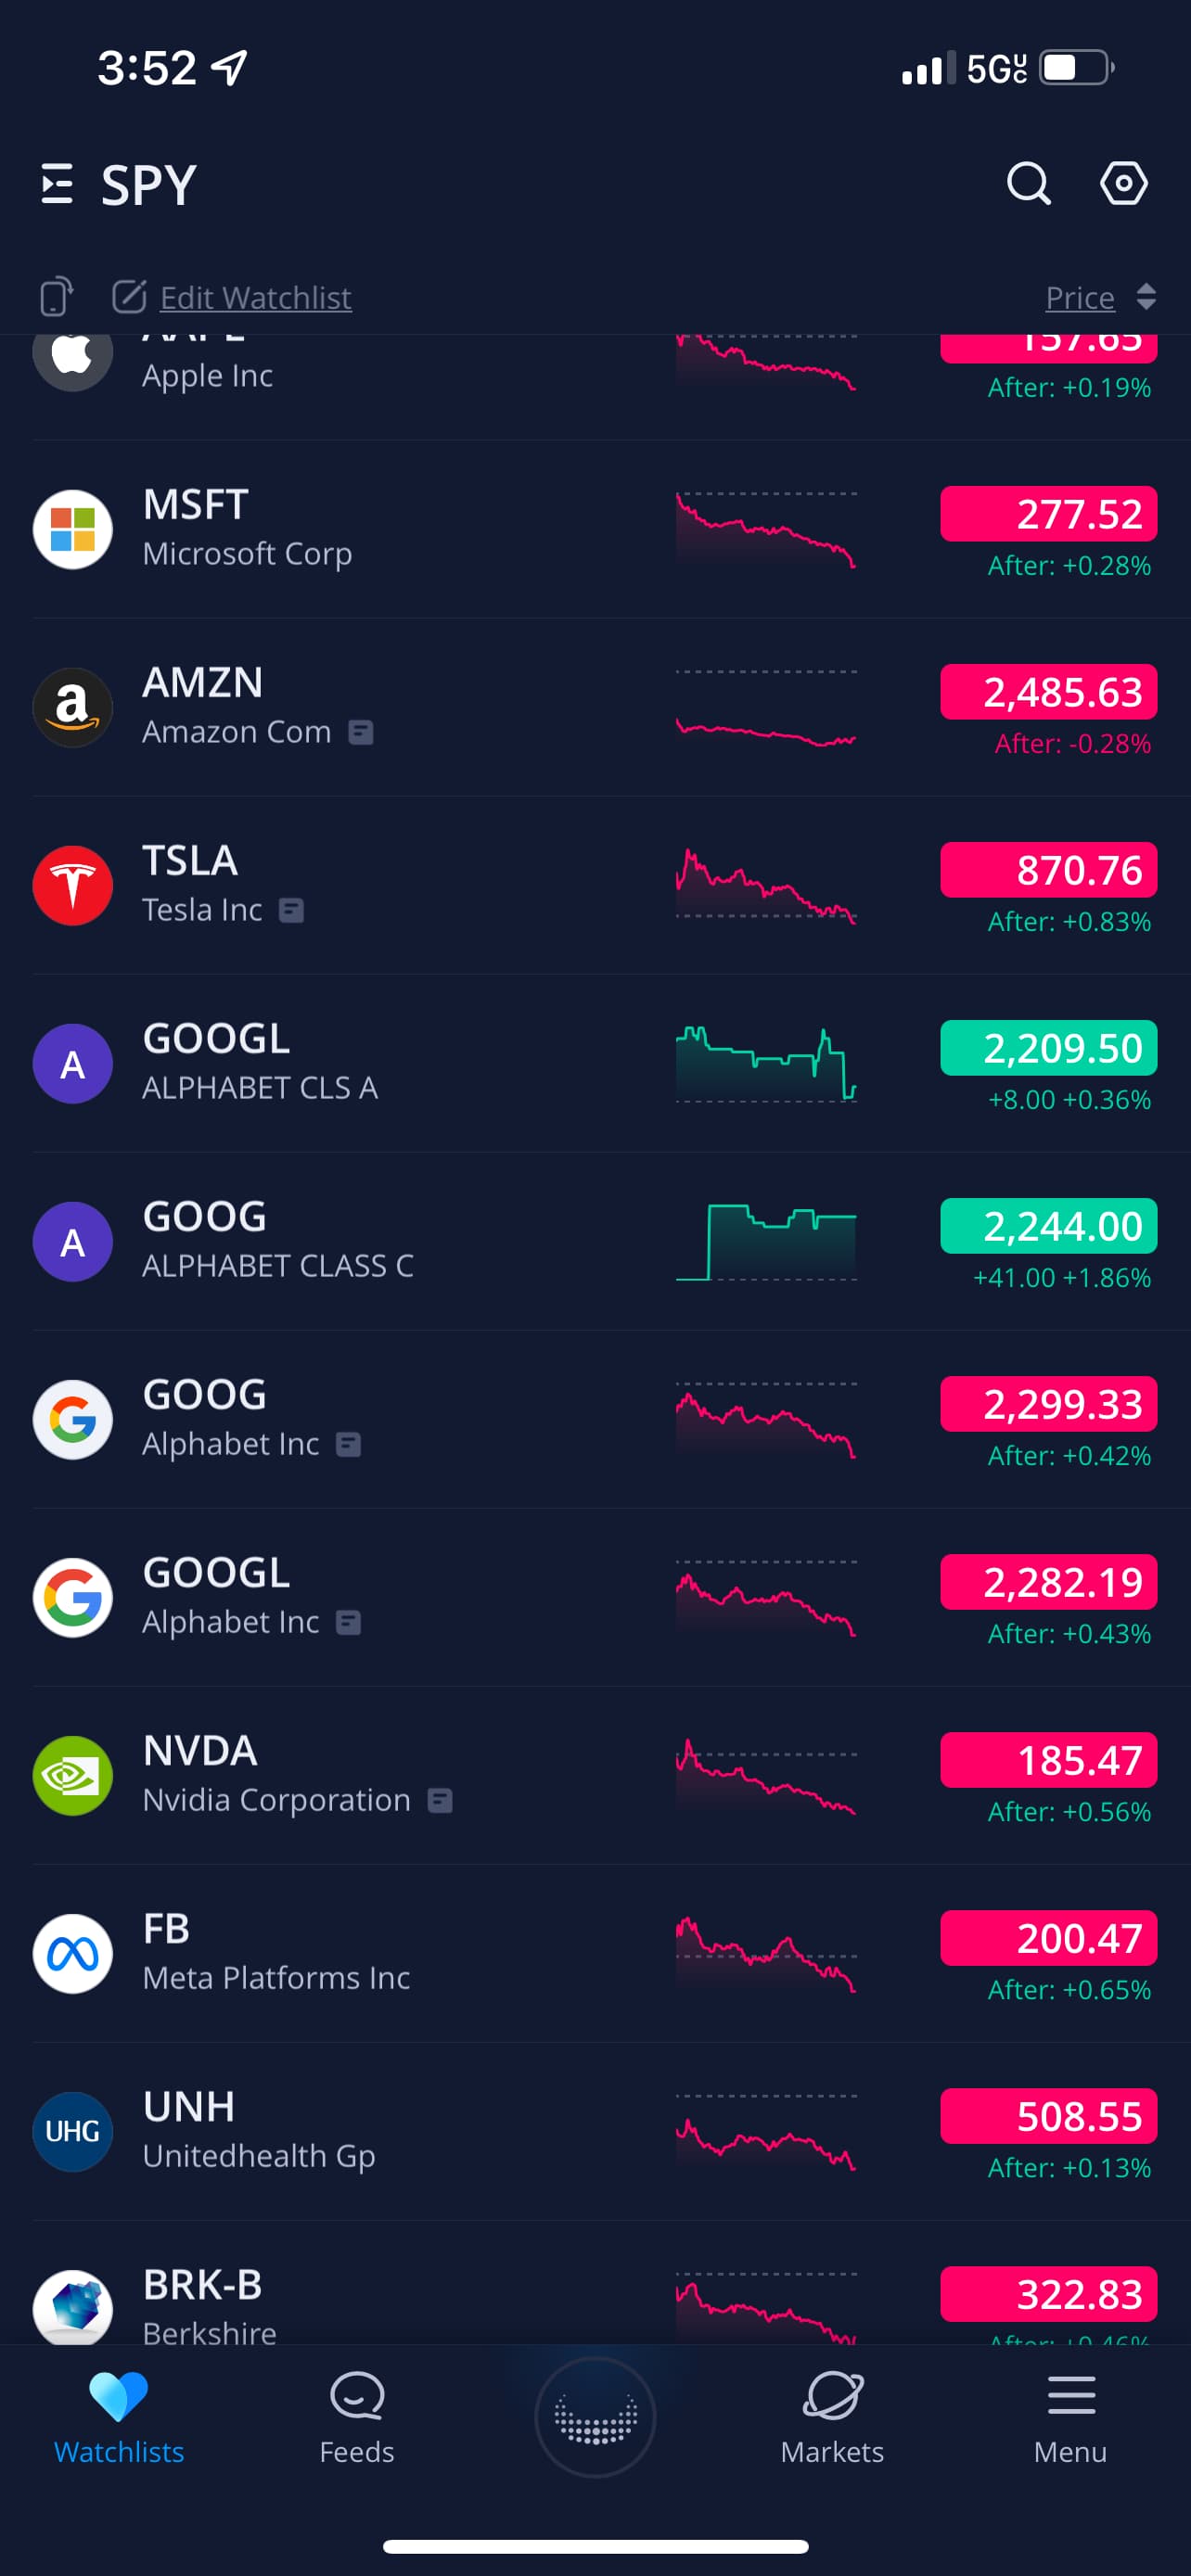
Related to this, keep an eye on the top holdings of SPY to get an idea for how it might move. These are AAPL, MSFT, AMZN, TSLA, and GOOG (they each make up more than 2% of SPY). Others to watch are BRK, NVDA, UNH, and FB. While they will typically trend similar to SPY, if you see a news pop (or drop) intraday, that can help in your scalping. Additionally, keep the market calendar in mind when thinking about sentiment / overall trend for the day. Finally, looking at how SPY traded overnight and during pre-market can help identify a direction in many instances.

19 Likes

Good shit Nano.

All add a retarded thing that I do, as it may help some who are also developmentally disabled like I am.

I like to swap between candles and a line chart. I can more easily see strong rejections at resistance or bounces off support using a line chart as it’s cleaner for me to see. Just me personally. If you’ve never tried it, see if it can help you catch bounces easier than following candles. It also makes seeing the “bigger picture” of trends or patterns easier for me. But again, I’m fucking retarded so there’s that.

2 Likes

I often have my charts in the same order as SPY holdings when scalping SPY too, in addition to the items listed above. Put more weight on how AAPL/ MSFT then AMZN and GOOG. Always watch the twitter feed as often each candle that jumps drastically is because some news on a tweet etc.

4 Likes

Thanks for this advice. Couldnt have come at a better time for me :kissing:

1 Like

Thank you for this. When scalping SPY are there any indicators that are better suited than others? I listened in on VC as some were discussing using Stochastic RSI instead of RSI (or in addition to). I added it to my trading view and saw that many time Stochastic RSI was leading and would hit 0 or 100 then RSI would catch up. Often times when they caught up to each other on the up or down side those points seemed like good exits/entries. Curious to hear what indicators (other than twitter, support/resistance) you all have found useful in scalping SPY (or QQQ). Speaking of QQQ, is there any reason people prefer scalping SPY versus QQQ?

1 Like

Just for clarities sake. On webull, would these be the correct tickers to follow to watch SPY? I was uncertain on Google so I added 4 of them.


I’m trying to learn from my mistakes and I think I’ve gathered where I fell short on my entries. Monday will be the test if I’ve figured it out or not.

2 Likes

The third one, “GOOG” is their class A ticker.

3 Likes

RSI is a lagging indicator and I’ve seen SPY run for an hour or two with RSI very high or very low. I’ve been primarily using JB’s support/resistance levels (called out in PM), plus any new levels throughout the day. Also, I began using Bookmap (visualized L2) and watching /ES futures to identify levels.

Lastly, as mentioned in the first post, I keep an eye on AAPL/MSFT (primarily) and where they are in relation to support/resistance.