This is no full fledged analysis of Sofi and their long term prospects. I am not a financial advisor and this is not financial advice.
Currently Sofi is testing, and breaking through at lower time frames, a long-term Symmetrical Triangle. It is entirely possible that this could be a false breakout. I am including a Daily Heikin Ashi (average bar) chart, showing the triangle pattern, previous tests, as well as some other various levels drawn in. I use the Heikin Ashi for smoothing when viewing these kinds of pattern trend trades.
I have followed this ticker for the last year and through the Spac process. I believe it is at a point where it has processed through most of it’s de-spac volatility and share dilution, at least until more long-term stakeholders for ex: execs, institutional investors, sponsors, etc are able to freely trade shares. Again these dates and time frame is not information I have to include today, but can be reviewed with an SEC Edgar search for their merger agreement from earlier this year. Also Sofi is currently attempting to formally close a deal and win SEC approval for a bank charter which could cause a run, but that may also already be priced in at this time.
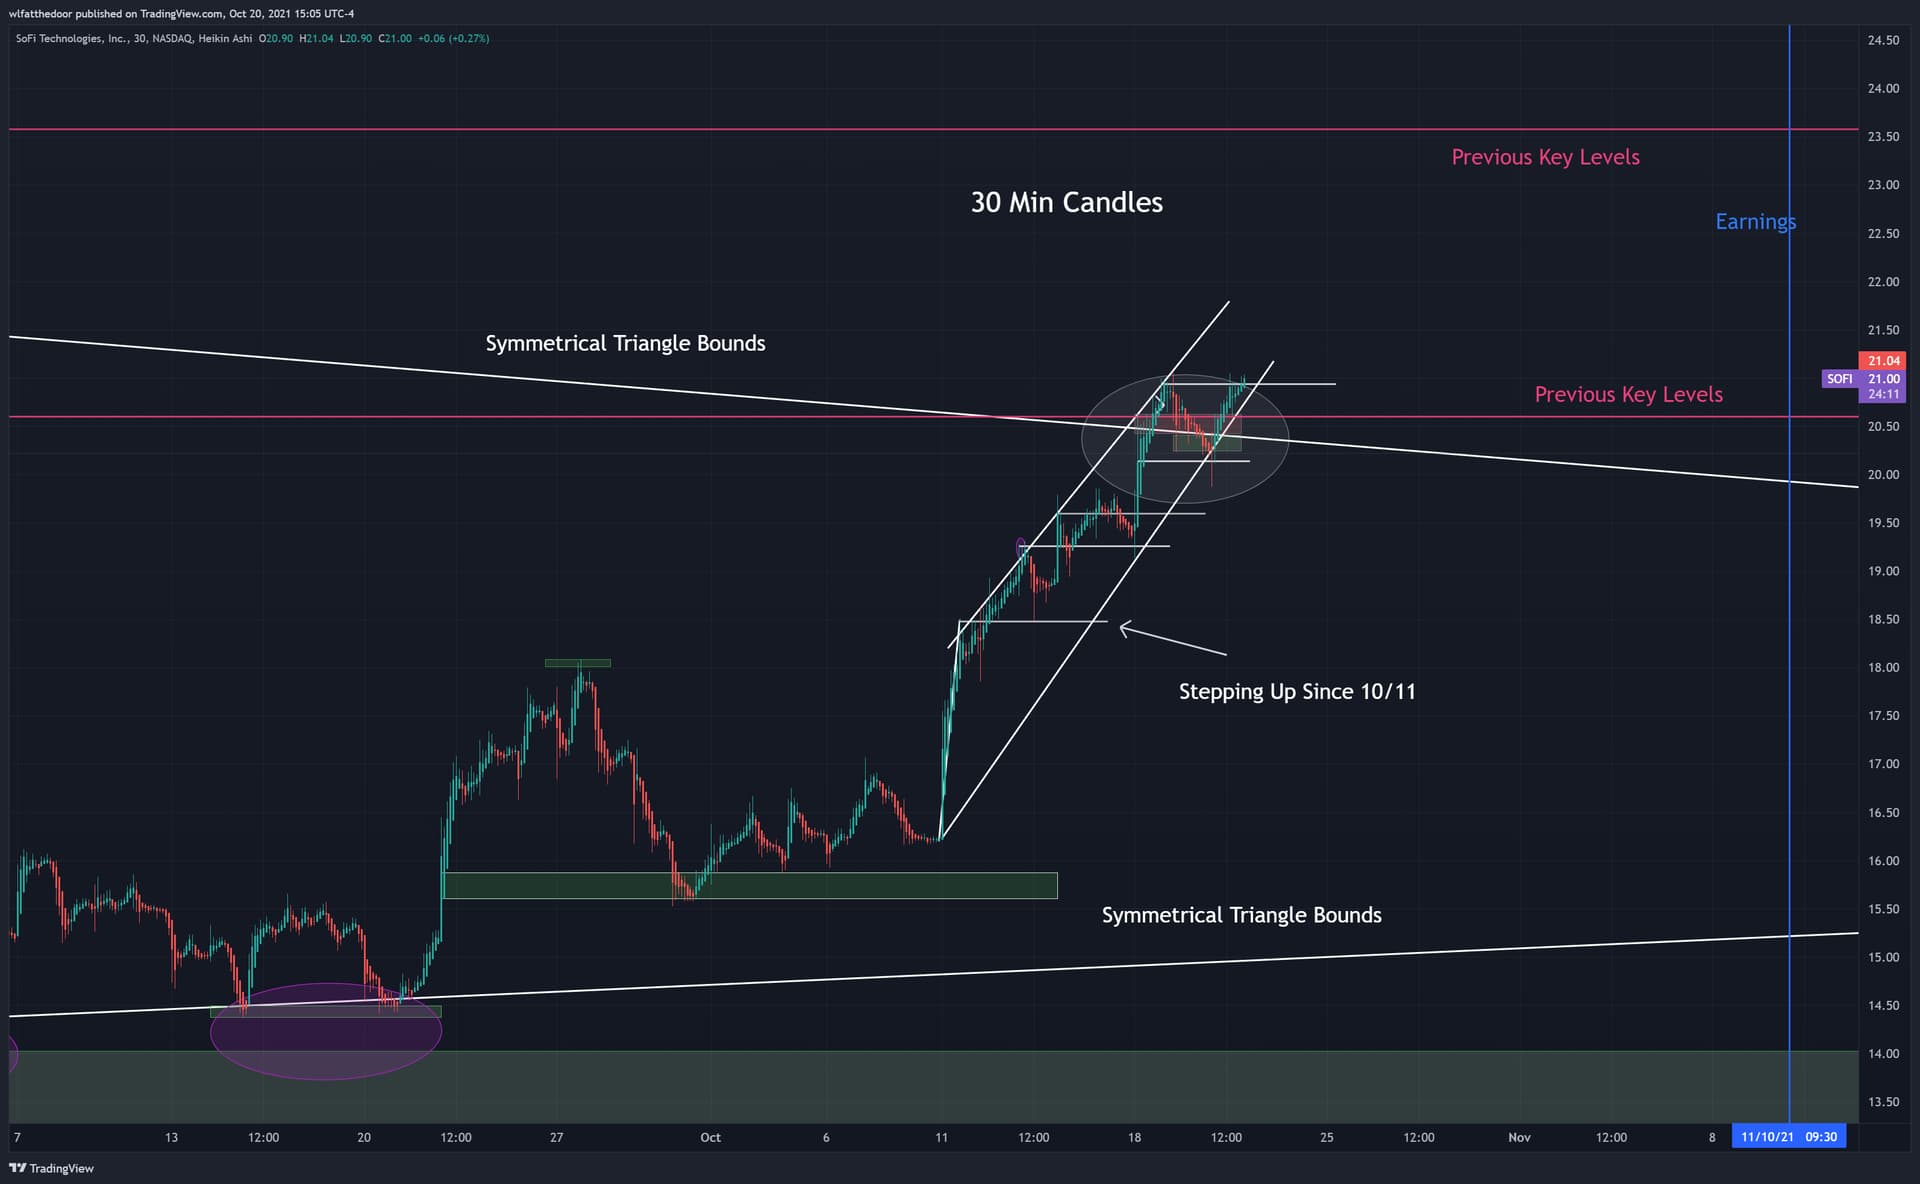
Recently Sofi has been stepping up every few days to higher highs as it is approaching the triangle bounds, and it is also approaching previous key levels from May. As it tests this triangle pattern at these previous critical levels, it is possible with a solid break into the $21 range and above, that one could see additional significant movement upward as they also have an earnings call on 11/10. I am including a 30 minute Heiken Ashi chart to view the recent step-ups. The highlighted oval area shows the cross of the triangle bounds at or near the critical levels.
A counter argument, their most recent earnings were a significant miss, and it is possible it can test this pattern and fail and fall quickly back into the $14 range. This seems like pretty reliable support even after the last earnings miss. It is also possible that as this tests this crucial level, it has already hit it’s top, reaching a double top either today or tomorrow and will return into the triangle.
After the original post in AM trading on 10/21, Sofi broke up above the neckline it created when it first broke out of of the triangle and went up briefly from right around 21 to 21.77 (a 3mo high) - but has since fallen back down and is bouncing for the time being on top of the upper bounds of the symmetrical triangle.
We are now also well below a loose channel that the stock had been following over the recent steps up to this recent high.
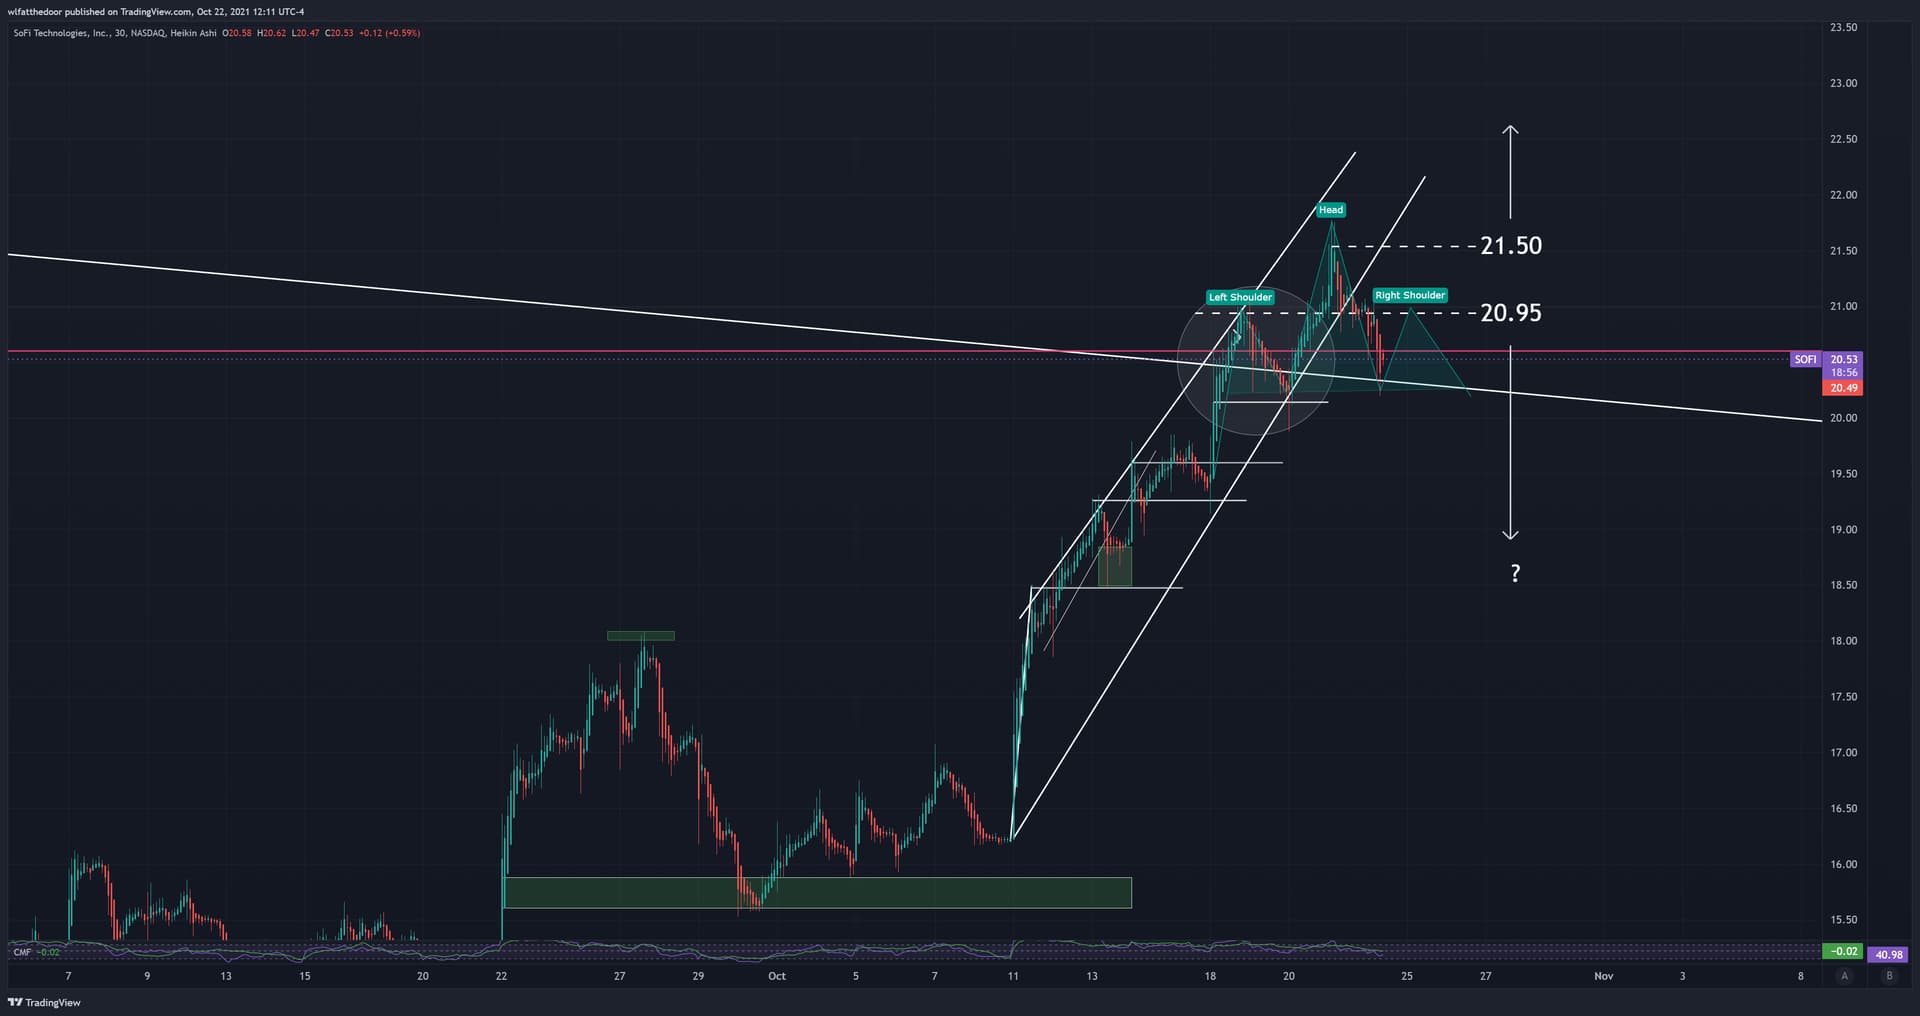
Reviewing the 30 min avg bar chart today, I personally see a pretty clear head and shoulders forming, resting on the top of the triangle bounds.
At this point I expect this to retrace back up to the 21 range, and then from there I think we will have a better idea of what might happen in the next few weeks leading into earnings.
If this retraces and touches the $21 mark and is rejected down, I would expect the head and shoulders to confirm, and at this point I would personally advise anyone to review their position. I think from here it would likely break back into the triangle and below $20, possibly well below.
If it breaks the head and shoulders neckline and continues up, next I would look for it to break and close above 21.50 for a continuation upward into new higher highs.
Last update for me on this one. Wont be online much for the next week plus.
As projected above, SOFI touched the $21 range again and rejected down. It closed the head and shoulders today. It is currently again below $20 as expected in my last post. There was some support yesterday around $20.6 or so, but just not enough volume to drive the price any higher.
At this time I am out of this one completely. I wouldn’t be surprised with any good news or volume, if this does see new highs in the next few weeks, but for now I believe this one still might come down some more unfortunately.
Came across this dude on YouTube that does TA on just price movement. He sees a pattern of peaks for 15 days before a big breakdown. Just wondering about your thoughts on this as I’m considered buying some puts if it closes below $20.50 today?
i got in a few days ago and so far this trade has been quite good. my 12/17 17.50p are up 134%. trimmed down a bit and now looking for a dip to $16 to cash out entirely
Could this be the bottom for SOFI? Bank charter is expected soon and student loan repayments begin on Feb. 1. Although many will probably defer their payments some may have refinance. The hiatus on refinancing student loans by the Biden administration decimated SOFI’s business in that area. It should see a large uptick in late Jan or early Feb once repayments begin. Consider LEAPs here for Feb.
said this on TF but one of the catalysts i’m looking at is the continued pause on student loan payments. there is a push within the democratic party to have Biden continue the pause. this will be bearish imo for SOFI as they have already said in their recent earnings that the pause negatively effected their student loan refinancing