I was looking into the trends of SPACs as a whole and came across this chart.
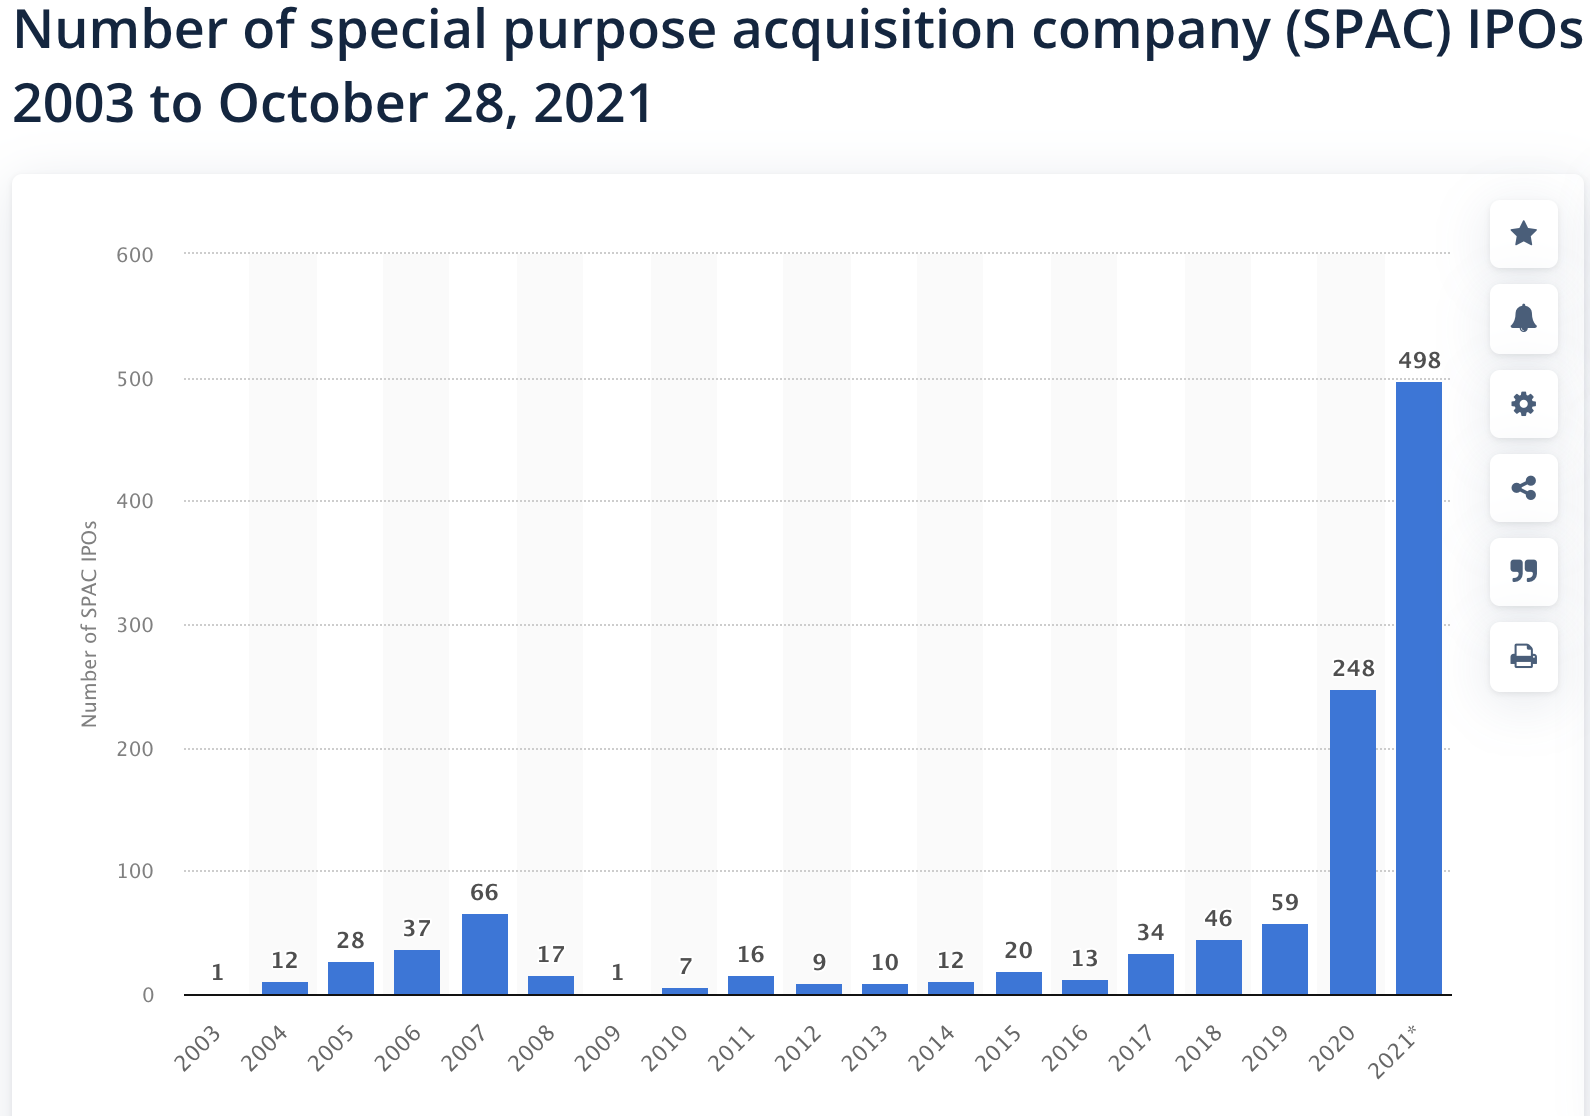
It’s pretty fascinating - it shows you that 746 of ~1120, or 2/3rds of all SPACs IPOs were in the last two years.
My hypothesis was that SPAC deals are directly correlated to QE and low rates, but 2008 to 2016 had low rates but few SPAC deals. After 2008 there was a lot of QE but hardly any SPACs.
Regardless I think 2021 will go down as an outlier year. If we had 40% less SPACs next year than in 2021, it would still be the second highest number of SPACs ever.
Some food for thought for 2022 since this class of companies are some of the best to trade. Tapering will continue through June and interest rates will increase in 3 rate hikes, probably up to 0.75% (still very low). So macroeconomically the conditions are good to have them for a while. I think around the same as last year, or 250 SPAC IPOs, is a reasonable prediction to make for 2022.
Chart is from statista Number of SPAC IPOs in the U.S. 2023 | Statista
