I was thinking about cross trends and wanted to put some sort of visual together. Im sure there is a way of doing this that is 1000% times easier, but for me to learn, sometimes I just have to mess around with things until they make sense.
I wanted to see how big trends transition and if there is any technical analysis that could help visualize this. Its pretty cool seeing the market as wild and volatile as it is fall into patterns without forcing them to do so. At the very least its a decent visual of the current trend we are in, but I think if I expanded the grid it could be a useful tool setting up resistance and support levels.
The disclaimer is I have pretty minimal TA skills. So if this is kindergarten level stuff, just keep that in mind. I also did this on my phone, so some of the lines aren’t perfect, but im going to make them perfect later on a computer. I also want to look back historically and see how it looks.
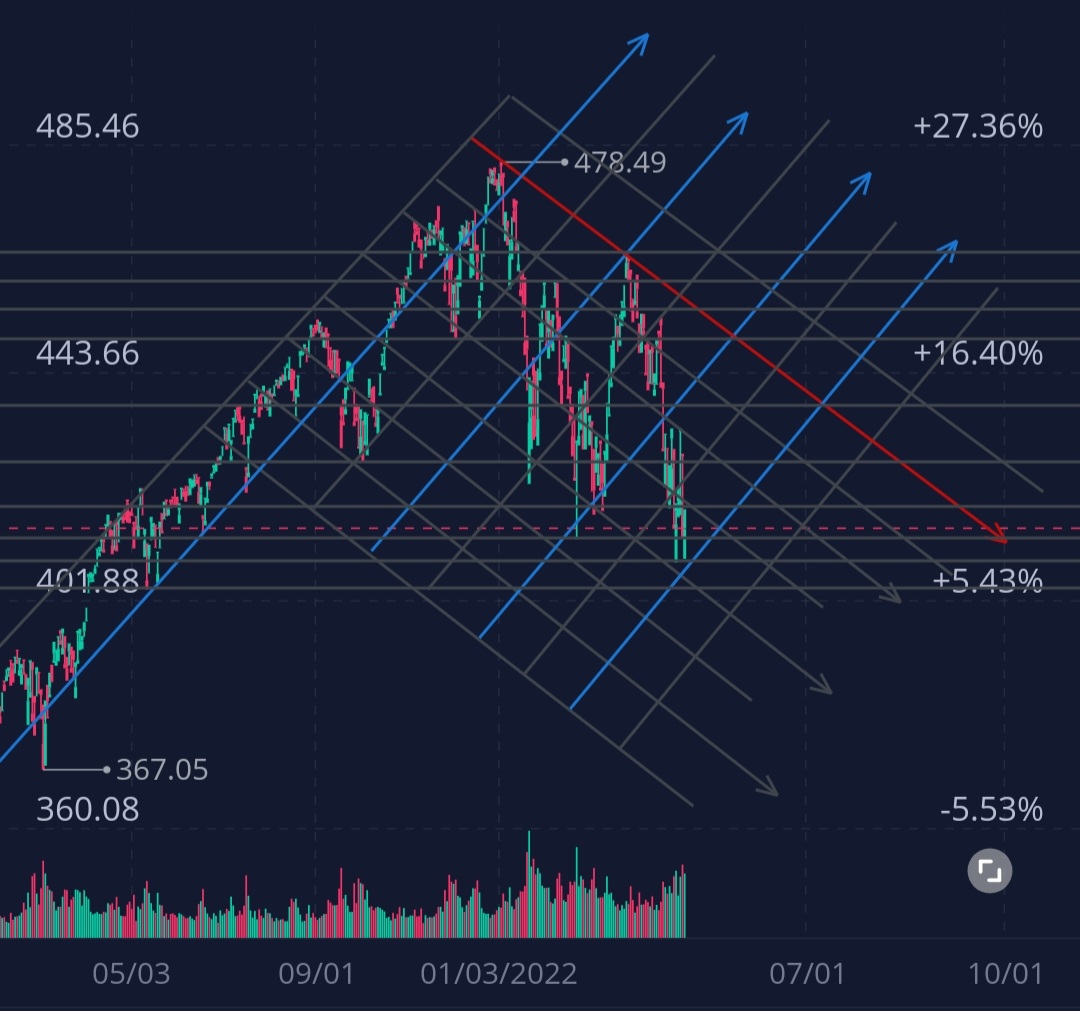
I started with a daily chart and wanted to identifying the 2 main trends. The first is the blue line, long standing bullish support, while the red line is our new bear market resistance trend.
I then set up deviations from trend and made a grid.

So it looks like 2 and 4 deviations from the main trend are the important ones. Below you will see the bullish and bearish trends highlighted at 2 deviations.

And this is what we look like at 4 deviations on both.
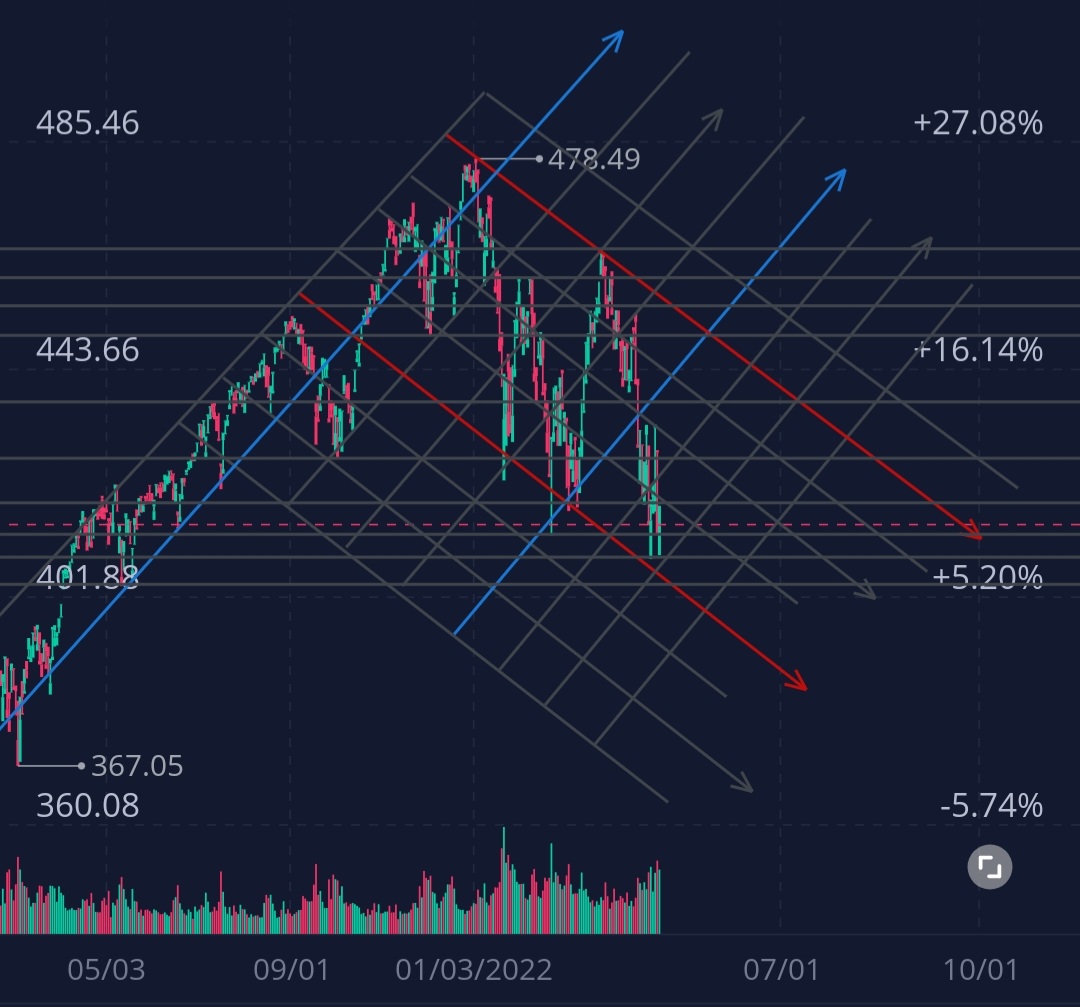
You can see after testing once before we broke through the 4 deviation bull trend on 4/21 while the bear trend falls into alignment.

And finally a closer look at the grid to see how the candles are falling within the pattern.

Anyway, Im having fun with this grid and thinking about cross trends. I’m going to expand the grid and see if there are any signals that we could draw from it, Im looking forward to hearing any thoughts or ideas.
Hope everyone is having a great weekend.
(Update)
After playing around and looking at how spy has moved through these 2 and 4 deviations, here are some potential outcomes if the movement was similar. I even threw in a bullish one. Interested to see how things like CPI and FOMC move things around.

A - 446 resistance 400 support
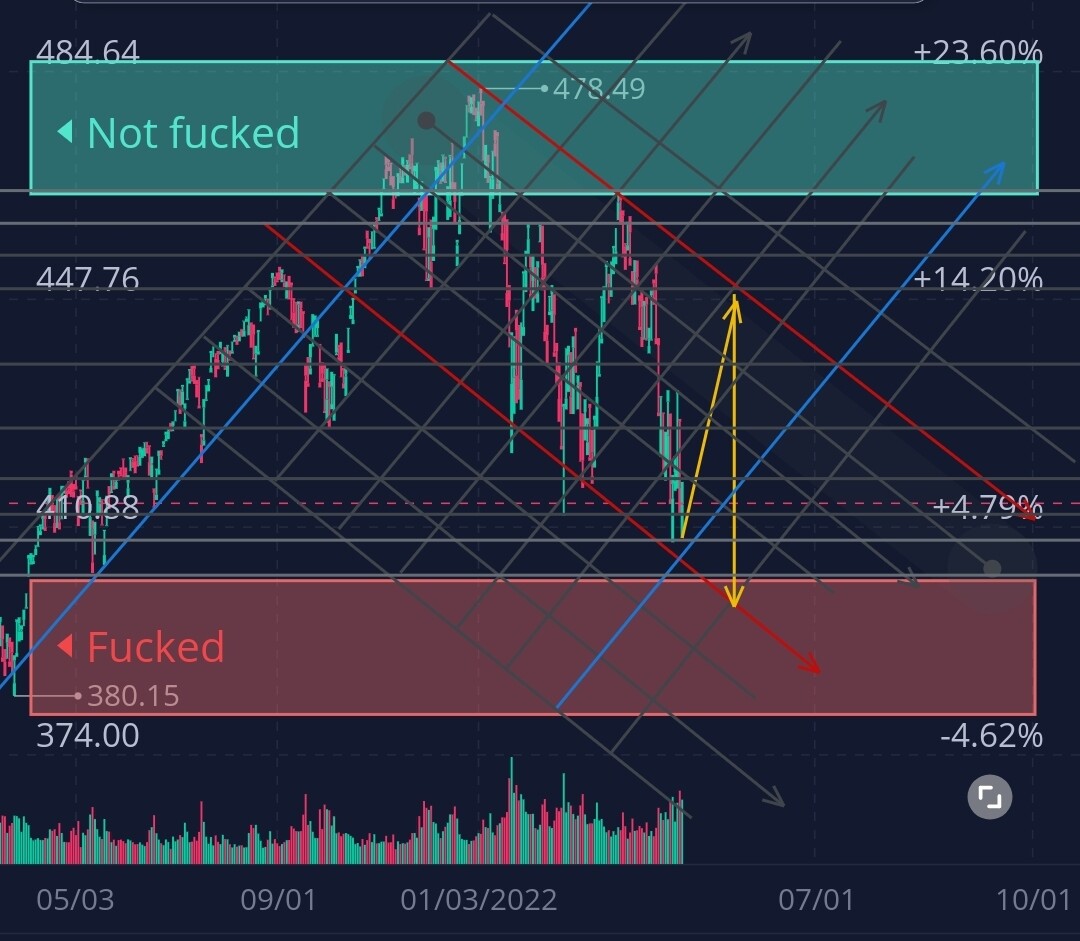
B 439 resistance, 400 support

C 400 support, then 400 resistance ?

D 446 resistance, 419 support, and 460 resistance

