Hi all, I’m transferring this discussion here for possible resolution later–or at least better understanding of this mixup.
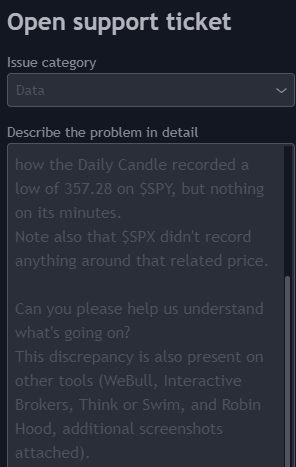
This evening of October 17, 2022, @spysimpcheatham (aka @gigachadcheatham) pointed out a discrepancy between the SPY Intra-Daily Candle and the minutes.
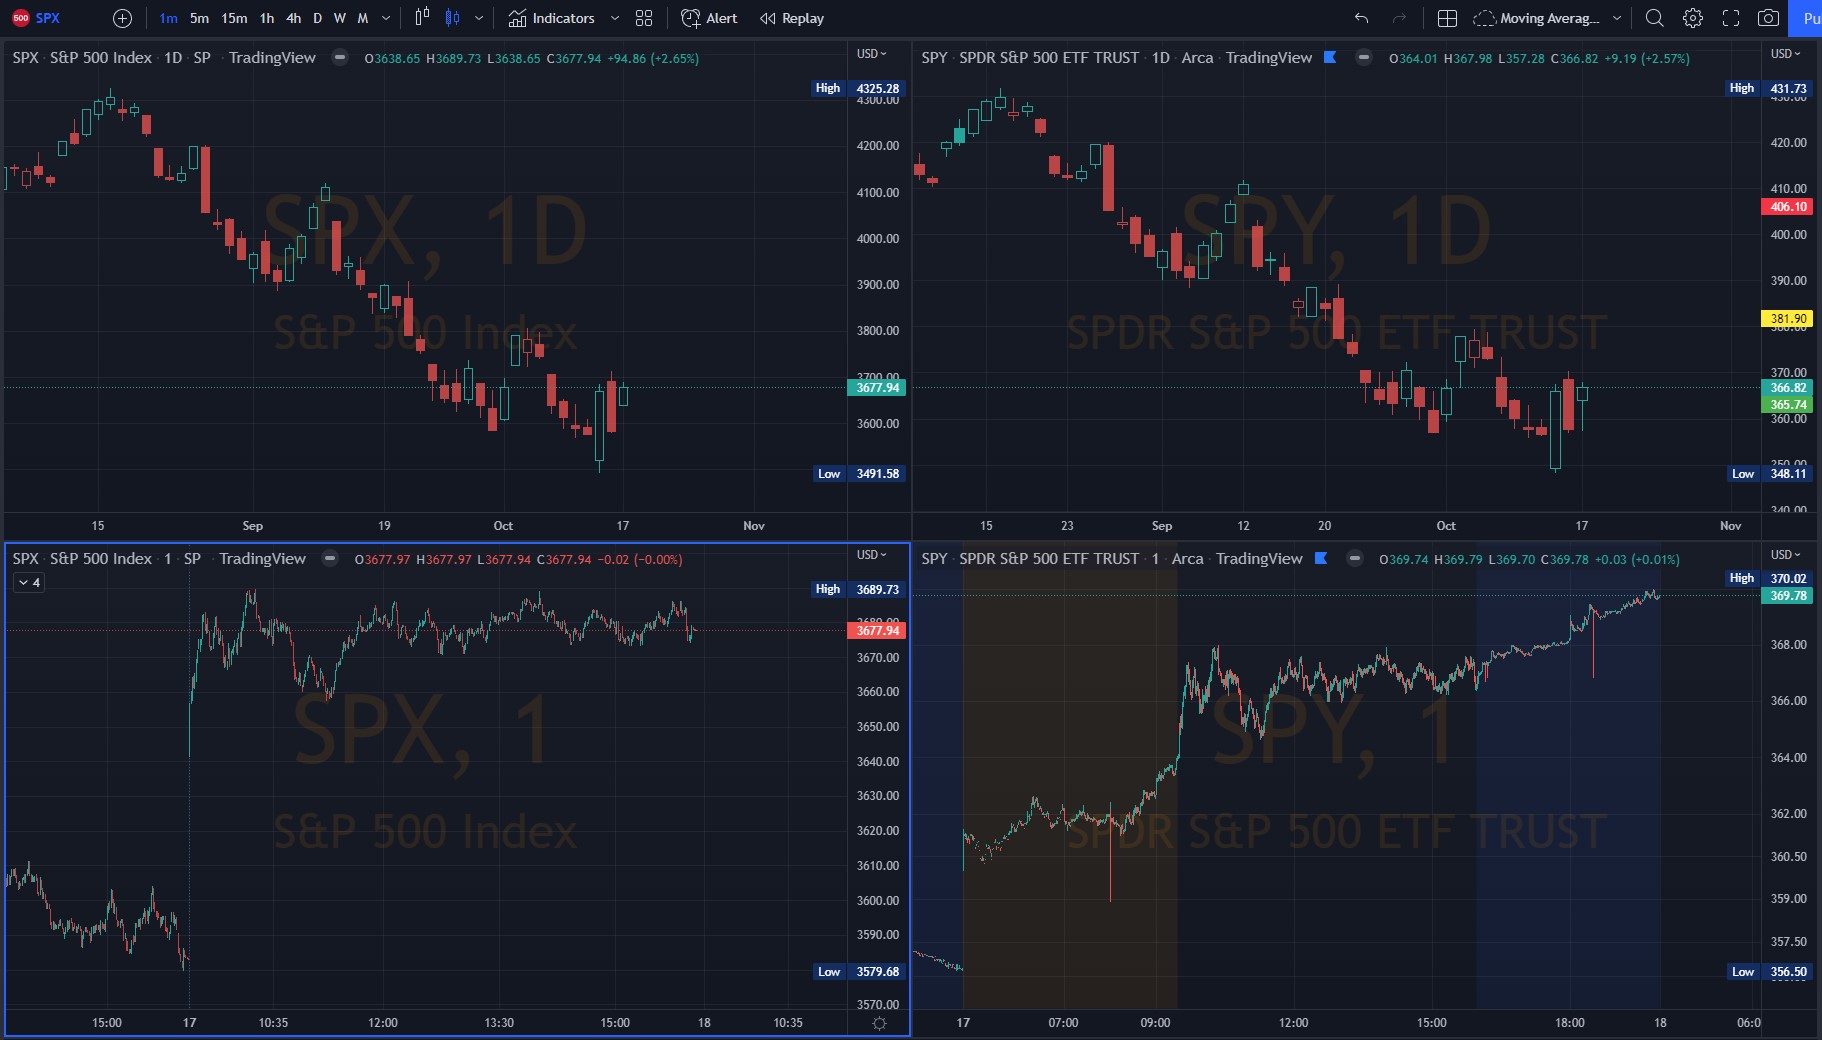
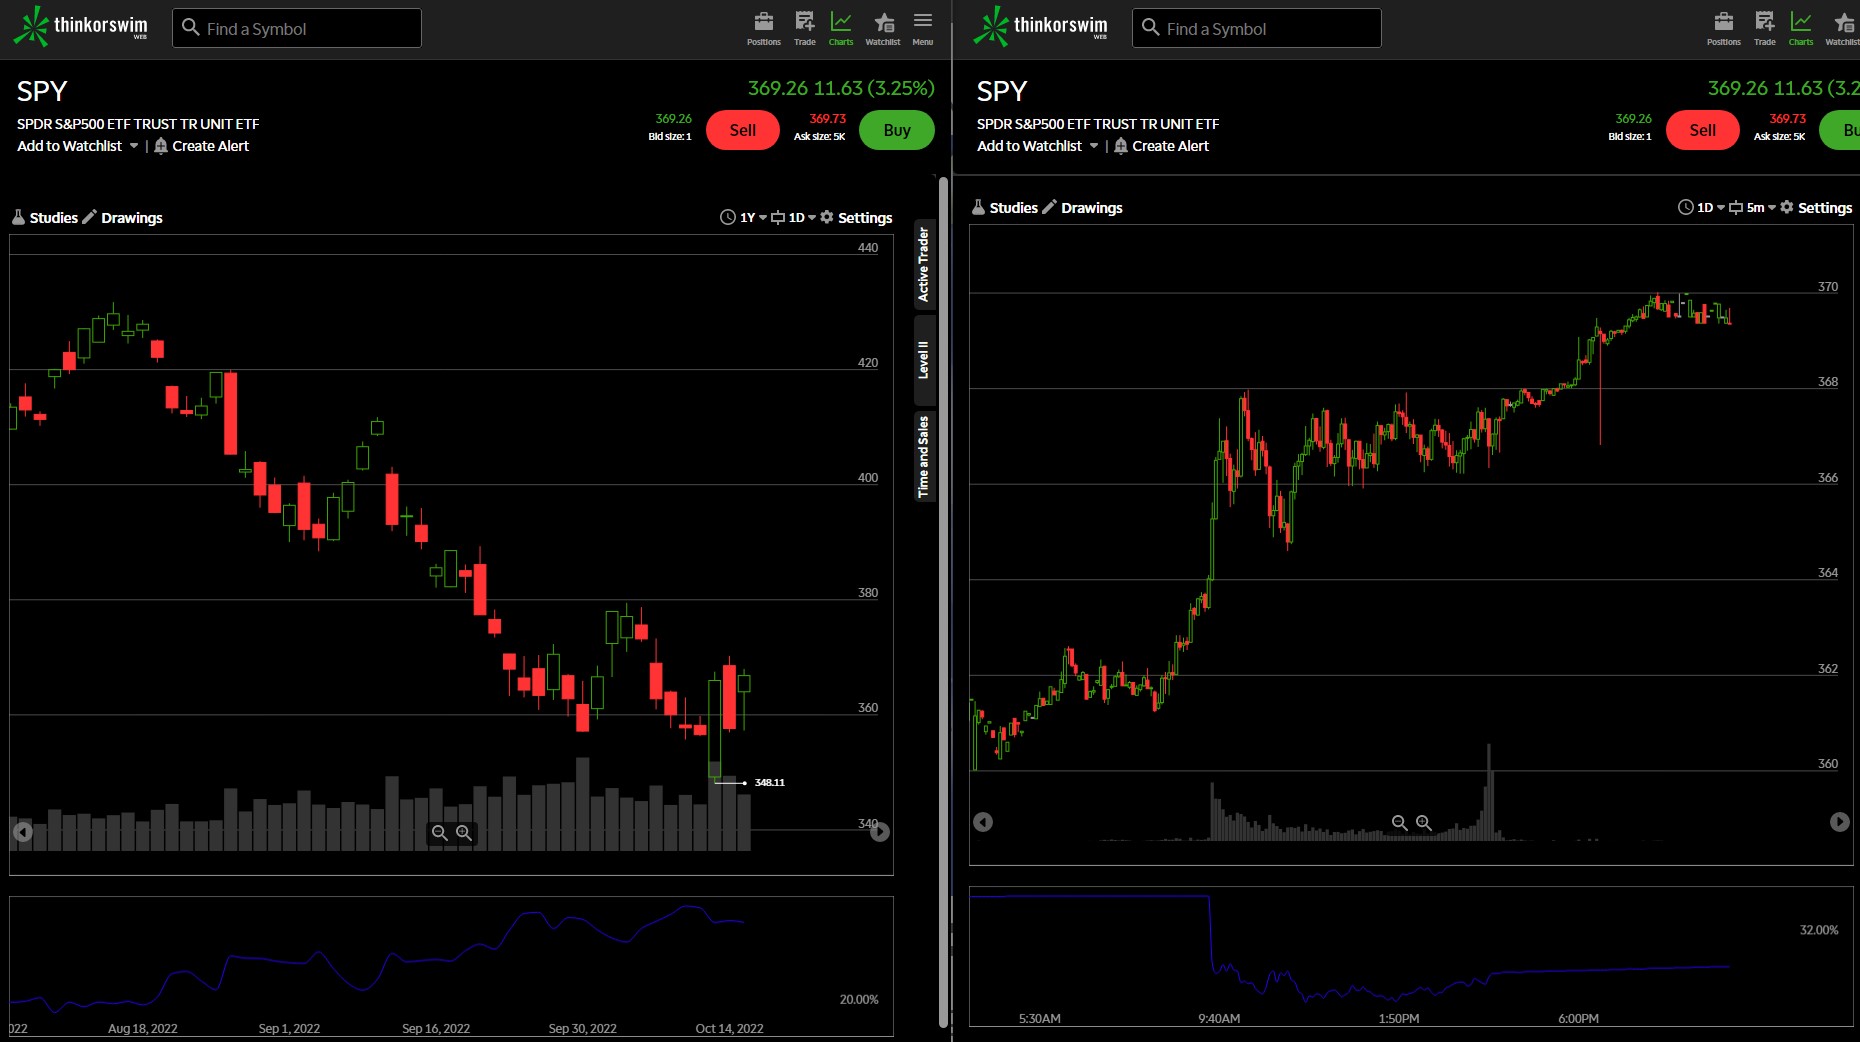
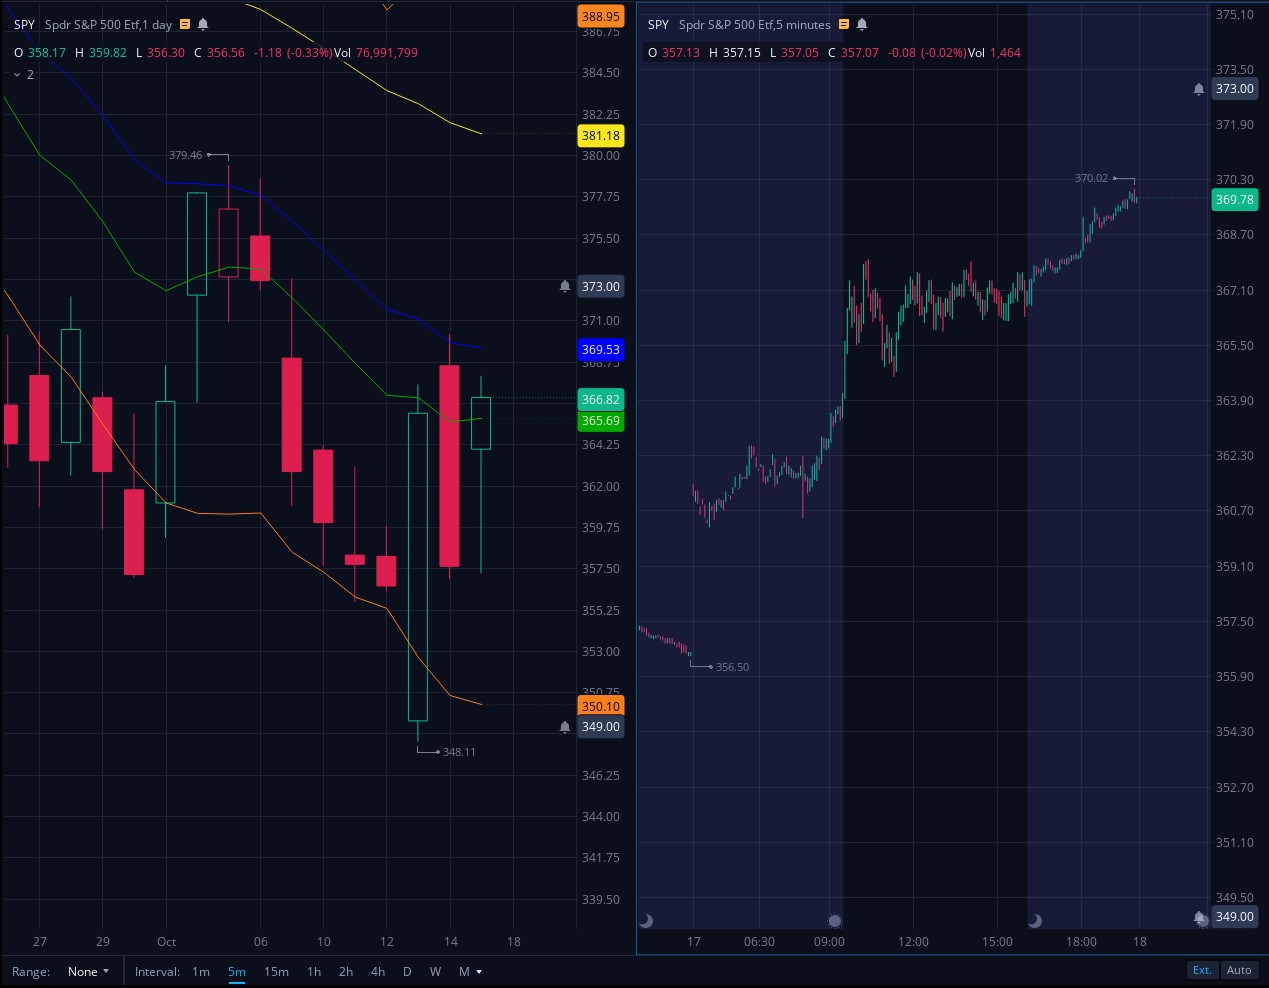
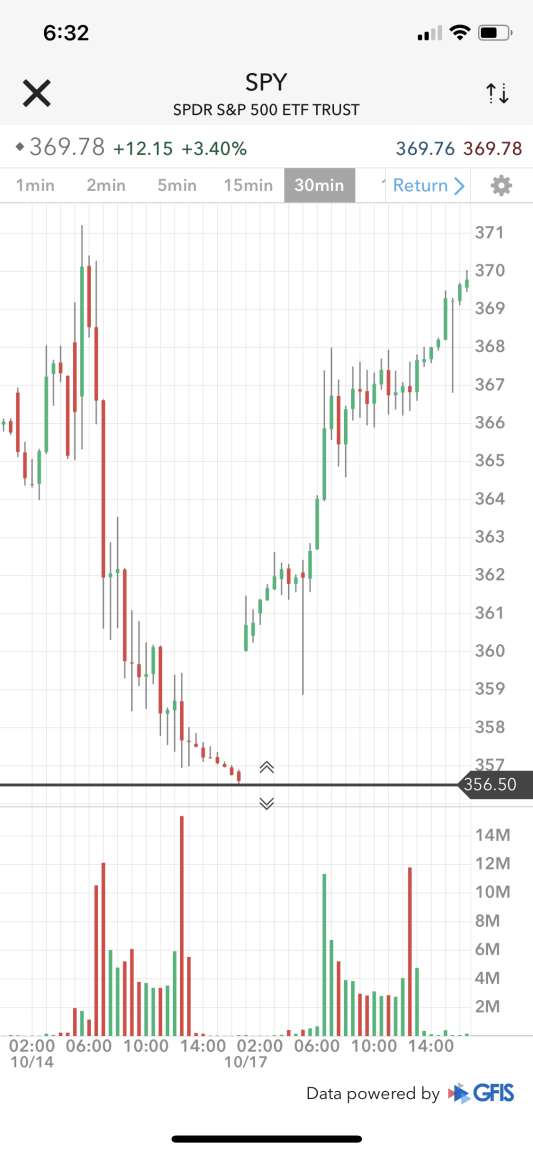
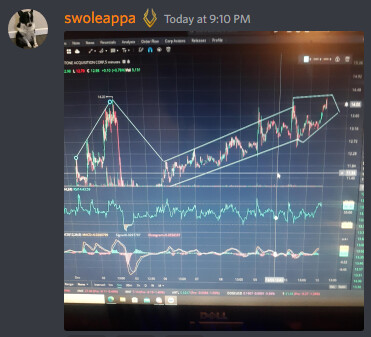
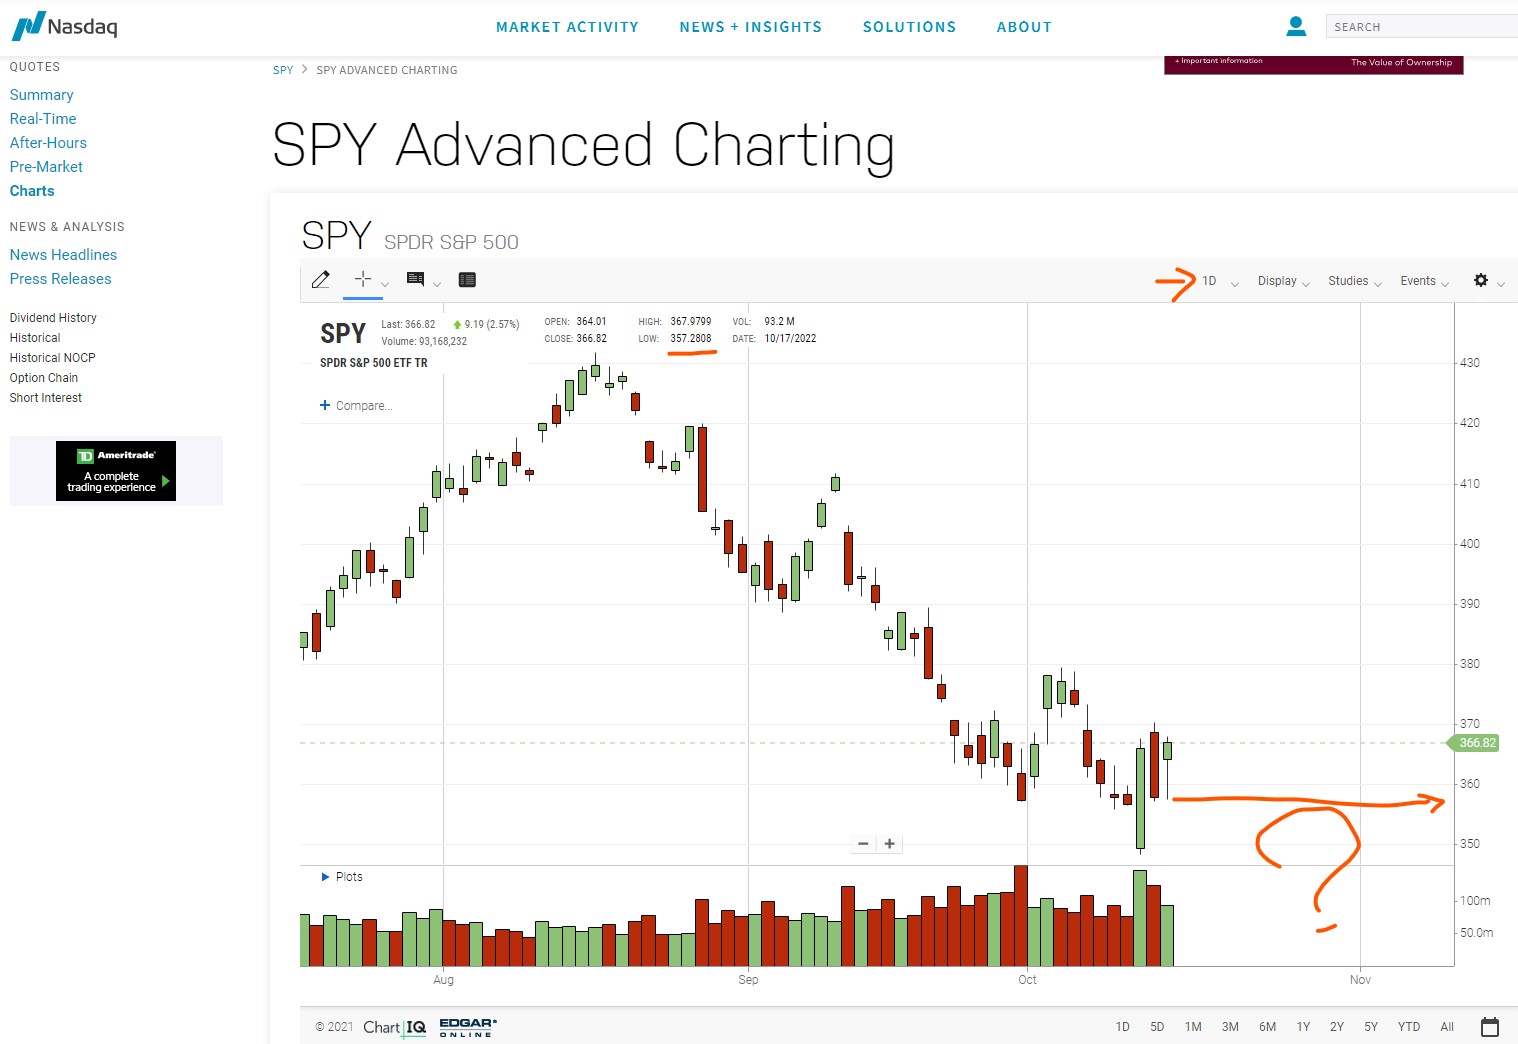
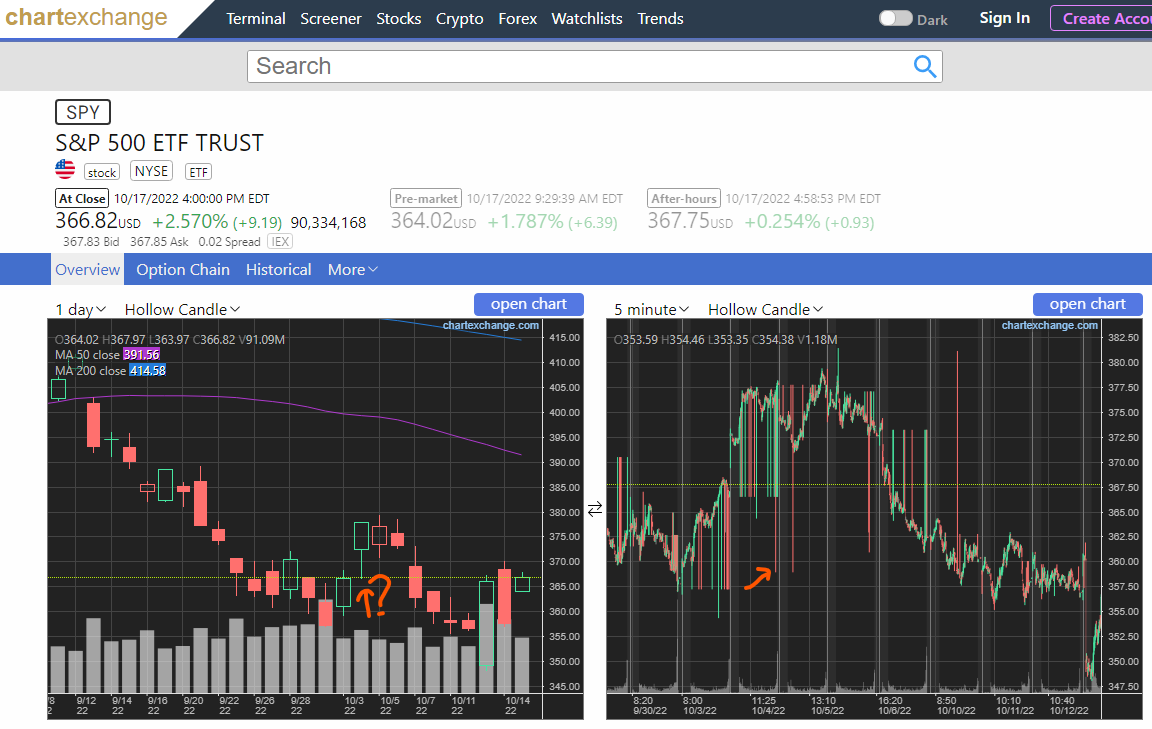
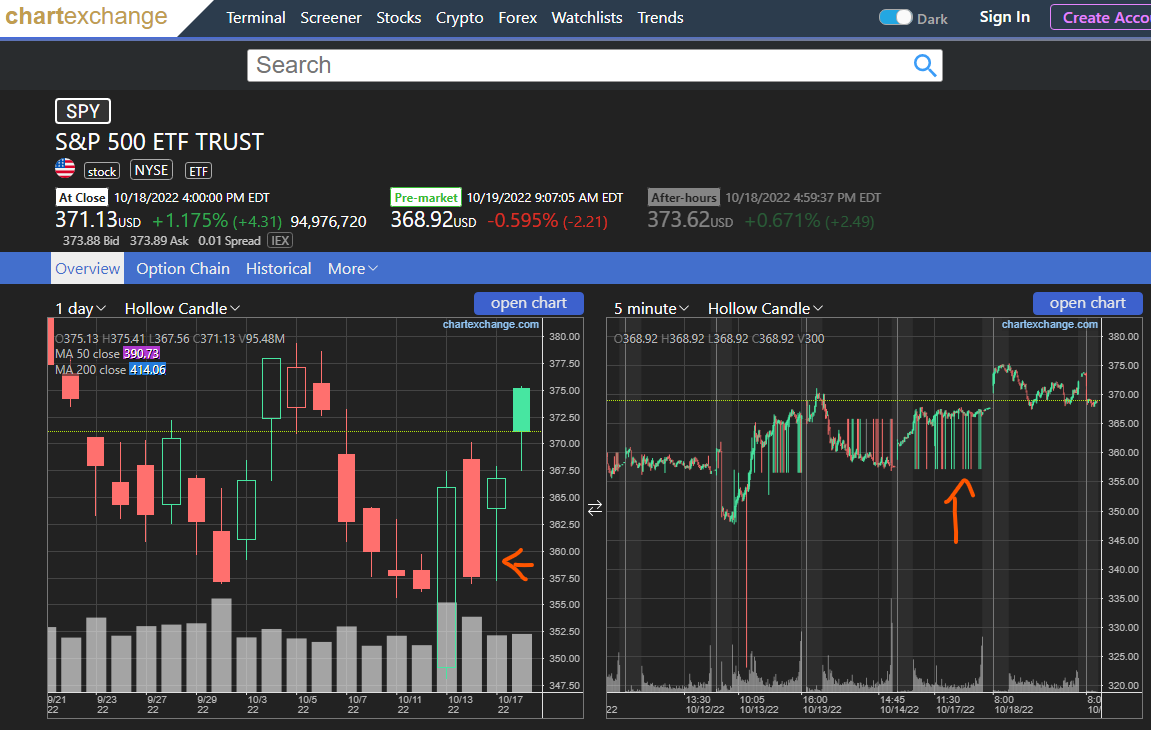
As you will see in the charts below, the Daily Candle for today records a low of 357.28–across all trading tools (TV, WeBull, ToS, IBKR, and even Robin Hood). He also pointed out October 4 had a similar discrepancy.
I didn’t see anything in the options flow either.
Nor in Dark Pool prints and Tradalytics.
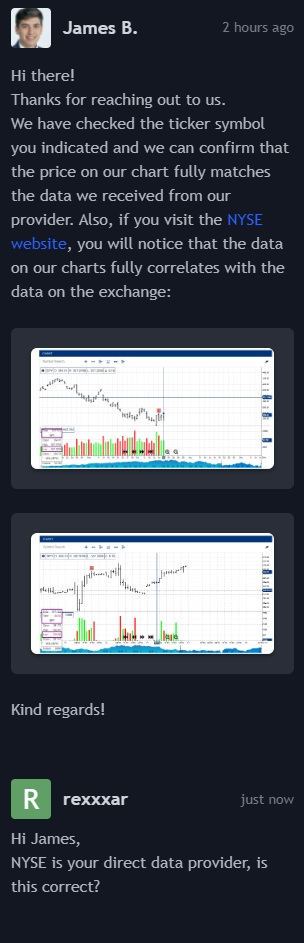
If anyone has better understanding of this, kindly add your data in the comments below. Candle bodies and wicks are important for TA and missing data like this can be a big deal in reading forward market movement. US $SPY is handled by NYSE.
This may prove to be a simple error from NYSE, or something else entirely.
Either way, it takes confidence out of SPY’s Technical Analysis for the time being.
I along with a good number of you here pay good money to try and help the community read the market as best we can, with all the tools available.
If the most basic records cannot be trusted, then we are being led to wrong trade setups–intentional or not.
I’ll be sending my question to Trading View’s support channel.
Thanks again, @gigachadcheatham. Get in the forums brah.
Support Ticket to TV has been opened…
I’m taking this seriously since I am here trying to help this community.
Please don’t let this issue cripple your trades, though.
For the moment, I will simply stay away from SPY and whatever other ticker gives this kind of mismatched data.
Unfortunately, I suspect there’s a good number of flawed tickers out there.
Fekkin hell. This will complicate reading the charts.
Please remind yourselves and each other to compare Minutes to Macros at the end of every trading session.
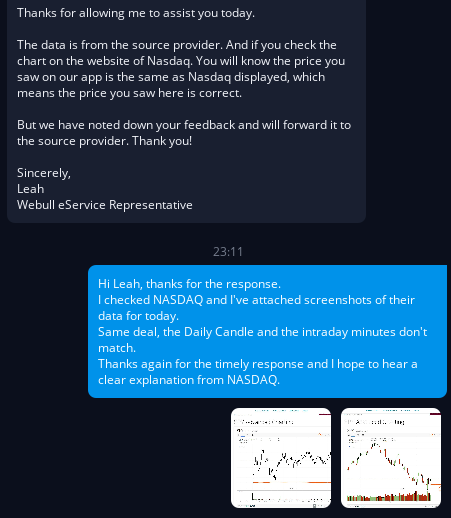
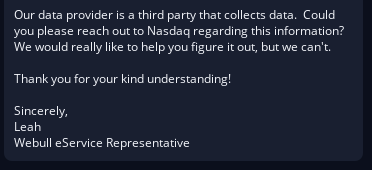
Basic Translation: The data matches what our provider sent us so nothing more to investigate. Fuck you and thank you for your premium annual subscription.
Well if that the same response I’ll get from NASDAQ / NYSE, then clearly it’s a known issue and nobody cares about data integrity.
The message will be this: Yeah the market is flawed, but so what? Accept it and play or don’t play at all.
Do what you will with these responses from both WeBull and Trading View, but make sure you exit with profit or minimal loss.
Play or walk damn far away. Your money, your call.
I’ll have to recalibrate myself to this data discrepancy.
Doubt I’ll be effective for macro SPY Technical Analysis until I’ve practiced enough with it.
Will step out from the threads for the meantime, so keep things green fam.
Did you check to see how many shares were sold at that price? I’ve noticed wild wicks at times from 1 or 2 share transactions. Perhaps they started filtering them due to people complaining how it would mess up the charts on the shorter time frames?
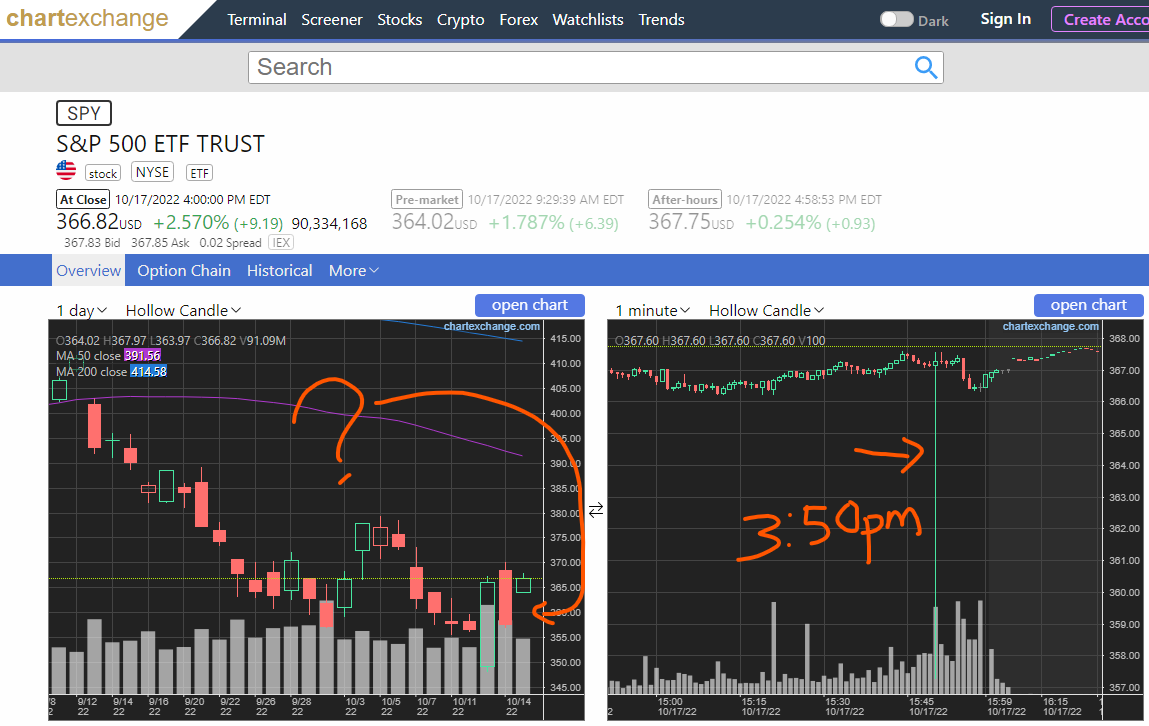
As mentioned above, only Chart Exchange recorded it in the minutes.
Scrolling to that specific minute of 15:50 2022-10-17 in Chart Exchange, it shows 876.28k Volume.
Trading View has the same exact minute at 743.987k Volume.
A difference of 132.293k Volume.
What’s important for me is that I read the Macro candles more than the minutes.
This is for my swing trades–which is what I do most of the time.
A missing wick can easily throw my projection off.
Yesterday for example, could have been read as a short weak candle, which would have encouraged me to exit my positions–if the wick was missing.
Since the wick was present in the Daily Candle, I held onto my positions, expecting a continuation of this short rally.
Now depending if SPY hold this bullish price at open, I would indeed be profitable, a great affirmation to my study.
But I don’t depend on luck, and it could easily sell-off before market open and counter the possible false signal from a Daily Candle.
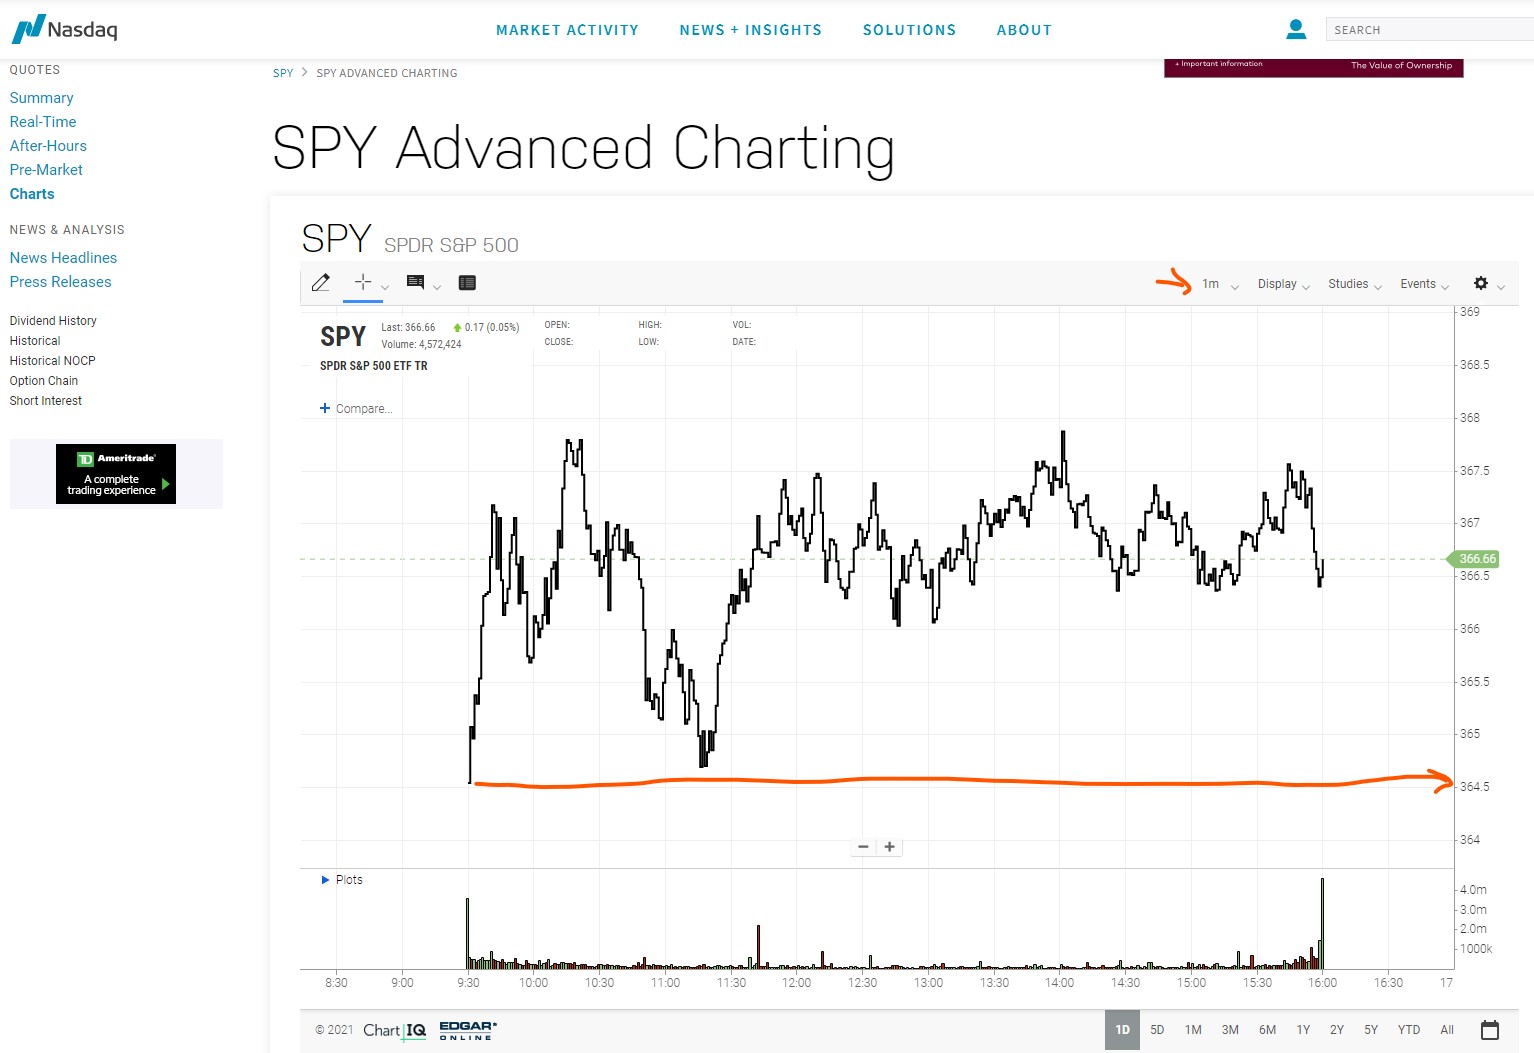
This wick is only present on the Daily Candle, and missing from the 4hour candles down to the seconds (TV, WB, ToS, IBKR, RH, NASDAQ).
Final response from Trading View…
Basically, they don’t care.
Will try to find time next week and reach out to NYSE / NASDAQ.
The goal is to better understand how to trade well–if not better–despite mismatching data.
I doubt enough people care at any level (only those who will lose a lot might eventually give a shit or two, besides us TA geeks).
Don’t even dream about getting full transparency from NASDAQ.
Today’s Daily SPY candle matched with the minutes, btw.
No issues.
Those who use Ice’s data services remain mismatched (TV, WeBull, ToS, RH, IBKR).
I will keep checking Chart Exchange’s macro charts for my studies.
Will be getting off TV’s premium subscription, at least one tier down.
Might be best for me to send this observation to WeBull, let them compare data providers.