SPY Tech Anal: Sell In May and Go Away?

TLDR: We may have seen a local bottom around here and may be trapped in the 410-430 range until FOMC

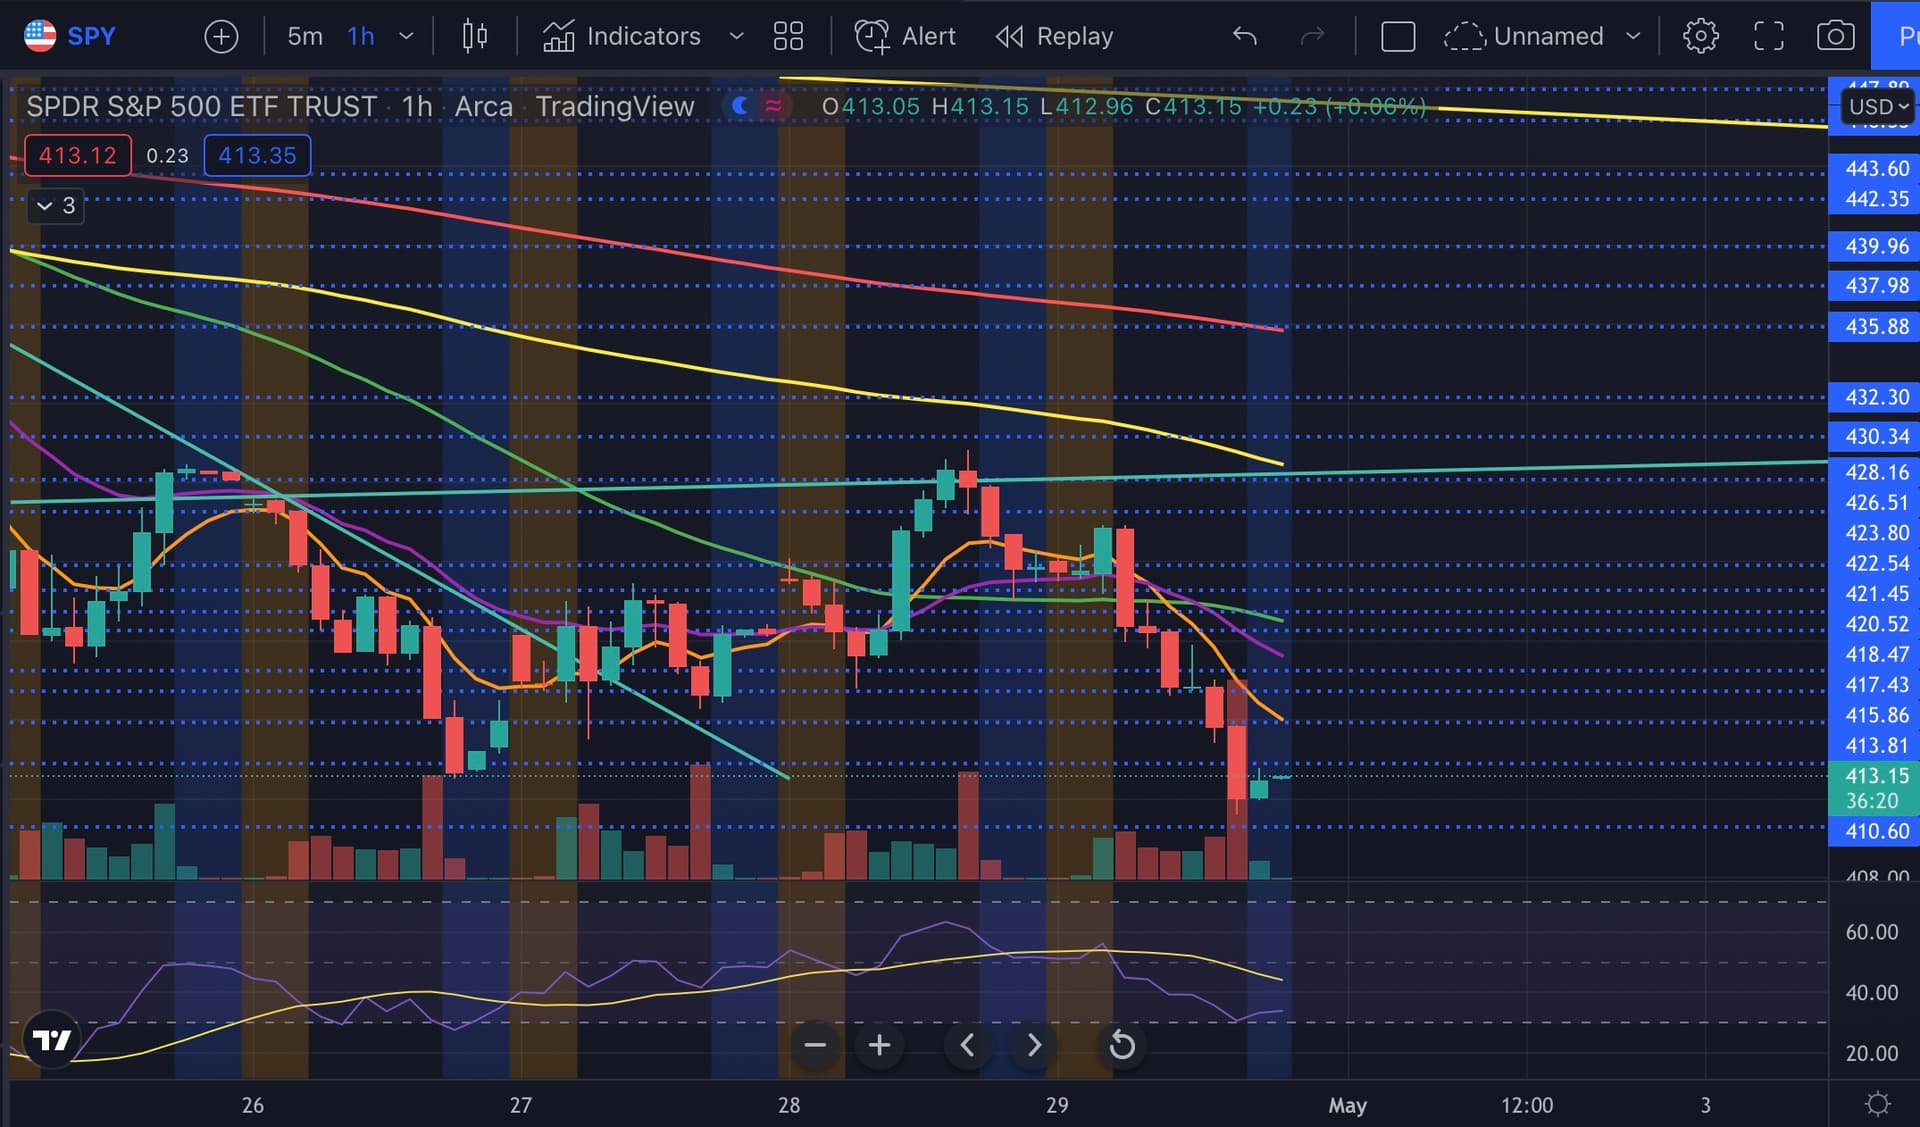
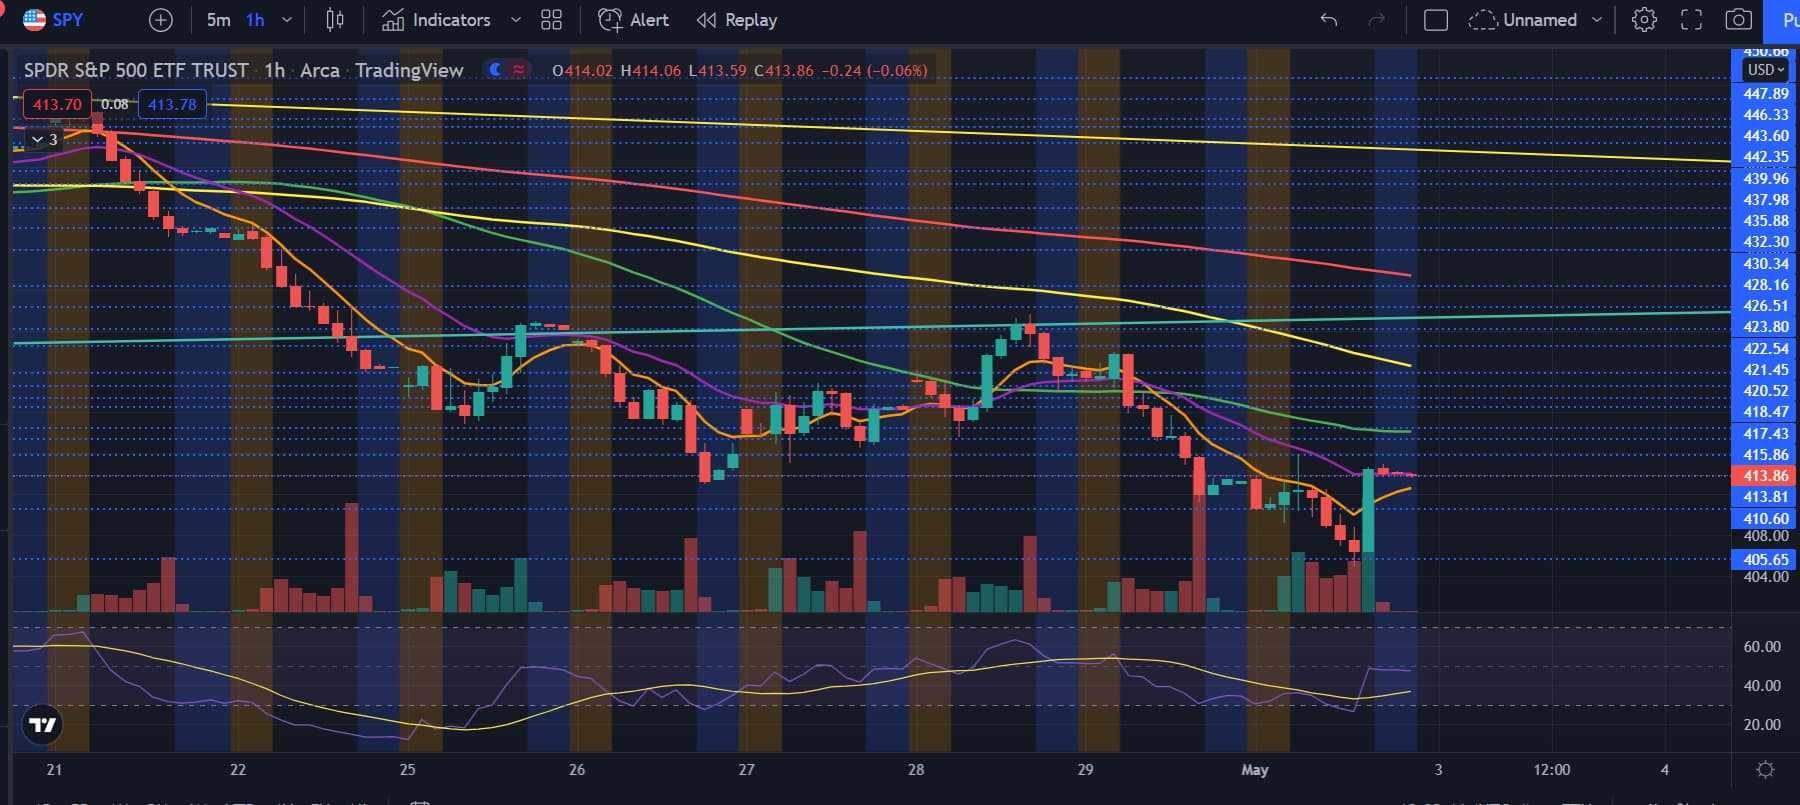
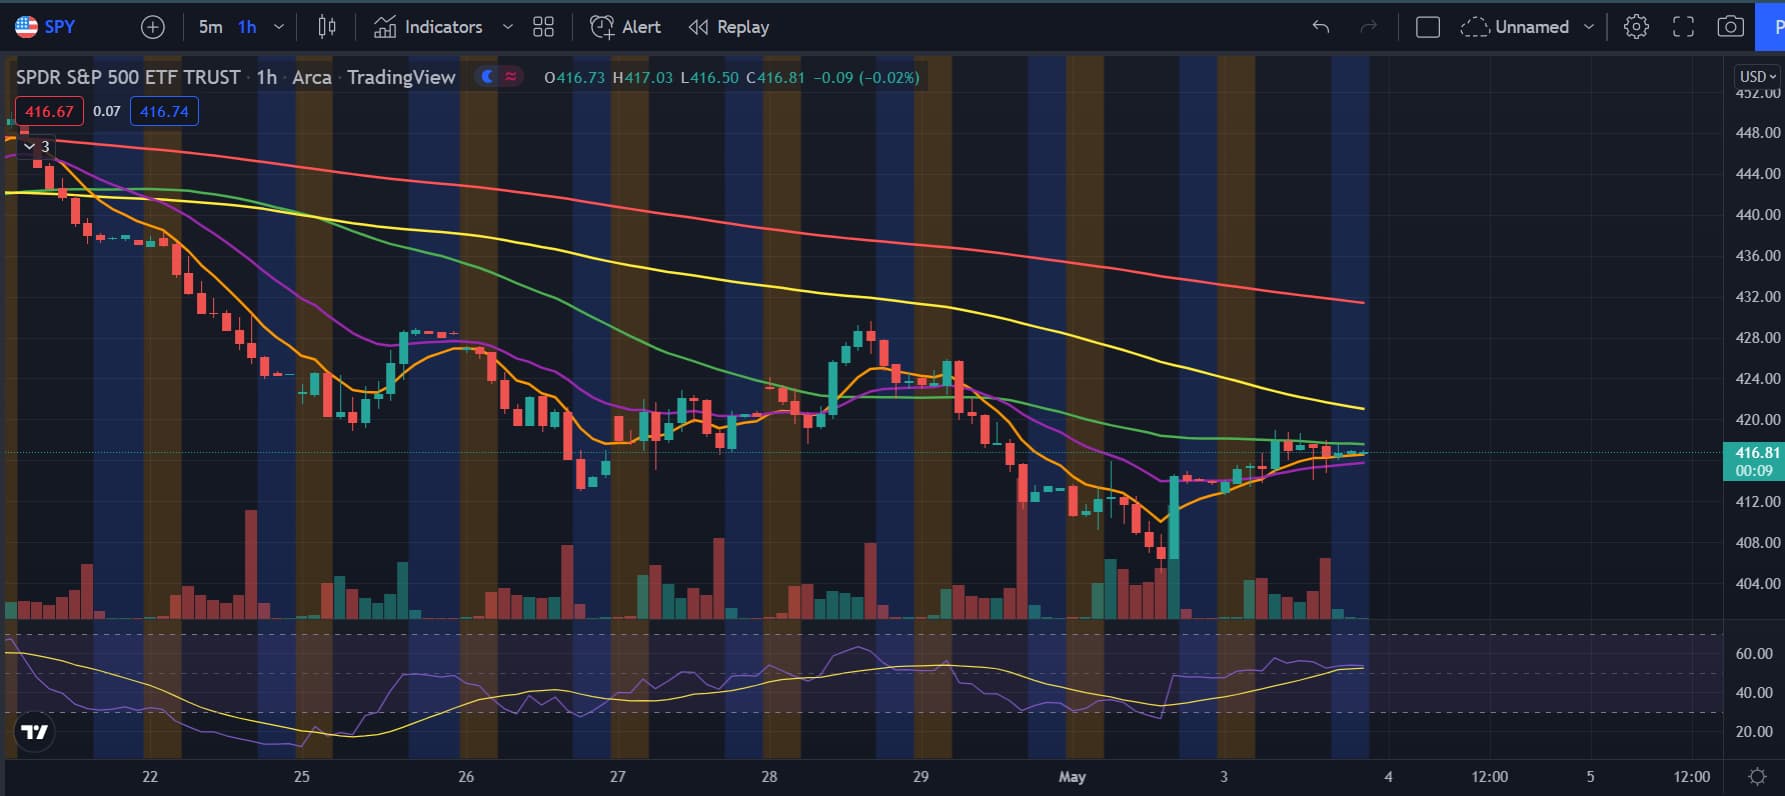
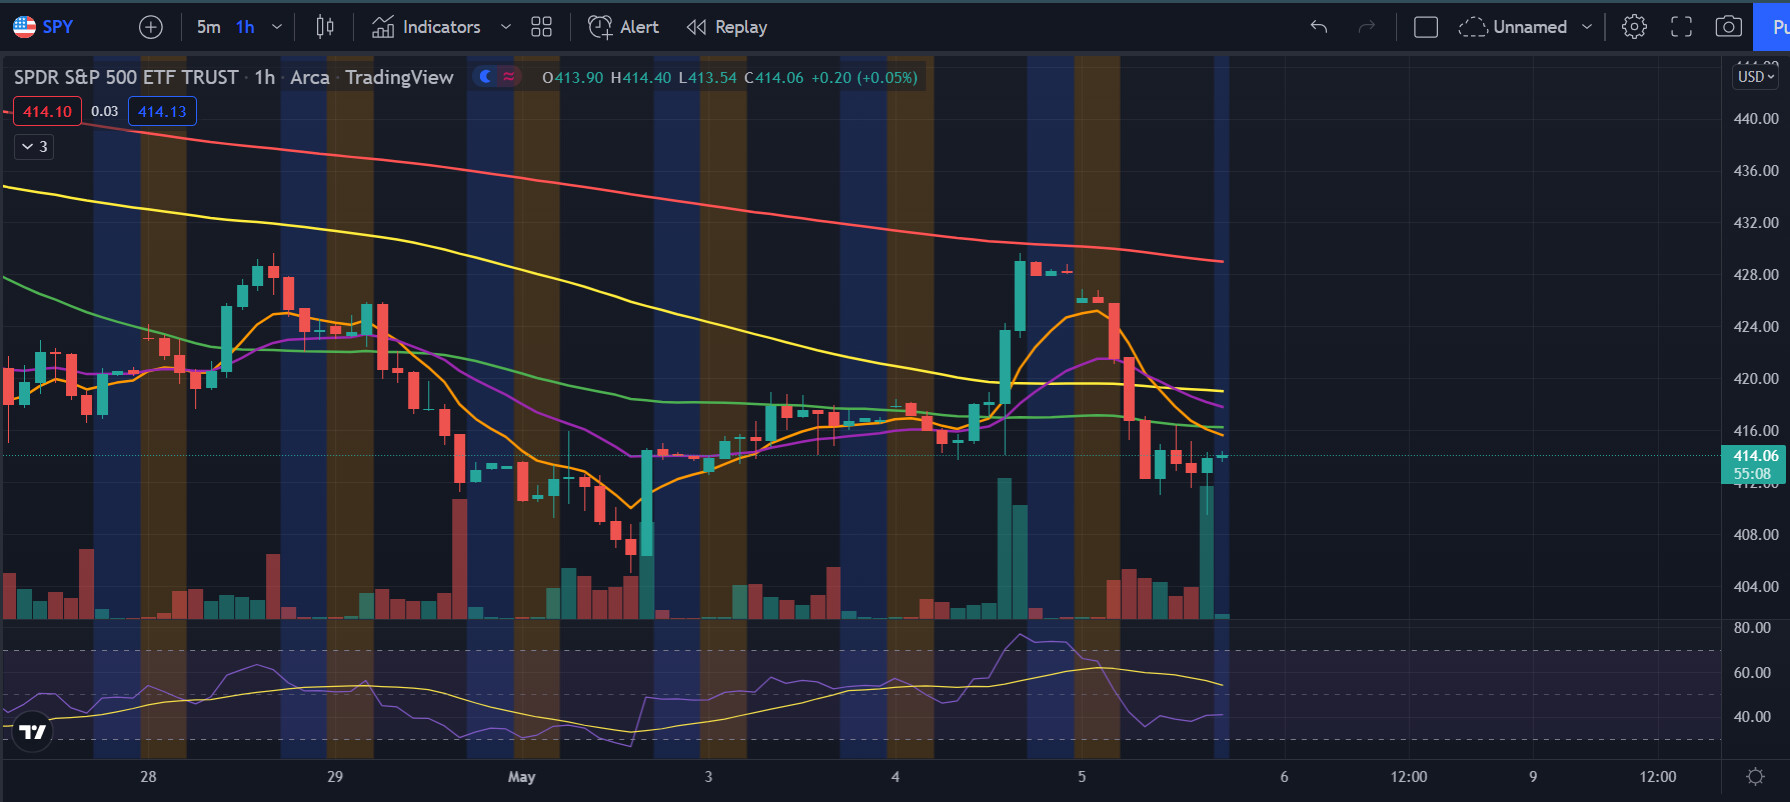
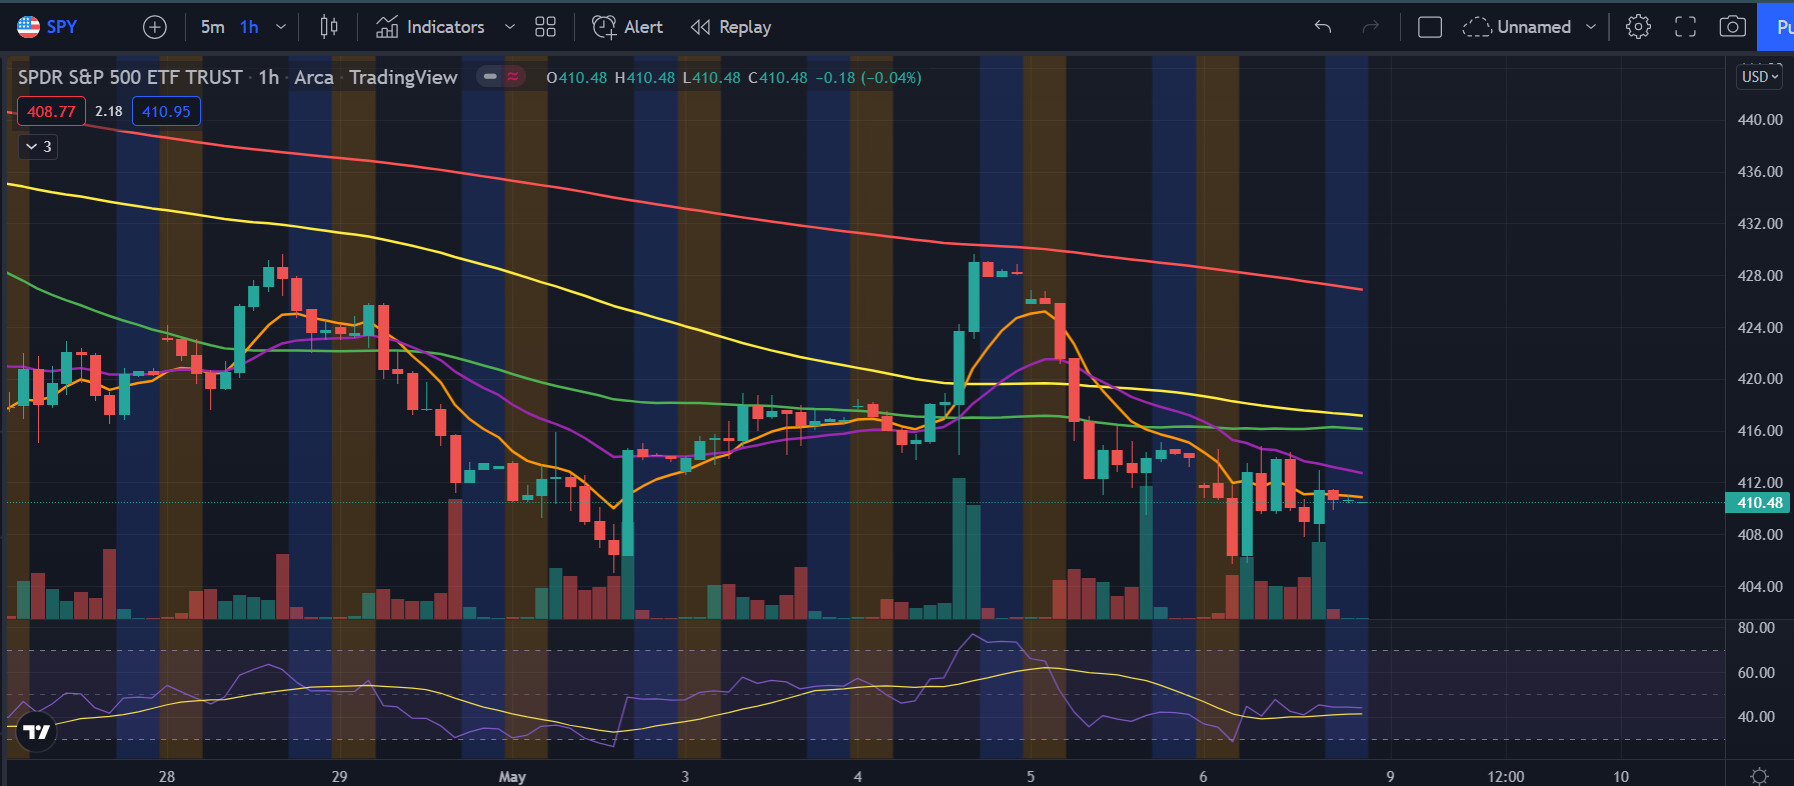
Looking at the 1 hour on SPY, we can see that the 8 and 21 EMA showed a false reversal. We are back below both and looking bearish, esp breaking below 415. Something to note is that the RSI still isn’t making a new low even after being the lowest it’s been all week. This is bullish, although this is just one sign out of the ten bearish signs. Something to note, the risk reward in the short term here for puts isn’t amazing.

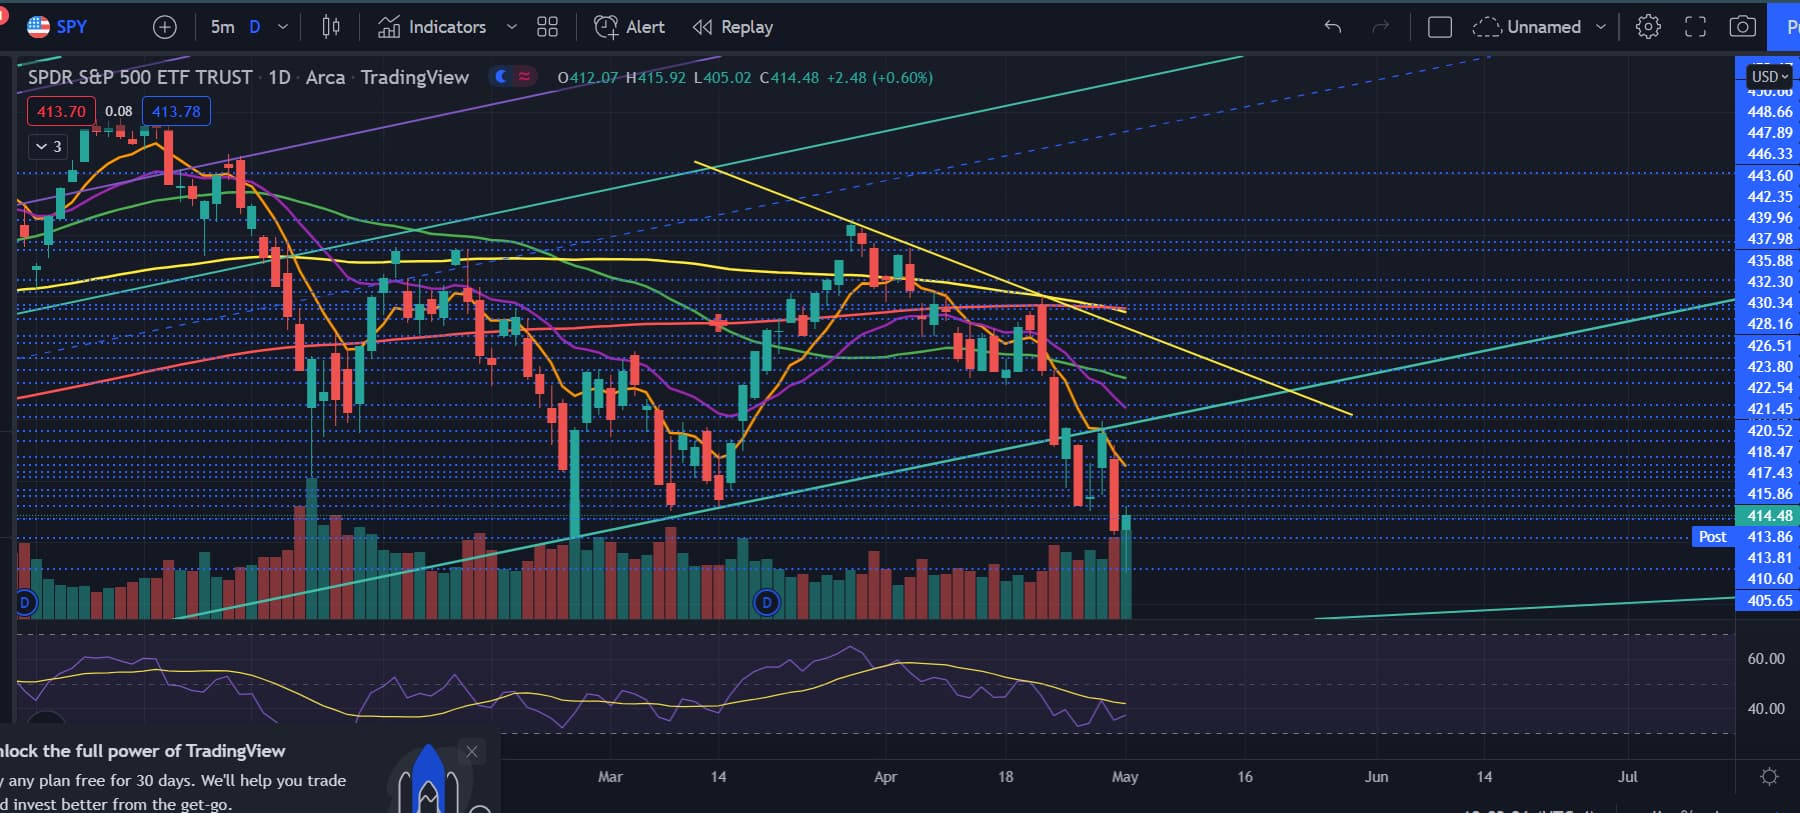
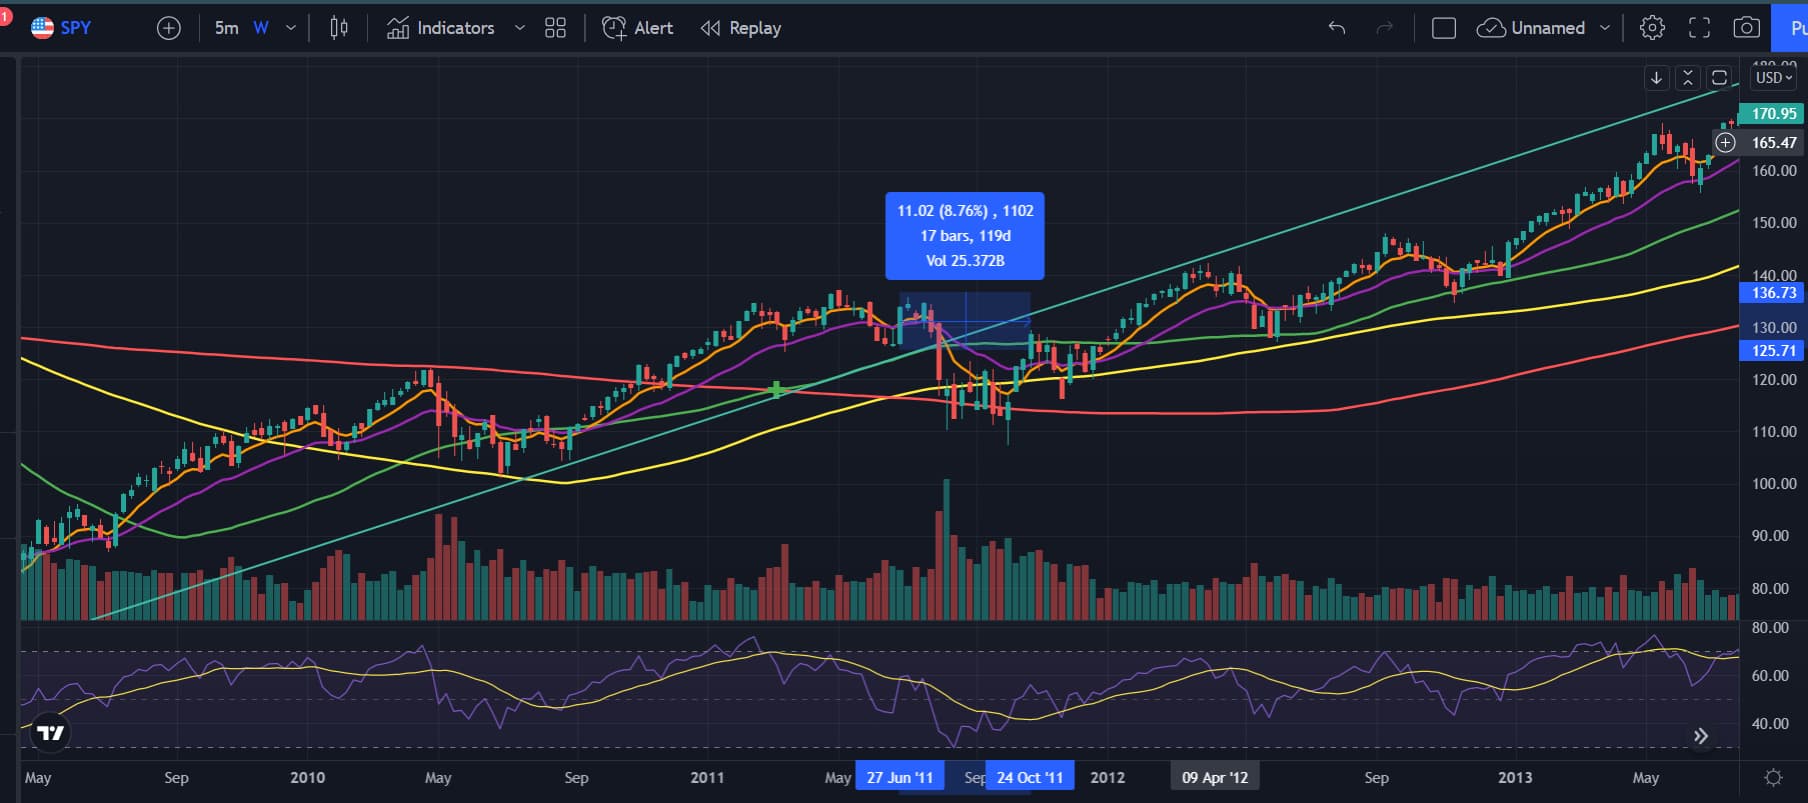
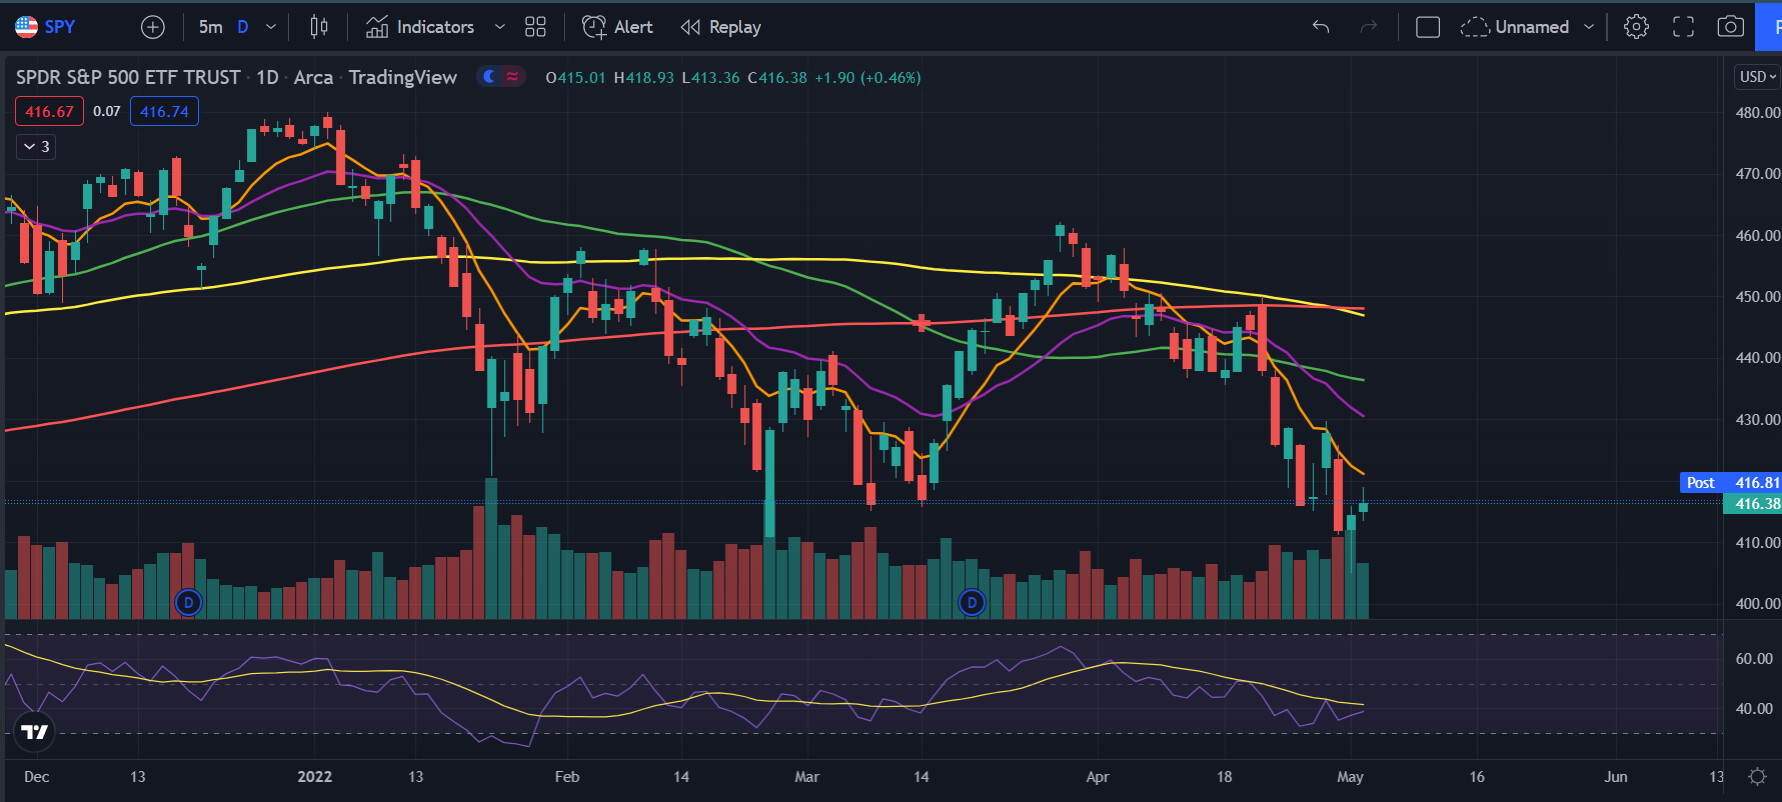
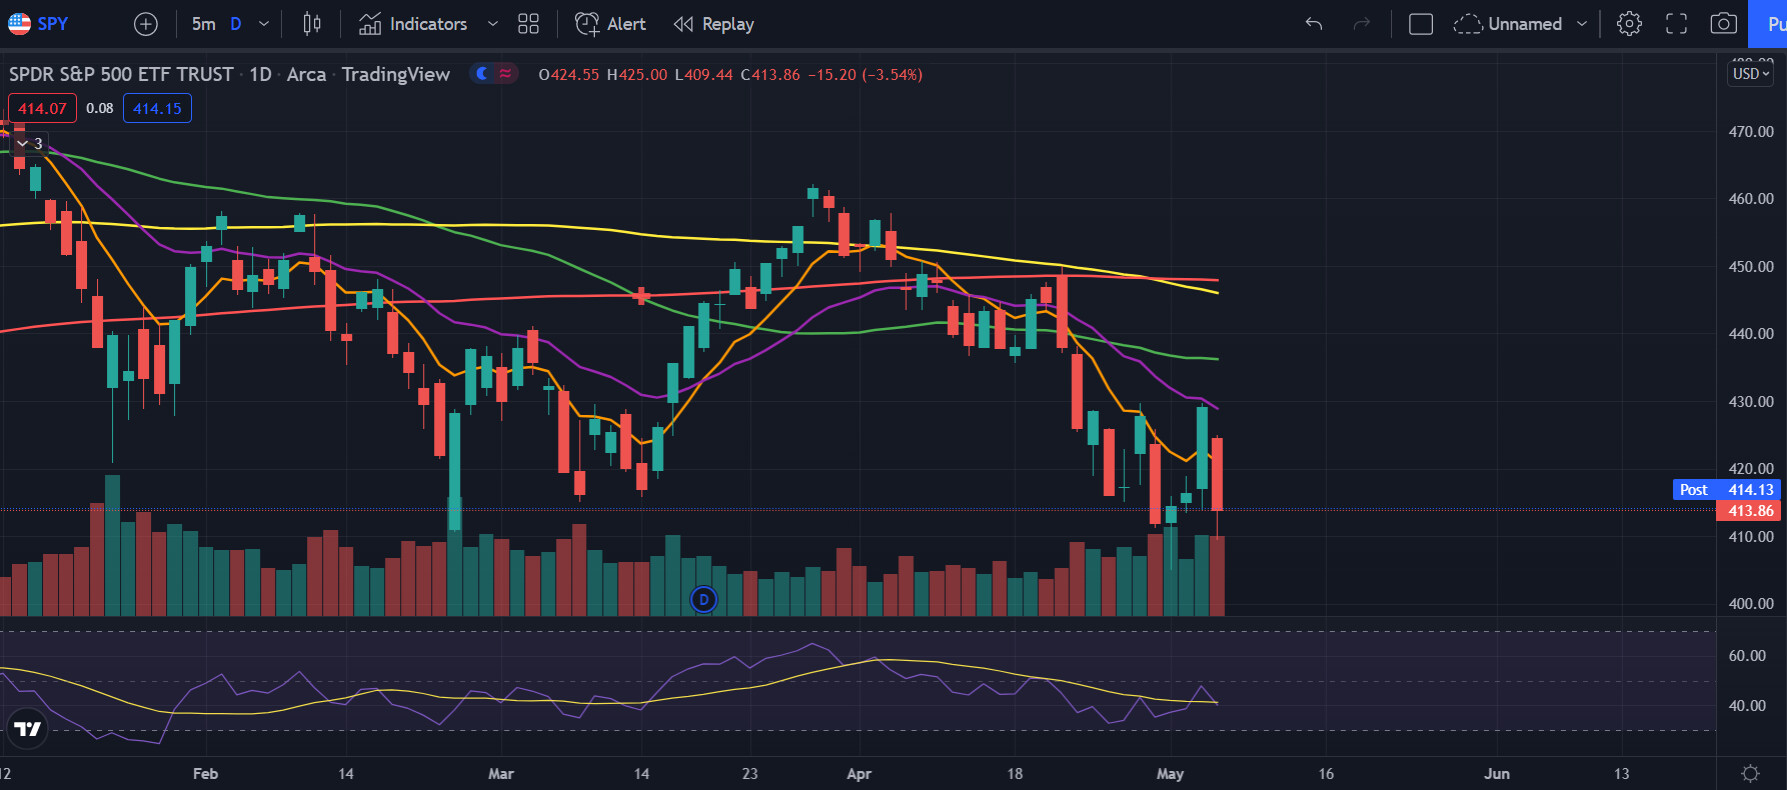
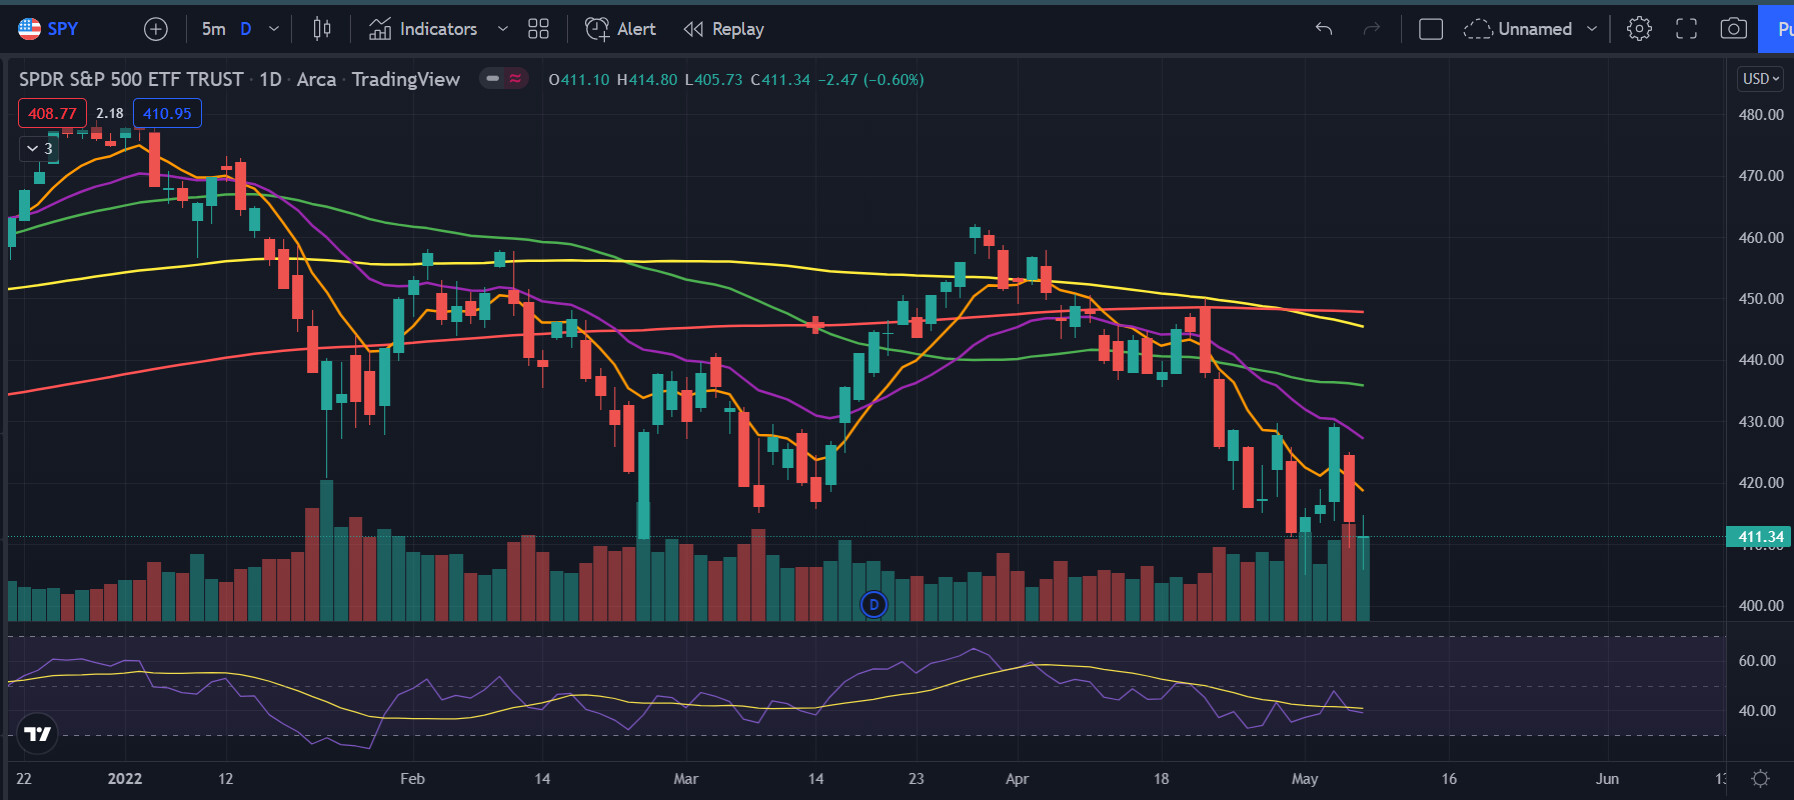
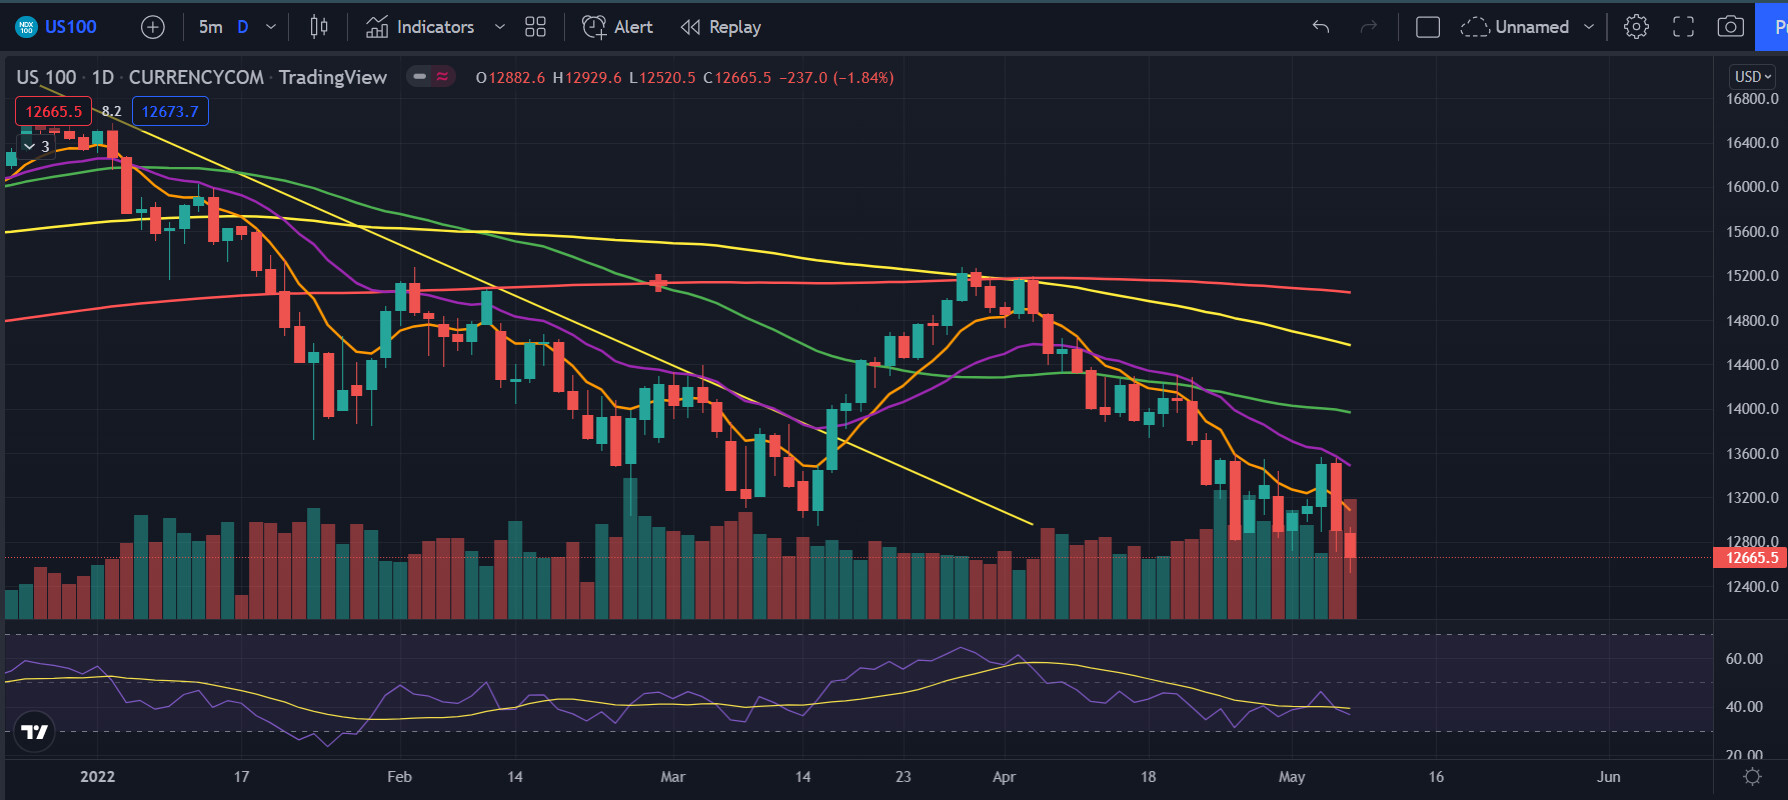
SPY on the daily is also bearish. Full candle close as the new low and looking like a break out of the trading channel. Something to note again is that the RSI is showing a higher high even tho the price is much lower. The pric is also pretty diverged from the EMA and we could see a return to average soon as we did yesterday. Sell volume was still big and a pretty clear sign of bad news bears. This just seems like a lower high and a lower low so be careful placing long term calls here.

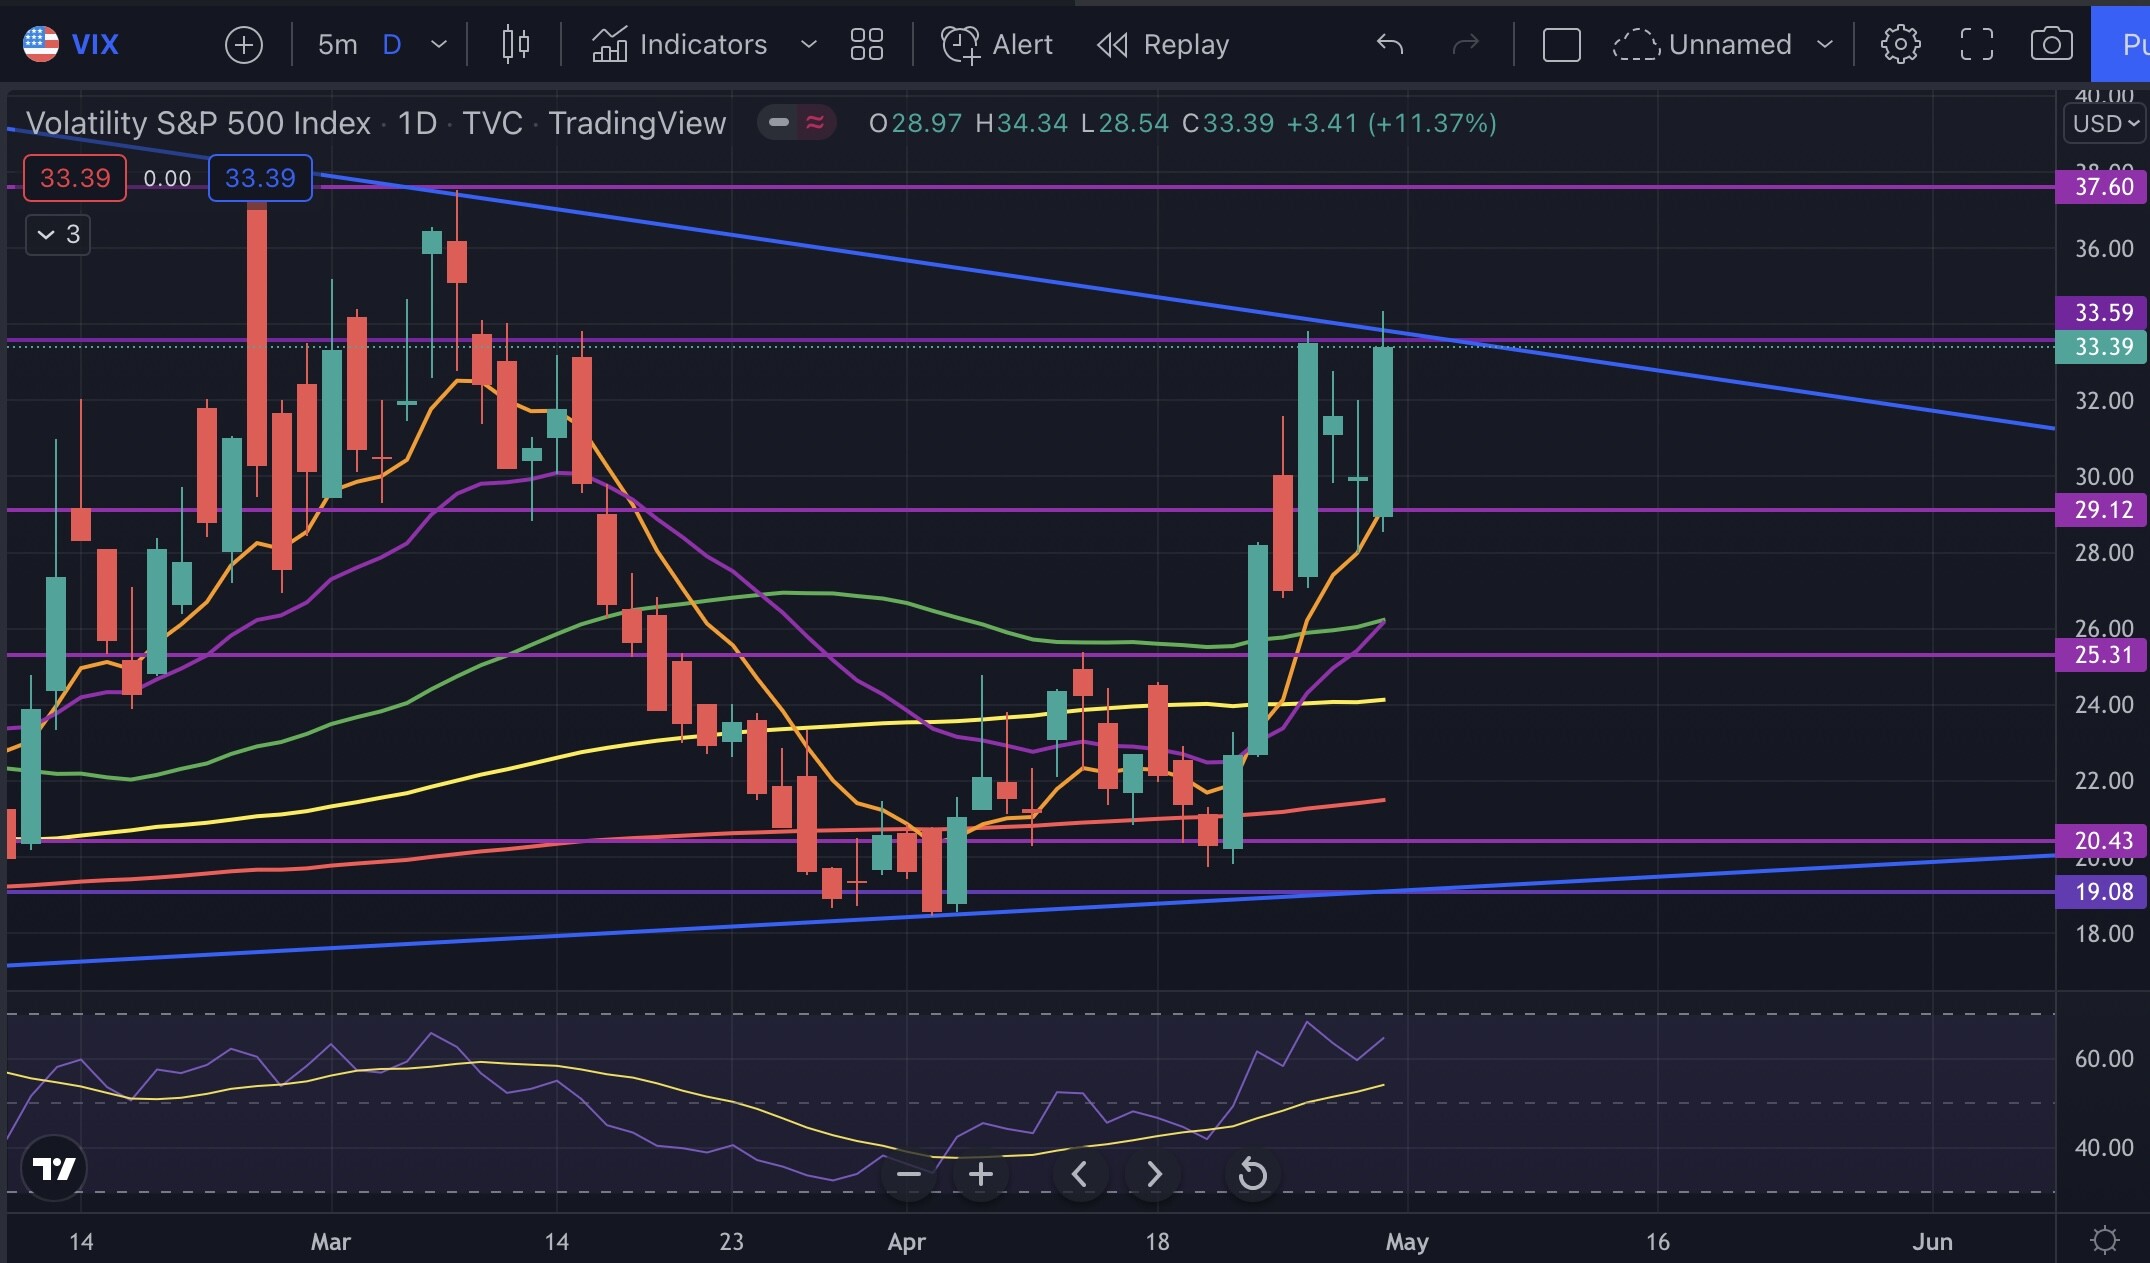
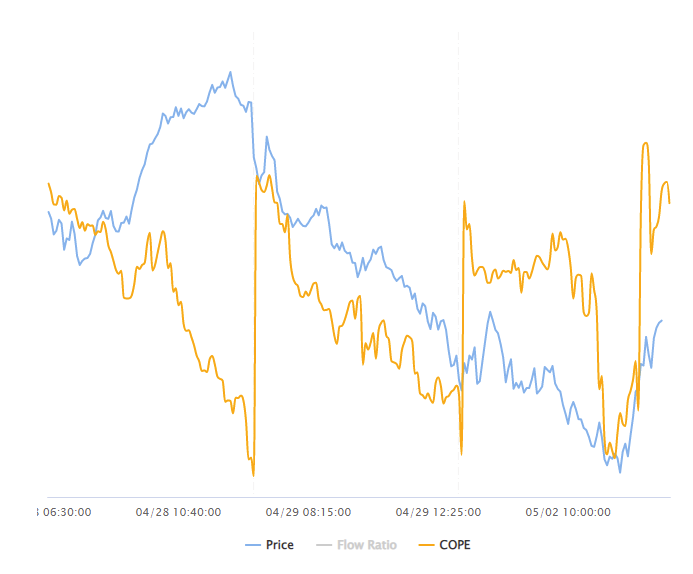
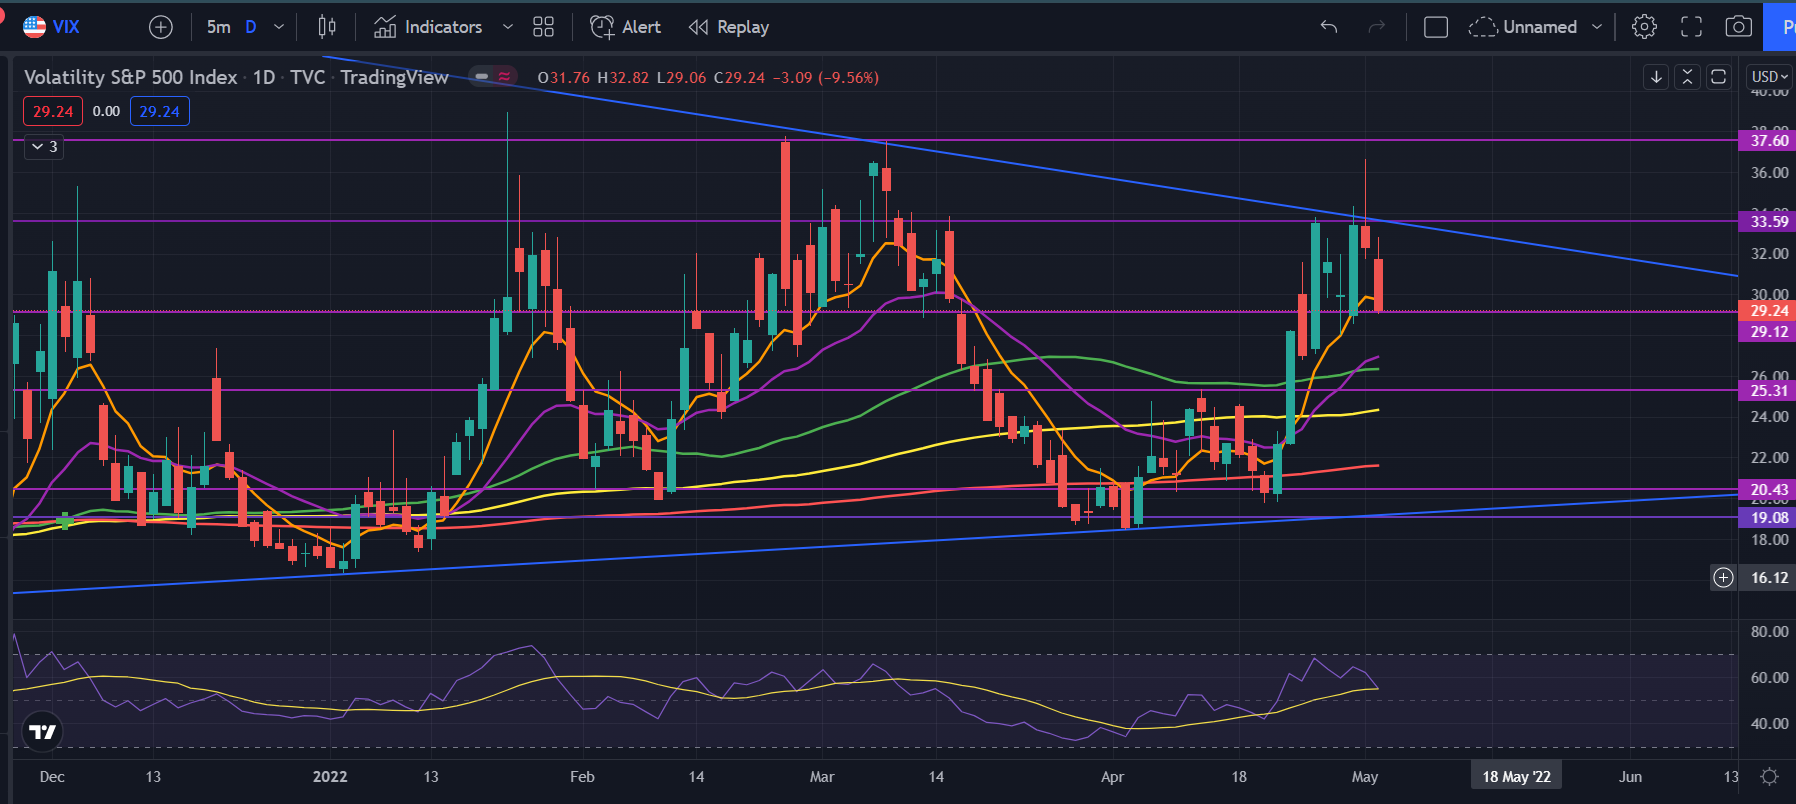
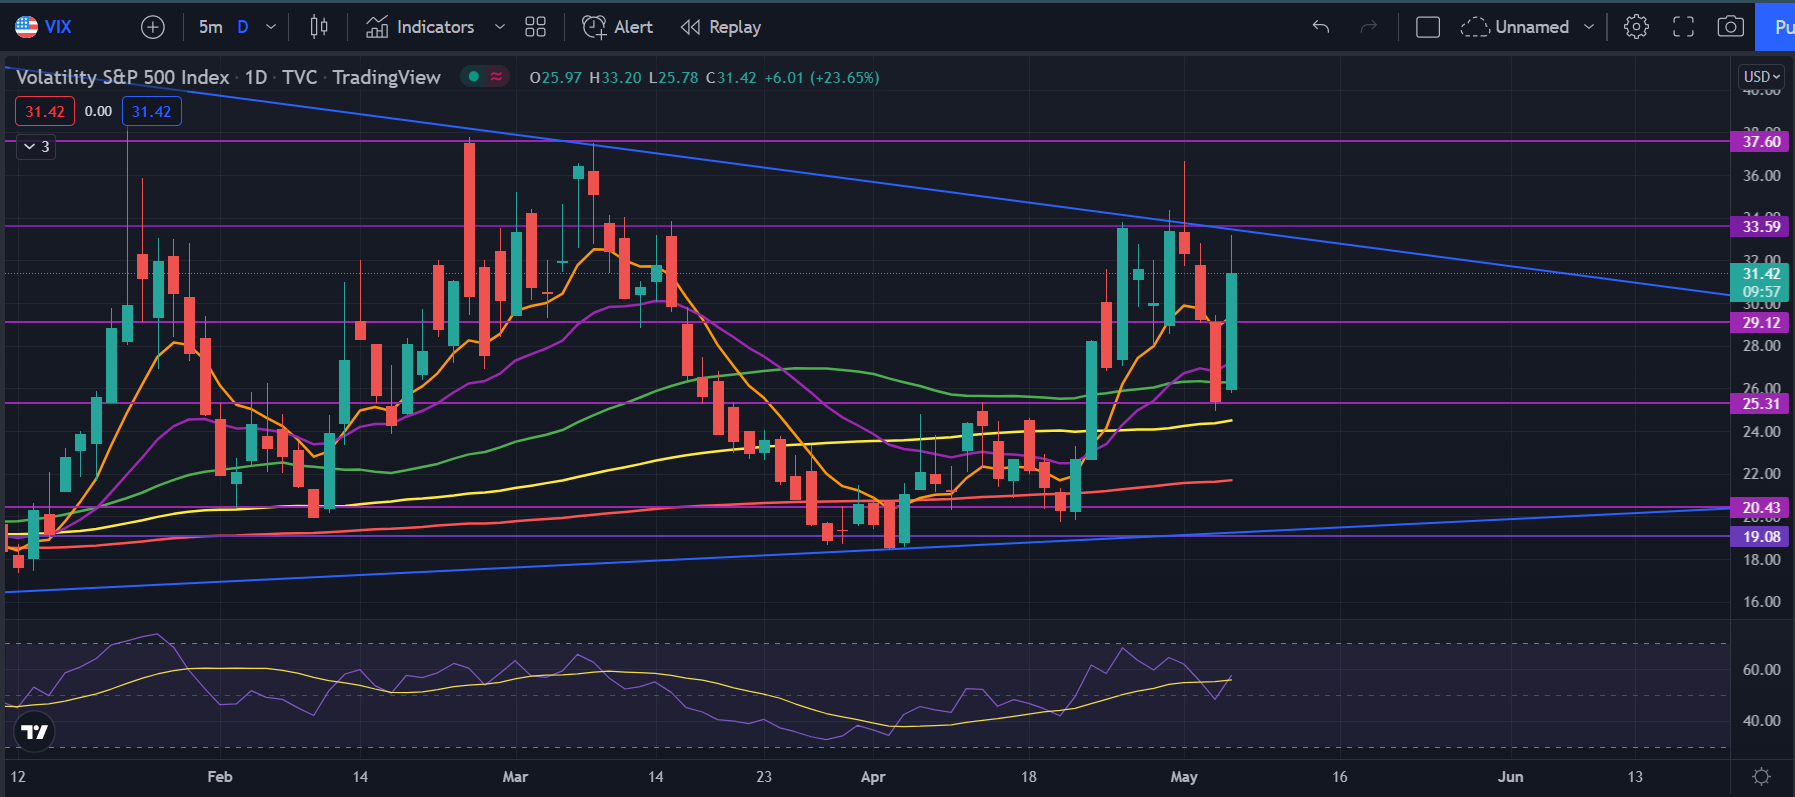
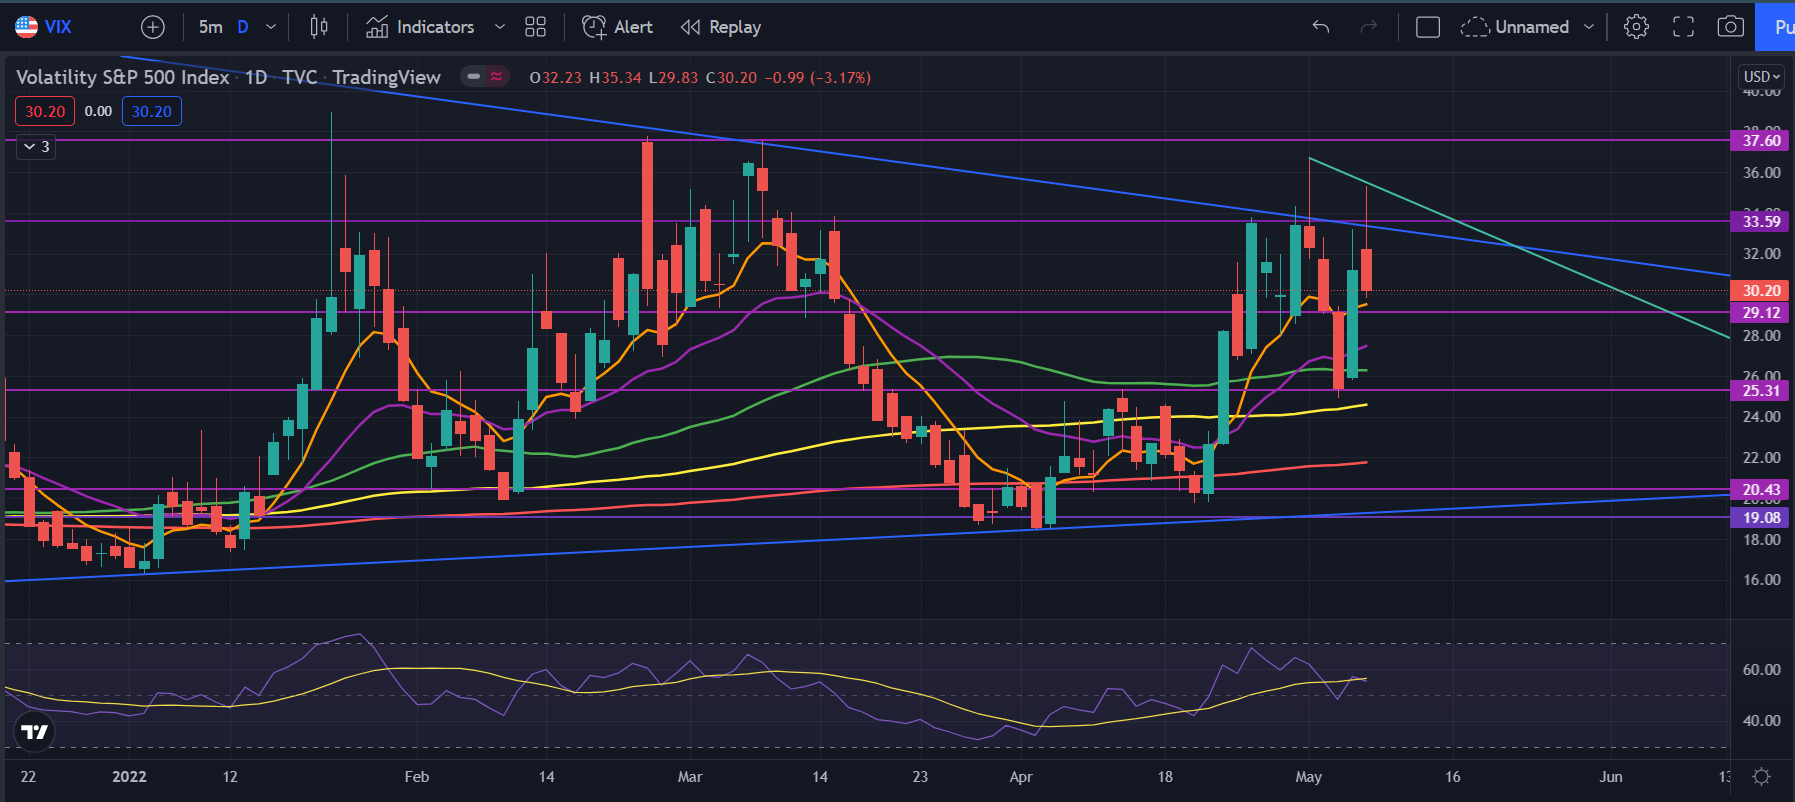
The VIX is following the downtrend line very well. Bounced off of it again and possibly showing the bottom here for a bit. We might get a relief rally tomorrow again looking at the VIX, but it can always just break out and make a new trend.

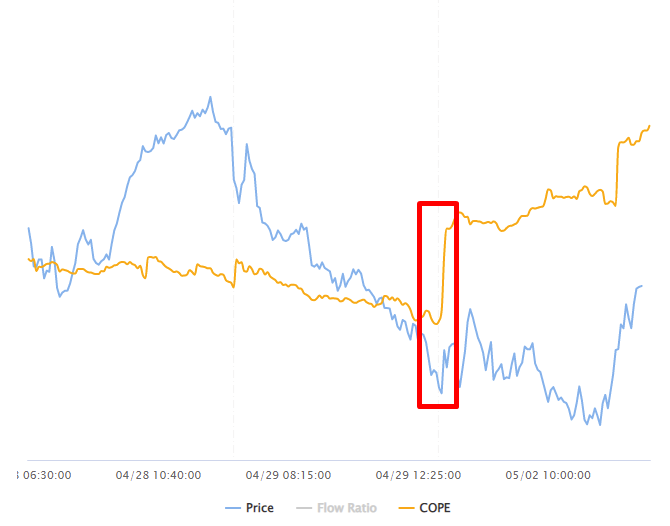
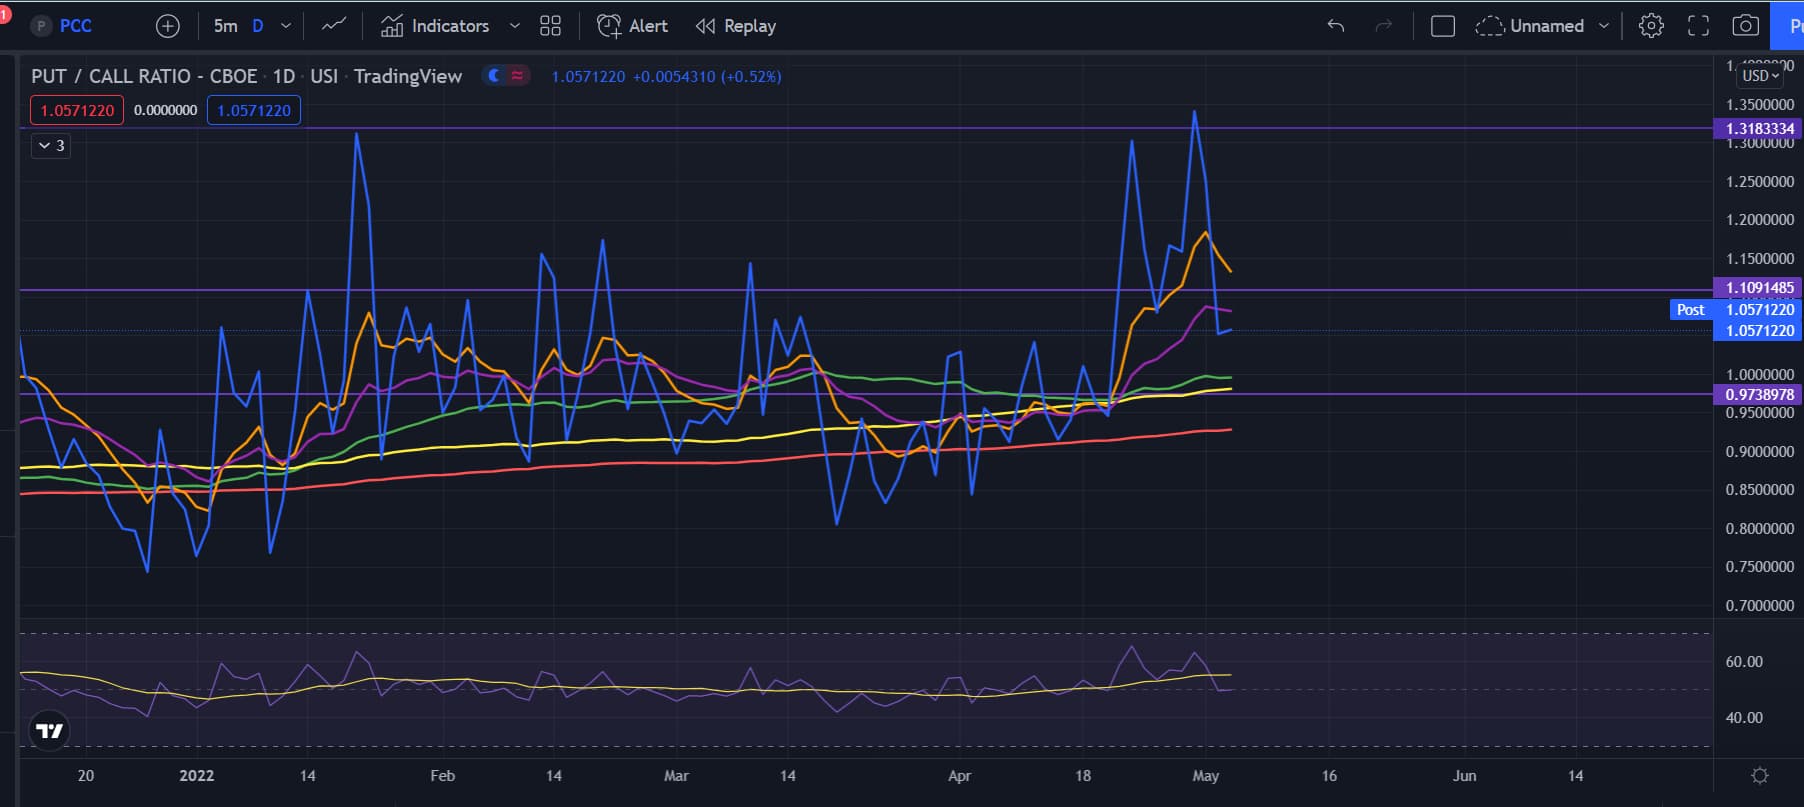
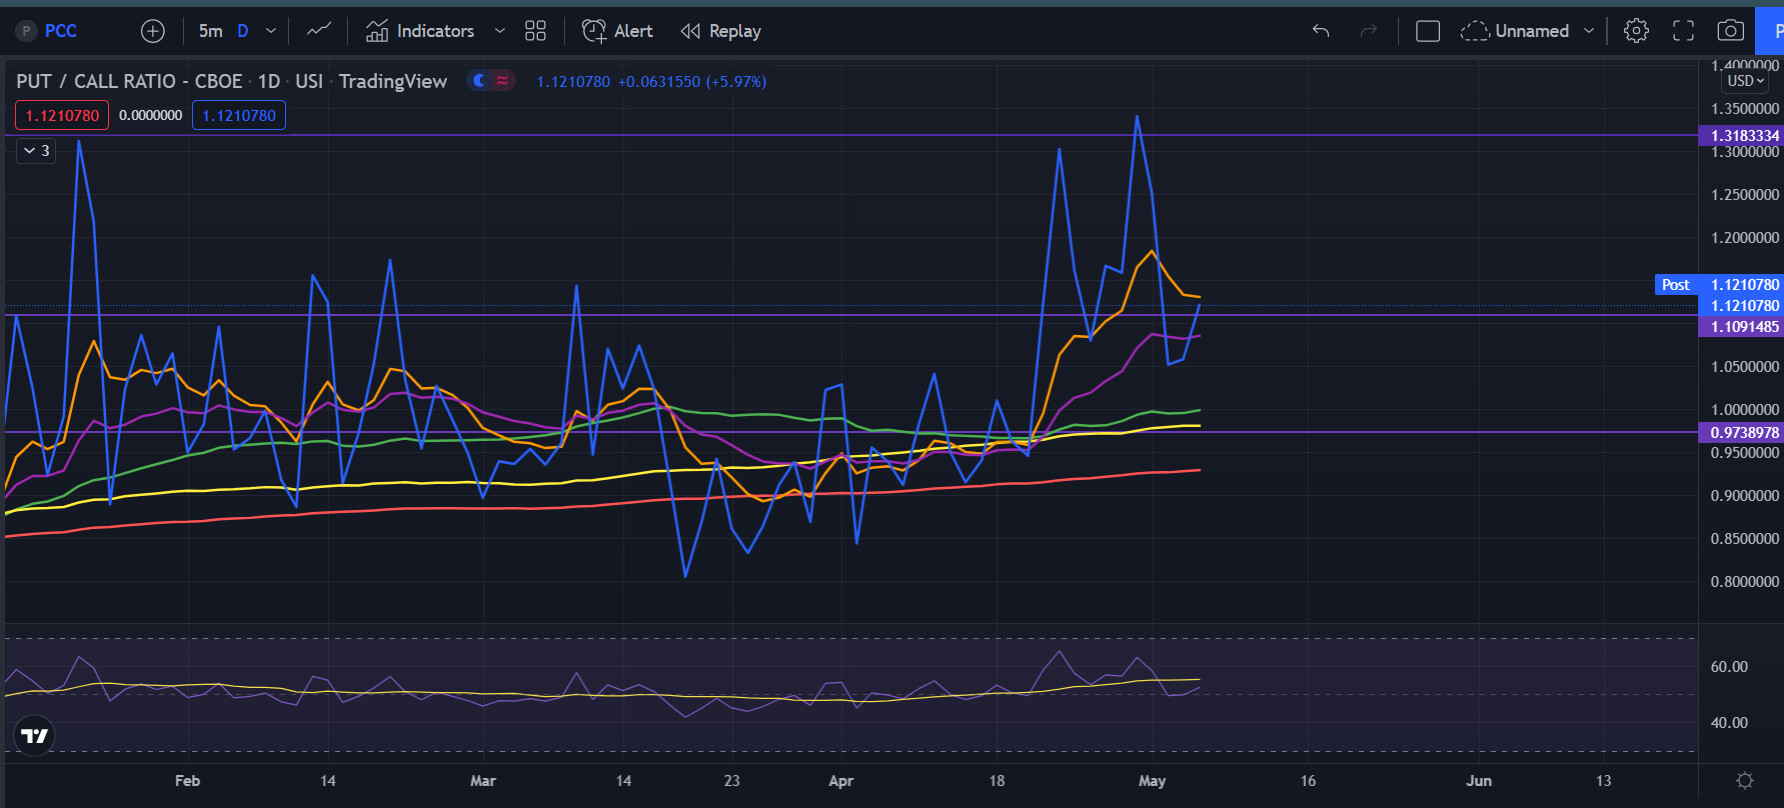
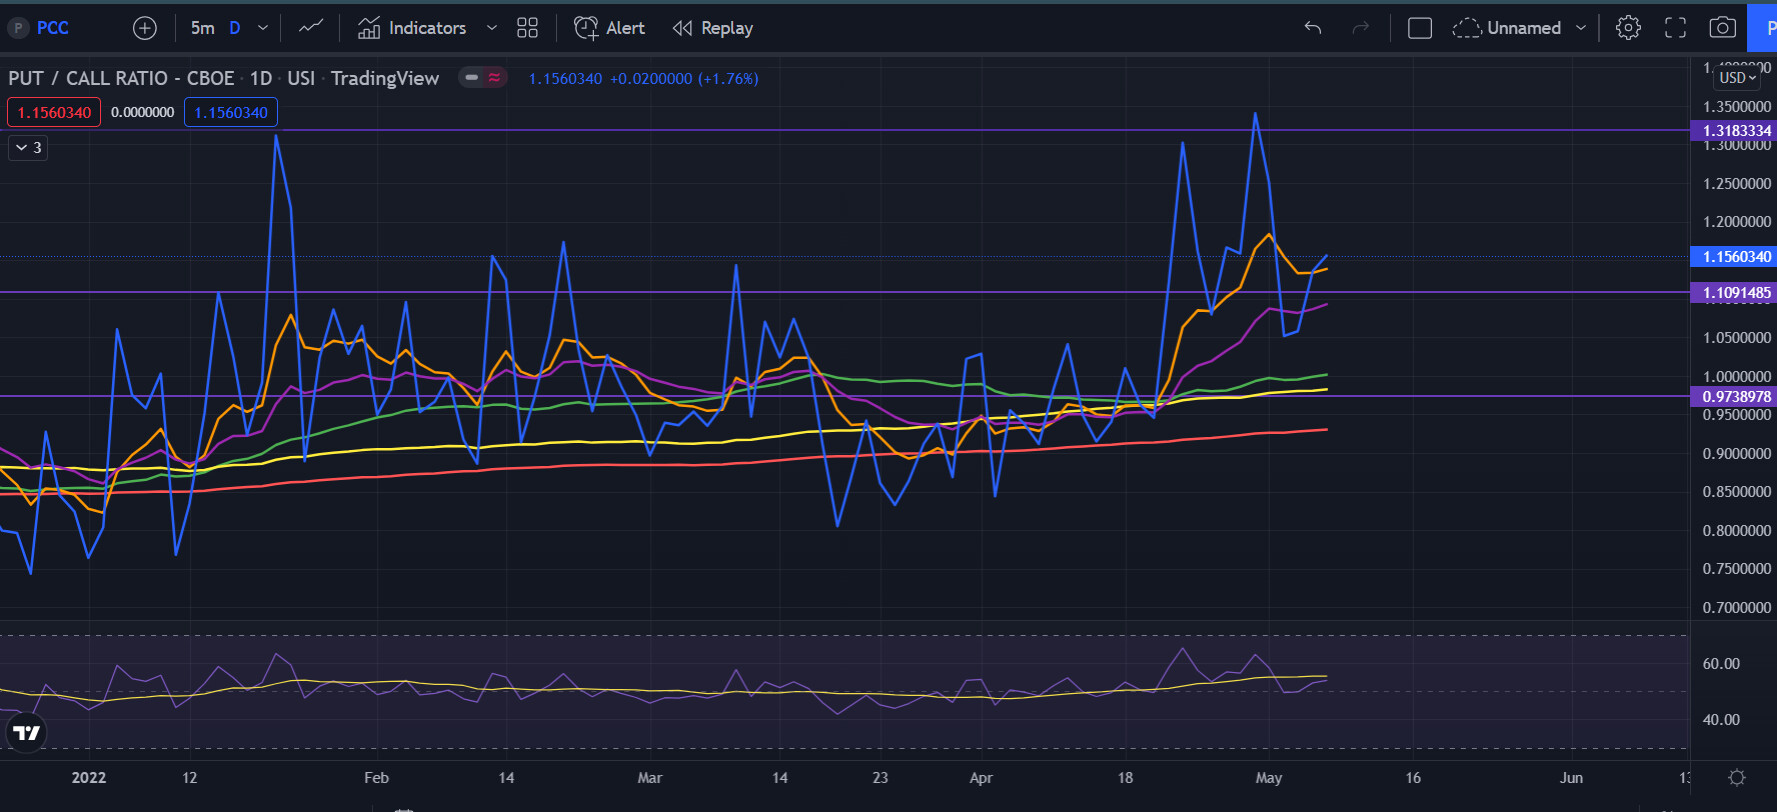
Put call ratio is also hella elevated and last time it was this high, it showed the bottom the next day. So maybe on Monday we make a new low and then rally for a bit. Who knows. But this level of puts in the market typically means that a local bottom is soon.

Overall, there is no reason to be bullish longer term right now. It’s sell all rips, but you have to time those. Don’t just fomo into puts. Markets rarely go straight up or down. Look for signs of local bottoms and tops and play the trend and look for confirmations. Right now, I think we’re near a bottom to bounce off of, but with this market, who knows. I personally think that we rally after fomc like the last time because we’ll have confirmation of the direction, but we’ll see

4 Likes

Liked, commented, and subscribed!

3 Likes

TLDR: I don’t really see this as the start of the rally because there was no reason to bounce here based on news or changes in the macro environment. Most likely just a bounce at a strong support and I don’t see a rally until the fed stuff is over on Wednesday.

SPY on the 1 hour showed bullish divergence for a bit and it played out today. We broke past the 8 EMA that we rode down and now at the 21 EMA. We could bounce down there here like we did today in the morning. Right now, SPY is still looking bearish on the 1 hour and I want to see us closing over the 21 EMA and then the 50 MA (green) if I want to be convinced that this is a start of a reversal.

SPY on the daily looks like a hammer candle. Doesn’t mean that tomorrow will be green because we did seea hammer a few days ago and then saw it die the next day. We were also pretty far from the EMAs so this might be a reversal to the EMA like last week. If this is the case, I see us testing 420 tomorrow.

VIX closed back under the trendline after looking like it broke past. If we do continue this trend down, we might get another green day tomorrow. Overall, VIX is still at an uptrend and this might just be cooling off before going higher and the markets going lower.

Put call ratio showing that there are less puts in the market or maybe more calls, who knows. But this might be signaling a local bottom again. The bond market was also down today, showing that this pump was probably not real and most likely we’re not going into a real reversal soon.

Overall, I’m doubtful of this pump, but I won’t play puts until I see a confirmed reversal. I see us bouncing around until the rate hike announcement when we go have an impulsive rally after some confirmation. This bounce seemed more short positions closing rather than actual bullish momentum buying. Looking at the retail stocks like GME and AMC, they didn’t pump as hard as the indices, if the sentiment was really back to bullish, I would expect the retail stocks to do as well as the indices, but they didn’t so I’m skeptical. I’ll continue to scalp until I see confirmation of a trend after Wednesday. Be careful with any long positions because this bear market rally could take us to retest the downtrend line we formed which would be like the 430-440 range.

3 Likes

I agree – I also think that today’s upward move was based on some mixture of technical bounce, and shorts covering + puts closing prior to FOMC. That being said, if this is the truly the reason, then tomorrow should also see another upward rally to this effect.

Idk tho. Stocks go →

2 Likes

Cantor Fitzgerald calling for short term 7% rally in may off Fed meeting. We’re extremely oversold.

I agree with this. This move down was way too extreme just based on the rate hikes and inflation going up slightly higher. I disagree that the fed will be more dovish tho, I think they’ll continue to say 50bp hike and continue to monitor in the future, which would be going against what people are expecting. Everyone is expecting the fed to come out and admit to their mistake and be like “yuh inflation is high so it’s 75-100bp rate hike each time.” I think this “dovishness” will cause a short term rally, but until peak inflation, no real bull market.

1 Like

Also since I have time now, I’m going to look back when peak inflation was seen and how the market reacted.

Here is the inflation chart. I’m going to look at peak inflation times since 2001 because I’m not going back to 1960’s. Fuck you.

First peak we see is in the first quarter of 2001 which would be around end of March 2001.

After peak inflation came in, we saw a 22% rally before going down even more into a recession and the shitters. Maybe we were already in a recession before the rally, but right now, peak inflation shows a shitter soon.

The next peak inflation I’m going to look at is Q3 of 2005.

At peak inflation reading, we saw a continued dip and then a 10% rally before a continued bull rally and then the next peak inflation reading in Q3 2008.

That peak inflation reading showed a 36% drop in the markets before starting a new bull run. The next peak inflation reading I’ll look at is the Q2 of 2011 because it’s a high reading too before a drop.

This shows a 8% pump before a huge drop.

So far, peak inflation actually shows a pump before a drop, except for 2008. I actually think that we’re in a 2008 situation where we probably won’t get a huge pump. This bull market si artificial anyways and has to pop hard. I was bullish for peak inflation, but after looking deeper, I’m actually more bearish. I don’t really see a new ATH forming and I think I’m leaning more into a lower high before a big capitulation which is going to be soon.

6 Likes

Dude, your charts are way cleaner now. I love it. No homo bozo.

2 Likes

I agree.

This is also the first time we’re getting a double whammy of aggressive rate hike plus quantitative tightening which were not the economic conditions of past situations.

2 Likes

Good stuff. This aligns with the thesis about a short term rally, with more downside after. I see 4600 as the upside range for any type of rally. Let’s see how this week plays out.

2 Likes

[size=4]COPE Unusual Whales Analysis[/size]

COPE, or the Cumulative Options Premium Effect, measures the total weight of options premium.

Basically, positive COPE = net bullish options premiums, and negative COPE is the opposite.

Blue = Stock Price
Orange = COPE

Also the chart sucks because it has no Y axis for COPE… I have to mouse over it to get the value.

[size=4]QQQ[/size]

Boxed in red is today’s market open, where COPE went from negative the days before into positive at open today and for the rest of the day. This does kinda lead me to believe that today’s price action may have been driven by options trading, i.e. closing puts → dehedging → rally.

We can see a big spike in COPE precede the day’s initial price spike, and then it got sold off. Options continued to build in the positive direction and eventually led to the power hour rally.

This options activity aligns with the following summary indicating a substantial amount of put premium combined with majority bullish tag, i.e. selling/closing puts.

[size=4]SPY[/size]

However, SPY’s COPE chart looks very different and I’m confused by it. COPE stayed negative today until about half an hour before market close in the middle of power hour. It could be that the price action is more driven by SPX instead, which makes sense since those flows are much larger in size. Unfortunately, UW doesn’t have a COPE chart for SPX.

SPY’s flow summary also shows large put premiums (which has been the case every day) but bull vs bear is about 50/50. Typically it leans bearish, again indicating that today had more puts closing than usual.

3 Likes

My current economic calendar TL;DR

May 3 - JOLTs Job Openings. Expect: 11.2M.
May 4 - FOMC
May 6 - Unemployment report. Expect: Go from 3.6% to 3.5%. Expect: 0.4% month over month or 4.8% annualized wage growth
May 9 - Victory Day
May 11 - CPI. Expect: 0.2% month over month. 0.4% excluding food and energy.
May 12 - PPI

1 Like

This fellow on TWTR points to coupons as the reason for bounce, and says Buy in May and go away, as of 3pm ET today. I don’t quite understand the macro with treasuries and everything, but the way someone explained it was in essence the net liquidity drain will be less than the market is/has been pricing in from QT because it is offset by fewer treasuries being sold.

This came out at 3.00 et today, and I thought it was interesting so I saved it for now, and I’m not holding puts, but still holding on to some 435c for Friday that I’m planning to cut by FOMC. I don’t know if this is the news that could bounce the markets, but it seems FOMC is known at this point…unless its like the “surprise” raise in Australia…but our Fed has been super communicative, and there shouldn’t be any surprises. I do know that its hard to be bullish in what feels like a bear market, even if we havent hit the magic 20% mark yet, and even harder to be a bull with the QT being the new norm.

https://twitter.com/dampedspring/status/1521225074833035271?s=20&t=tkg7nrK-RTC7f1qblcyB5g

Edit - Department of Treasury links at the top of the page, are the documents that were released at 3pm on Monday Most Recent Quarterly Refunding Documents | U.S. Department of the Treasury

2 Likes

TLDR: I think we’re gonna go mostly sideways into the fed meeting and then we’ll see the real direction. My bet is up after confirmation and less uncertainty and I don’t think that the fed will toss any more hawkish stuff this time because the markets are already beat down so much and they wouldn’t want it to go much lower for now.

SPY on the 1 hour is looking bullish. Held up the 8 EMA well and kept bouncing above even when we broke under. Also the RSI is continuously above the MA, showing strength in this move up. It does look like we were bouncing below the 50 MA (green) so I would like to see us breaking above that tomorrow, although I think the markets will be mostly flat up until the fed meeting, or down hard idk.

SPY on the daily is clearly still in a downtrend, but showing some strength. Looking at the volume, it was ridiculously low, showing that this move up isn’t really with conviction. But it could also just be because FOMC is tomorrow and many are just waiting until then. Overall, it does look like we’ll return to the 8 EMA average at around 421. But whether we’ll bounce down or break through will remain up to the fed’s comments.

The VIX downtrend line has held up nicely and showed the bottom on the markets. VIX broke under the 8 EMA, and we could be heading into a bear market rally based on the VIX. Calls short term looks like the move as the VIX is looking weak, but it can always bounce back above to the downtrend line.

Put call ratio went down heavy and it does seem like we saw the bottom, but it’s still scary to get into longer dated calls with the macro conditions. Another thing to note is that the bond market was down today after gapping up, showing that this rally might not be sustained longer term.

Market today was very volatile, looking trapped within a range most of the trading session. But looking at the open and close, it was pretty flat. I think it’ll be more of the same tomorrow leading up to the fed. I think SPY will remain trapped within a range and then we’ll bust out. Imo I think a strangle or a straddle or whatever the hell you call it before the fed press will be the move. Even during the last time, SPY took a huge shitter before rallying all of the loss back and more within 30 minutes or something. Overall, still just a scalping time and probably getting into longer positions starting Thursday. I’m not saying Wednesday after fed because I assume that it’ll still be pretty damn volatile after the meeting.

1 Like

TLDR: I expect a little pullback at open tomorrow for a better entry for calls before we continue to have a rally.

Looking at SPY 1 hour, we just green dildoed past every resistance. Just balls out dicks out shrek green. RSI on the overbought area so be careful entering right at open. The 8 and 21 EMA are crossed over bullishly and looking strong. I expect a pullback to the 8 EMA on the 1 hour before a continued run.

On the daily, we reached up to the 21 EMA and to the bull channel line. Breaking above this will be very bullish and if we do break above, I expect us to test the yellow downtrend line which would get us to around the 440 area. I do expect us to fail, but I also wouldn’t be surprised if we broke past since it looks like the 75bp that everyone was scared about is now gone.

VIX just died today. It’s nearing the bullish territory at the 24-25 area. One thing to note is that there is a strong upwards trendline (blue). When VIX does reach that low, it might be smarter to get out of calls and either wait for confirmation of a breakdown or start a put position.

Strangely enough the put call ratio didn’t change much today. Maybe showing that we’re nowhere close to the top of this run yet since we’re not heavily leaned towards calls.

The last FOMC meeting was on 3/16. We went from 430 to 460. At open after 3/16, we did see a quick pump before a dump to return to the 8 EMA. I suspect that a similar thing will happen again where we ride the 8 EMA up to 440 to make a lower high and return to the downtrend or pullback before starting a bull run.

Overall, I would wait at open to enter longer call positions because I do think there will be a better opportunity. Right now, I am still kinda bearish longer term, but I am bullish short term. Play both sides and don’t be so overleveraged to one side or be so biased that you keep saying we can’t keep going up/down and blow up your account.

5 Likes

TLDR: I think we see a reversal soon on SPY. It might start tomorrow or next week, but I’m personally going to start a call position here. Also yes I’m a bear longer term, but I don’t think put entries right now have good risk/reward.

SPY on the 1 hour faked us out again and died. After the first knife, we kinda just bounced around within a range though. It seems like 410 is a strong support and we’re looking to bounce. RSI is slightly going up showing some bullishness. We are almost back at the 8 EMA so it’ll be interesting to see if we manage to break past it at open tomorrow or take a shitter.

SPY on the daily is extremely bearish. An engulfing bearish candle and shit. One thing to note is that the RSI is still showing a bullish divergence as it’s not making lower lows. Another sign of a bull run incumming. Volume was also big today so it’s not like it’s confirmed. If we do have a reversal, I expect a return to the 8 EMA which would be around the 421 range.

VIX is the reason why I’m mainly looking at a reversal. The downtrend line held up today as well as we bounced right off and saw the bounce from 410 to 413.5 in 3 mins on SPY. It’s called the bottom each time and I’m going to bet on the same thing. We might get the same thing as last time where we overshoot hella and then correct back on the same day. But I’m willing to bet on a bullish reversal.

Looking at the put call ratio, the amount of puts in the market hasn’t been increased that much. That either means people aren’t convinced in this move down or taking profits on the puts or maybe more calls. Either way, the lack of a huge put increase to me is bullish.

Overall, I expect good week out call entries for SPY which I am willing to bet on. I do think we’ll make a lower high than 430 this time and continue the downtrend and fill the gap at 400, but timing the put entries is still important. That’s all for today and let’s get ready for a bear extermination session tomorrow before I come back tomorrow and act like I was never bullish.

3 Likes

This model is what we have been going with on my end for the last week and a half.
Only looking at the front half dump after a late May triple top. Also coupled with a mid June FOMC possible .75 IR correction statement from JPOW.

History never repeats itself but it does rhyme. Looking for a 405 double bottom confirmation bounce from May 2nd. Hopium trade up through the channel after puts are sold off tomorrow. Maximum upside around 425 tomorrow.

5/5 eod. Blue is 360 moving median and pink is 120 moving median. We should double bounce underneath the 360 tomorrow and move up to sit on the pink at 437 and maybe that is the peak

437 also happens to be delta neutral for current oi so that would be cool

1 Like

I’m with you 100 on this one. Yesterday didn’t make new yearly lows despite the insane move down. We did a 90dvol day. Finally 1.x bb dp print on qqq eod yesterday. In this market, you can be sure big money is going to play extremes. In this case, especially with the overall high put vol, I’m think today they crush puts. Will be playing a handful of cherry picked call lottos. Assuming we don’t crush down I’ll flip EOD for some choice weeklies next week

TLDR: I’m still leaning towards a pump to a lower high next week, although I think after we make the lower high, we’re going to go fill the gap at 400 on SPY.

SPY on Friday was flat considering the open and close. We tested the 21 EMA twice and failed both times and then held the 406 and 410 supports pretty well. We’re still riding along the 8 EMA although it’s not negatively sloping anymore and flattening. This is a sign of a reversal incoming, although with sentiment being at basically all time lows, this can just not matter and lead to a harsher selloff soon. Looking at the RSI, we can see that the RSI remains above the MA even with all the knives. This is bullish as we’re showing that the momentum downwards is weakening and the selloffs are “less strong.”

On the daily, we formed a doji, showing indecision in the markets. I assume that Monday will have an explosive move to one side so maybe it’s best to wait 30 minutes or so to see the trend and ride it. The RSI is still showing a bullish divergence as we’re back at the same level as couple days ago, but the RSI is higher. Right now, I’m looking at Monday to go to 418-419 to test the 8 EMA and then if we break past, a test at 426-427 to test the 21 EMA. I think we fail there and then go back into the downtrend, but if we do break the 21 EMA, I expect to test the downtrend line from 460-450 to now 440.

Looking at VIX, it said the “bottom” again at the downtrend line. VIX is showing bullishness as it’s bounced down hard and was hard on a red day on SPY. I think fear is leaving the markets again and we’re going to see a short term reversal. Maybe when VIX hits 27ish will mark the top, but we’ll see. VIX getting crushed on a day where it was red and flat shows bullishness to me.

PCC went up again and I’m thinking that we’re going to see an uptrend soon because of the amount of puts still entering the market and causing some put walls. There were 68k OI on 405p this Friday and SPY bounced off of that put wall hard. I expect the same soon and expect puts to be crushed.

Looking at other markets like the Nasdaq, it’s looking very bearish for tech. The 10 year yield is now above 3% and has no signs of slowing down. Nasdaq also broke below the supports it formed this week and looking to go lower. Again though, RSI is showing a bullish divergence and maybe showing a reversal coming soon.

Dow has been the strongest market so far. It hasn’t made a lower low since March and not even retesting that level. Again, showing bullish divergence and some bottom wicks. Might be showing an uptrend soon.

Overall, markets are looking grim, but there are signs that a reversal may be incoming soon. I am going to go back into calls and hold this time instead of cutting way too early. This reversal play is a gamble and you shouldn’t yolo into it. I’m only gonna drop $60 into a call. Also, don’t buy puts because SPY can’t go higher or calls because SPY can’t go lower. Just play the damn trend and look the at the price action instead of going by feelings. Longer term, SPY is will make lower lows in my opinion and hit 380-390 for a double correction, but I don’t think a crash is coming. I don’t think that the fed will lead us into a recession, they’d rather let inflation go more wild before causing a recession. Be careful and enjoy the weekend retards.

1 Like

Looking at the futures being down over a percent now, I’m going to assume that we have another flush into the CPI data and all.

Looking at the fib retracement on the weekly from the Covid crash, we can see that the 0.382 pullback would get us to 380. This is also the level of the head and shoulder pattern predicted. I’m going to guess we go there sooner than later now. For now, I’m going to look at some price targets. It’s looking like we open below 405 so I’m going to guess we flush to 400 and fill the gap there.

We’re in a downward channel kinda. Looking at the downward pressure, I’m going to guess that we drop to like 390-395 before a bounce off the channel. The downward line is kinda wacky though, so I wouldn’t put too much consideration into that price target. I’m still expecting a bear market rally soon, maybe at 400 when we fill the gap. But overall, I’m going to revise my thesis and expect no rally until a bit lower.

5 Likes