I agree, short-term, the bottom is in. I think there is a potential for a multi-day rally, and I’ll try to explain as best I can as to why. TL;DR 380 is impossible ![]()
Oversold Territory:
I love that you are using the PCC to gauge bottoms (insert “Swole is a bottom” joke here). I think there’s a few more indicators, both technical and macro, that can corroborate your thesis that we could be in for a Bear Market Rally.
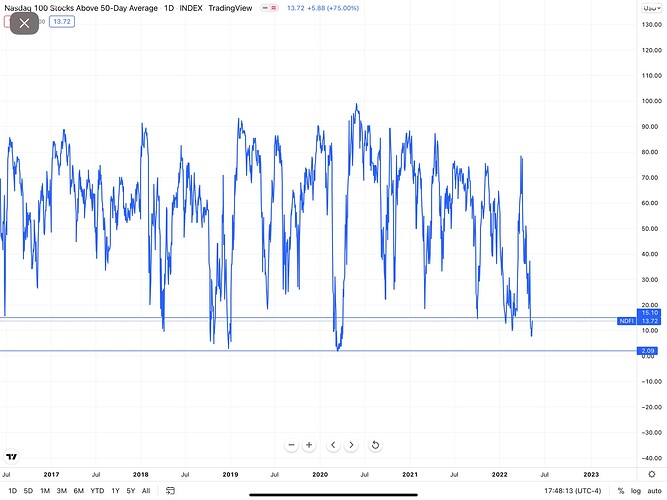
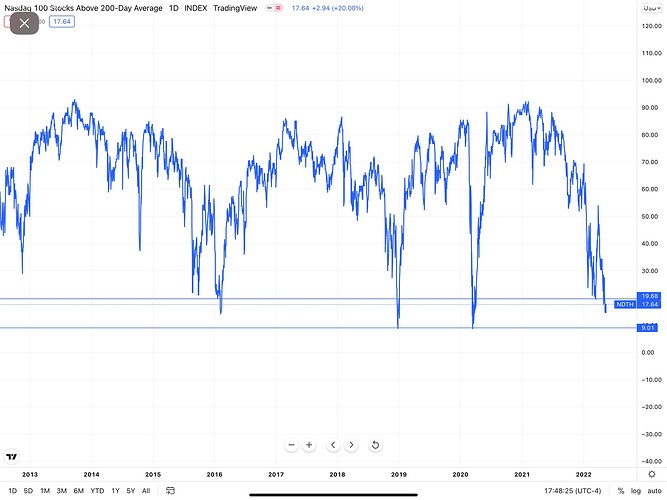
This is a picture of the total number of NASDAQ 100 Companies above their 50-Day Moving Averages. We are currently reaching levels we’ve only been in during March 2020, 2018 Taper Tantrum, 2016 Global Growth Scare, 2011 Bear Market, etc. Buy the fear, sell the greed? If you look at NASDAQ 100 Companies above their 200-Day Moving Averages, it tells the same story.
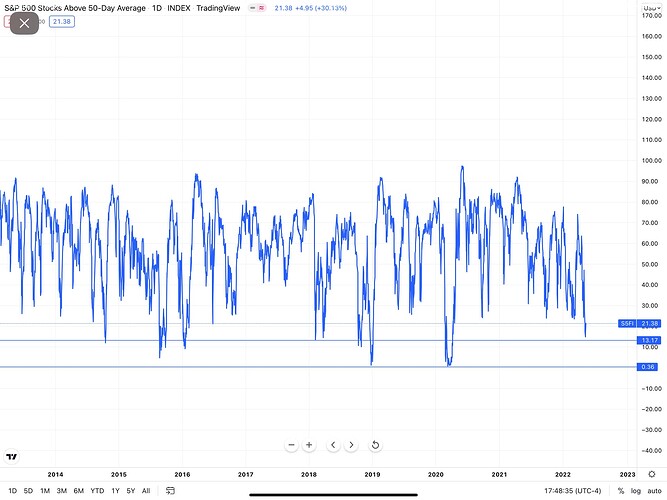
Now, let’s look at the S&P 500 companies above their 50-Day Moving Averages.
Not as oversold, and to be honest, this is expected. All of tech was the most crowded trade for 2020/2021, which inflated most stocks in the NASDAQ (just look at ARKK bubble). However, I do think there is minimal downside from here in the short-term (still need more data to call a long-term bottom).
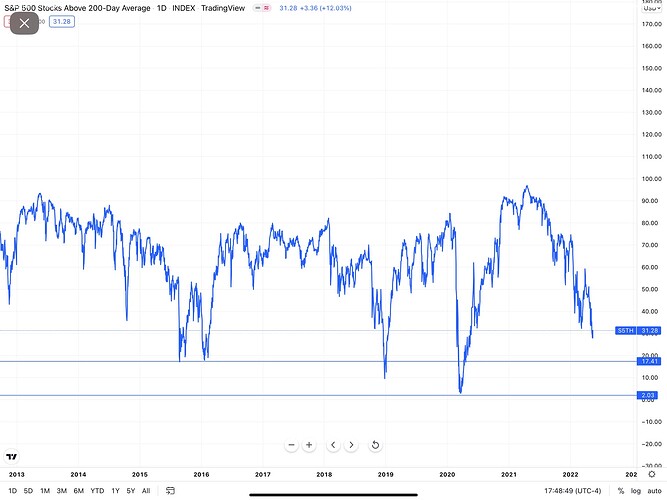
Looking at S&P 500 Companies above their 200-Day Moving Averages, this seems to indicate that there is some potential for more downside, however if the oversold NASDAQ stocks start rallying (which they have starting with yesterdays short-covering) then there will be correlation with the rest of the market.
Peak Inflation?
Another thing that is fueling this market rally is inflation expectations.
https://www.reuters.com/markets/us/inflation-views-tilt-feds-way-bit-2022-05-13/
Today’s Philly Fed Survey showed that inflation expectations dropped to 3% or less while the unemployment rate expectations ticked up from 3.6% to 3.8%, which could help with the “tight” labor market the Feds are nervous about. This Fed survey fueled a rally in the Bond markets, bringing government bond yields lower, and fueling the stock market rally.
5Y5Y Inflation expectations, which take into account nominal and real interest rates, also show signs of peaking, alongside both 5-year and 10-year inflation breakeven rates.
What to Watch
Fed Talk:
Now, most Fed participants support two back-to-back 50 rate hikes for the June and July meetings, but September will be an important month, as Mester suggested today that inflation could show signs of peaking by then. Powell also said they want to see months of data before calling the peak, supporting this thesis. When Mester suggested September may be the key month on whether to slow down rate hikes, the stock market reacted to the upside. However, Mester also said 75 bps raises are still on the table if the data points to more inflation on the horizon.
Also, as Swole mentioned, Powell being clear and certain about policy going forward could fuel confidence in the Fed and their abilities to fight inflation, which could in turn fuel more rallies.
Bonds/ Credit Spreads:
Bonds drive equities. Why? Because the more expensive debt gets, the less equity a company has. The less equity a company has, the lower the stock price (very simple explanation but it’s 11 PM and I have work tomorrow leave me alone).
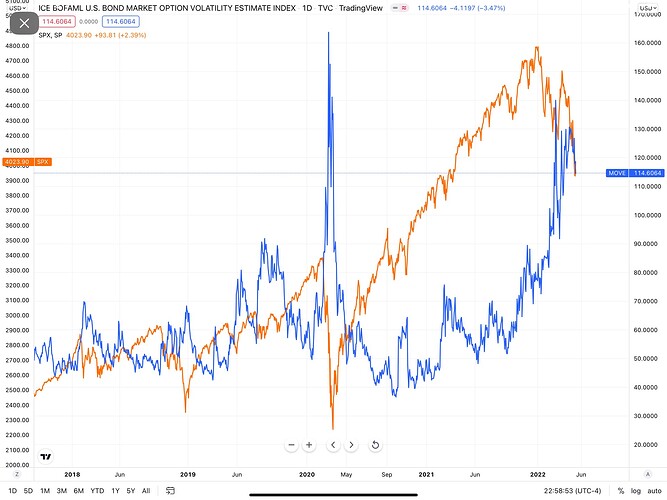
Monitoring volatility in both the Bond and Equity market could give you more indicators as to where stocks will move in the short-term. Here, you can see the MOVE, the VIX of the Bond market, compared to SPX. Usually, they are inversely correlated, much like the VIX and SPX. H2 of 2021 saw a bearish divergence when the MOVE and SPX started moving in the same direction. This started roughly around the time the Fed started becoming hawkish and mentioning Tapering, QT, and Rate Hikes (November-December). The Bond market, or smart money, is useful to follow alongside equities.
Credit spreads are also useful to follow as they mark risk-on/risk-off environments.
Here, you can see US High Yield spreads and their correlation to the VIX. The short version of why they’re correlated is roughly the same reason as to why the Bond Market drives the stock market. The higher the spread, the more expensive the borrowing cost for the company, which usually indicates more risk (need higher yields to incentivize investors to take on more risk).
BBB US Corporate Spreads Vs VIX
US Corporate Spreads Vs VIX
Peak Inflation, as mentioned previously, could also lead to rallies in the Bond markets, driving yields lower and fueling stock market rallies.
https://www.reuters.com/markets/europe/four-reasons-why-bond-market-rout-may-be-over-2022-05-13/
Other Macro Indicator Stuff
U-Mich Consumer Sentiment wasn’t great. It’s usually a leading indicator of the overall economy, and while the stock market doesn’t equal the economy, you wouldn’t be wrong in saying investors are overly cautious of any macro news pointing to shittier times to come. Consumer spending is a big portion of GDP and high Consumer Sentiment is needed in order to have high consumer spending (Retail Sales numbers coming out next Tuesday btw).
Chart Anal
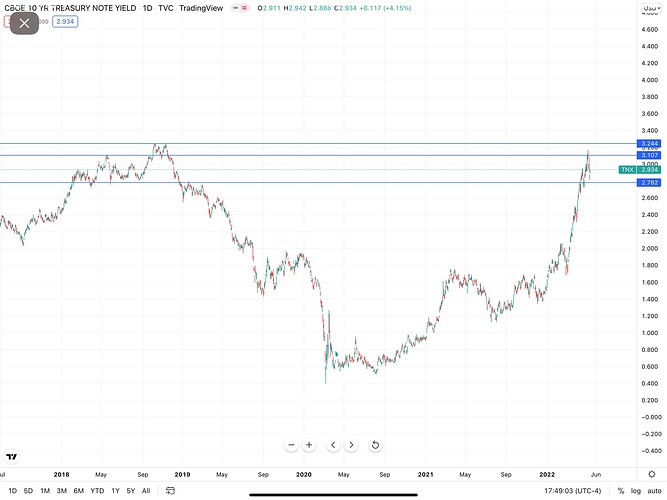
Firstly, I would love to see the 10-Yr stay below 3%, like you mentioned. That could bump investors’ confidence to enter the markets again, bringing in more cash from the sidelines into stocks.
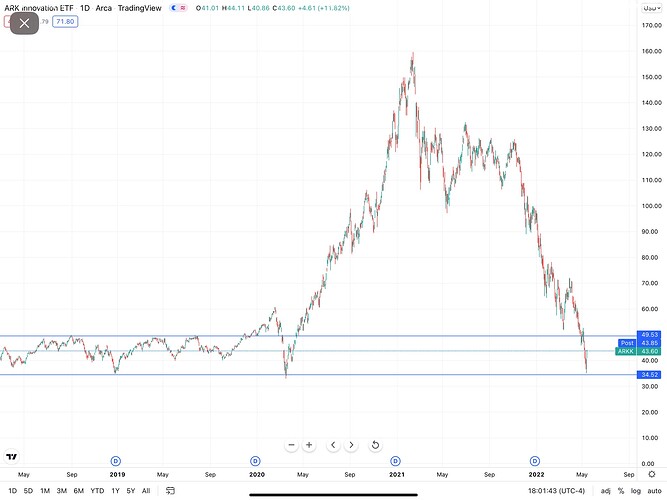
What I would also love to see, in terms of a short-term bounce, is ARKK get above it’s historical resistance of around $50 and close above in order to convincingly say that risk-on is back again in the short-term.
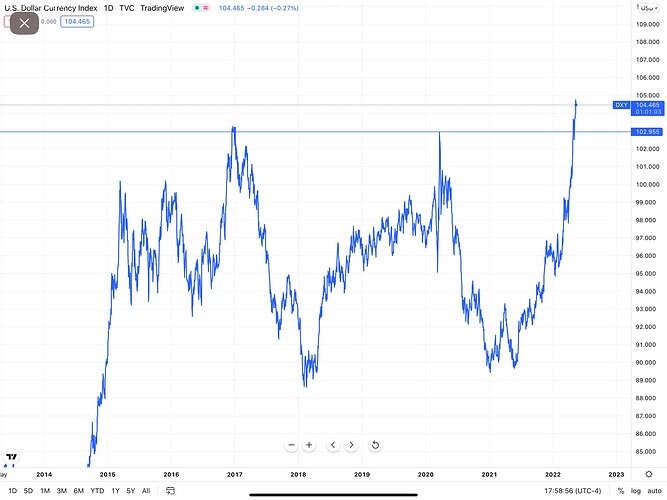
Last thing I would love to see is the Dollar start showing signs of weakness. Currently, it’s still making 20-year highs, which is not good for stocks. Why? Because a strong dollar leads to less profits coming in from abroad for international companies.
K Bye
