Here are my thoughts on SPY in the coming weeks. I wanted to create another thread so I didn’t step on @BONER … Please let me know where I am wrong. I’m trying to learn.
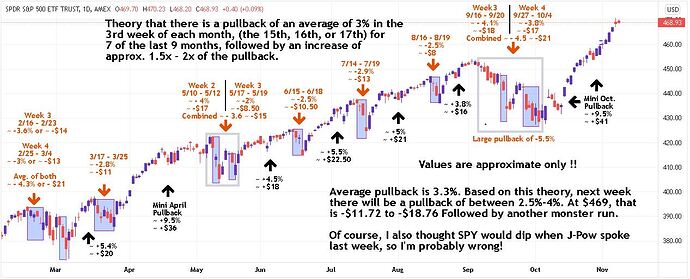
In 7 of the last 9 months, there was a pullback in approx. the 3rd week of the month (generally around the 15th, 16th, or 17th) of an average of 3.3%, and lasted for approx. 3 -4 days.
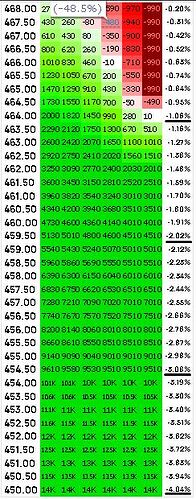
Using this theory, the pullback will be next week and end (at the latest) 11/22. Using today’s closing price, buying 10 - $465 puts (because they were $99) with an expiry of 11/12… so for $990 the payout would be the following for a dip of 1%, 2%, 3% and 4%…
When the dip is over, the average run up was 6%. Using today’s price ($469), a dip of 3.3% (-$15.47, $453.53), and the average run up of 6% would give us +$27.21 for a price of $480.74.
I’m not saying I’m correct, nor am I telling anyone to jump in. I just saw what looked like a pattern and I wanted to share it. Good luck and God Speed!
3 Likes
It’s a reasonable observation. I’ve done analysis on SPY past history before and there is slight evidence of a 21 trading day pattern (approx 21 trading days between monthly options expiry, plus the media likes to hype how a month has ended and a new one is beginning, so no big surprise there). It isn’t always super strong, sometimes it seems to manifest as either an amplifier of something macro, or a blunting of something macro, but there is a little bit of signal there. It can be easy to overplay your hand with it, but doesn’t hurt to have it in the back of your mind.
6 Likes
Updating…The dip may come early, but the data shows some red days, then a few green in the days prior to the larger dip. Still waiting to see how much (recent) history repeats itself.
These types of drops are highly correlated to FOMC minutes releases and FED speeches.
Oh…OK… So that happens every month essentially? I did not know that. Thank you.
Still trying to learn, so I appreciate any input.

