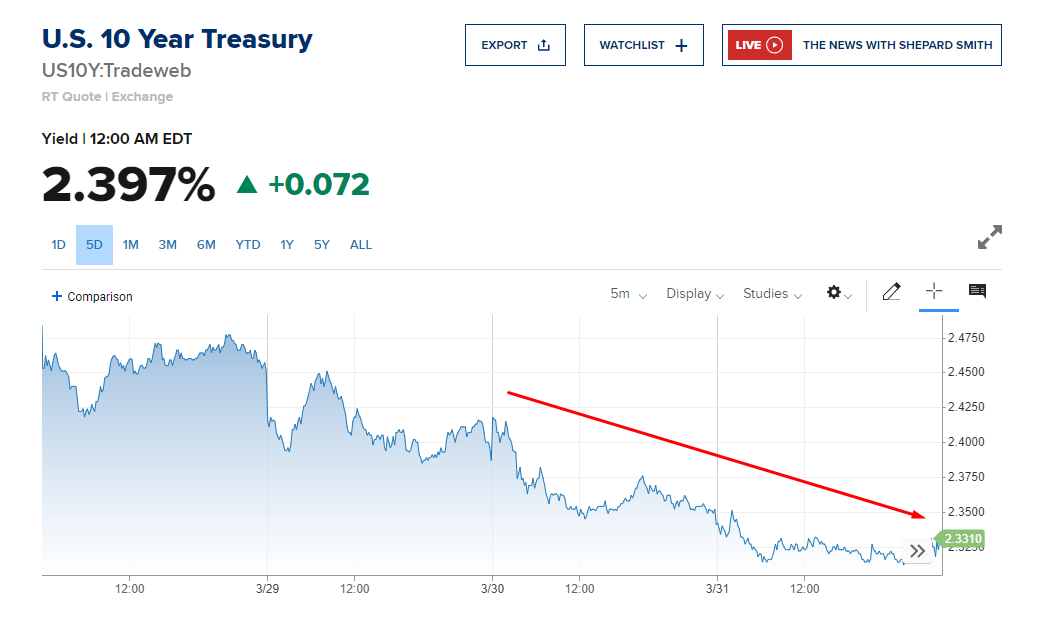
This is a look at the idea that today’s sell-off on zero news was caused by a quarterly rebalancing of funds. What I mean by this is that if a fund is supposed to maintain 80% stocks and 20% bonds for example, and stocks outperformed that quarter, then they would rebalance by selling stocks and buying bonds to restore the 80/20 balance.
Here I’m looking at the last two trading days of the past quarters, and the following first day of the next quarter. I am using 15m candles and then 30m candles beyond Nov 1 2021 because TradingView won’t let me see past that point with 15m candles ![]()
Q1 2022 | 2022/03/30 - 2022/03/31
9.50 move down: 461 → 451.50

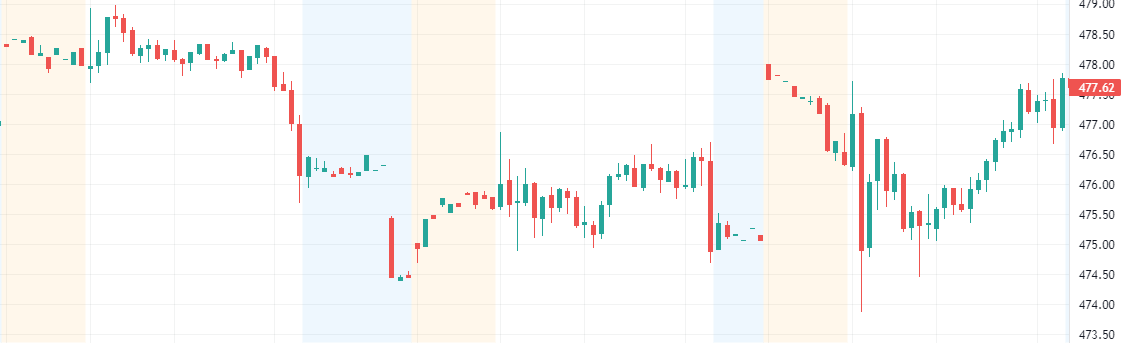
Q4 2021 | 2021/12/30 - 2022/01/04
4.30 move down: 479 → 474.70
And then gap up, sell off, and rally
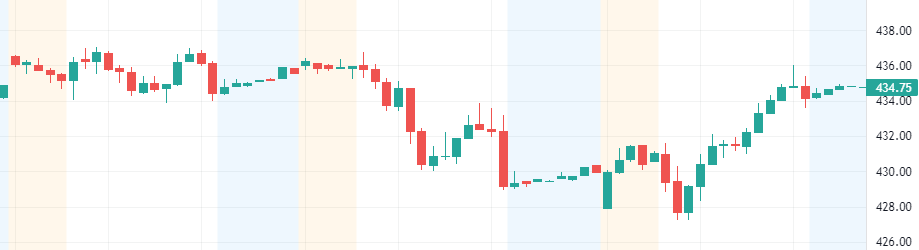
Q3 2021 | 2021/09/29 - 2021/10/01
7.90 move down: 436.90 → 429.00
And then open green, sell off, and rally
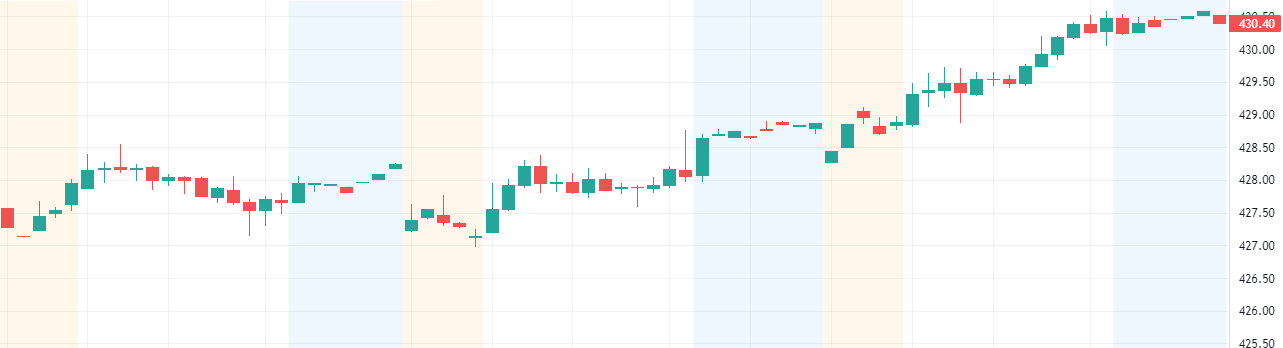
Q2 2021 | 2021/06/29 - 2021/07/01
0.25 move up: 427.90 → 428.15
And then open green and rally
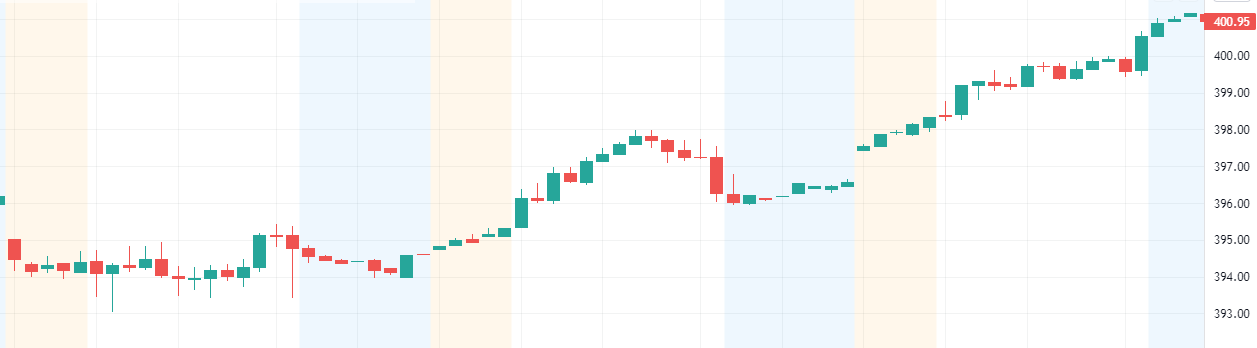
Q1 2021 | 2021/03/30 - 2021/04/01
2.25 move up: 394.00 → 396.25
And then gap up and rally
[size=4]Commentary:[/size]
- Q3 and Q4 2021 had the same pattern of two red days followed by a green. So far, Q1 2022 is looking similar, and we will see how it goes tomorrow to confirm if it will be a green day.
- Q2 2021 was the most stable with less volatility and a strong first day to the next quarter.
- Q1 2021 was interesting with a flat day, volatile day, and then a rally.
- Consistency?
It seems to be that generally (but a bit of a reach) on the last two days of a quarter from about 10 AM PST ish to 11 AM PST ish, volatility begins and it looks like larger sell-offs occur especially closer to EOD (except at the end of Q2 2021). - A clear consistency that we can spot is that every time, the first day of the new quarter rallied upwards intraday.
[size=4]Questions/Notes:[/size]
- Each quarterly transition was dealing with its own set of macroeconomic news. Are the patterns just coincidence?
- Do funds even rebalance quarterly? Maybe they do it every day? Or every week? Perhaps each do it differently. If so, are there enough funds that rebalance quarterly to create patterns like this?
[size=4]Trading Takeaway:[/size]
- The main consistency here is that on the first day of the new quarter, it could be a volatile opening, but generally the intraday will be bullish. We’ll see.