Stagflation leading to Recession - The Kodiak Bear Thesis

Thanks for sharing. Not sure what inventory levels this article it is referencing but from my reading wholesale Inventory and retail EX auto are the 2 big ones.
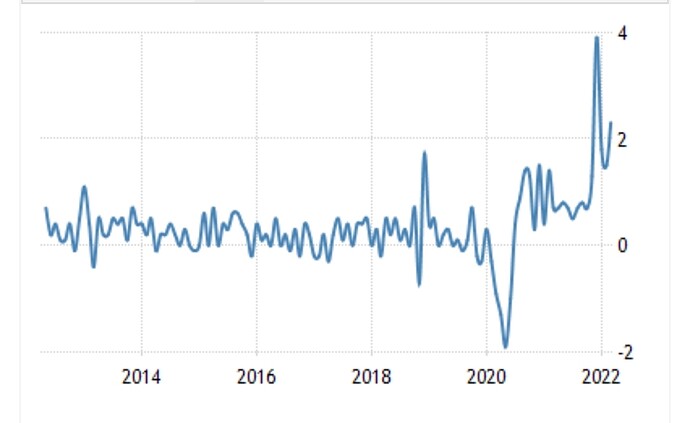
Here is the last 10 years for both from US Census Bureau.

Wholesale


Retail EX auto

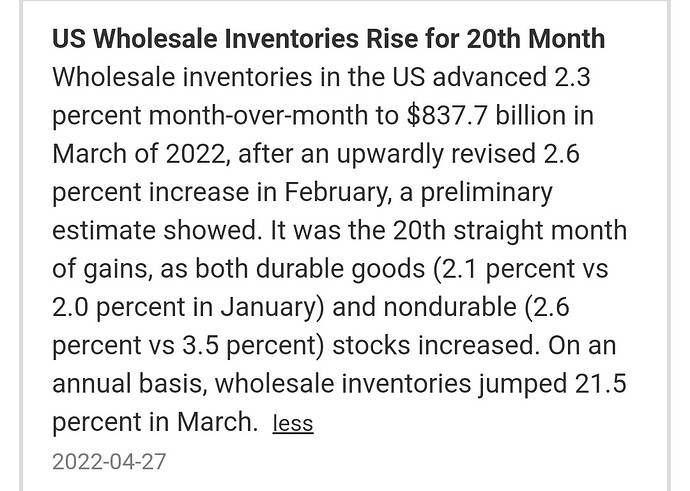
Inventory levels remaining elevated especially after the holiday season are goods that were ordered but not sold. These are dollars sitting idle “assets” that aren’t liquid. Suggesting a slowdown in consumption and an investment for a business that hasn’t realized.

Now, in an inflationary environment consumer spending is interesting. You have dollars chasing some goods. Inflation chooses who and what gets demand, and businesses respond by raising prices for the same quantity, or keeping prices the same and getting less quantity.

So although the consumer spending is strong, I would share in the opinion that they are getting less for the dollars they spend. They are needing to spend more to buy the same goods they are use to buying.

And since real wages are down, it appears this variance is then “made up” by buying goods on credit as we have seen consumer debt skyrocket in the first quarter this year.

Thanks again for sharing

2 Likes

Started the day with a heavy strangle, that quickly moved to the bear side as calls got cut and I played the selling pressure, manually moving SL’s until closing bell. Holding my May 20th and June 17th strikes, mainly HYG with a few small positions in ARKK and CCL that have done well this week. And a few runners in the indexes.
Had a tough trading day earlier this week, was trying to trade while in and out of meetings and was reflected in my performance. 5K Loss. Ouch. Learned a valuable lesson there. Regrouped and had a nice recovery and closed the month with a trading P&L% of 178%.

A few thoughts heading into next week.
We have FOMC meeting on Wednesday. This one is interesting, I’m expecting like everyone else we get a 50bps hike to Fed funds rate. Now, before today I would have thought that this news would be seen as short term bullish because that is what is expected. However, I believe we are starting to see some weakness to the euphoria the equities market has grown used to. This psychological paradigm shift is important. Too much negative sentiment and “Buy the dip” turns into “sell the rip”. Couple that with less liquidity and I’m expecting volatility and big swings both directions. Key Key support for SPY sits at 410, I think we test this soon, and if and when it breaks, brace for impact. Until then, be prepared to play both sides. Bear market rallies and massive swings are to be expected, nothing wrong with making money on both sides.

Trading Strategy and Useful Indicators
With the help of members of this great community, I have continued to try to optimize my trading strategy. For scalping and swings, I have had success starting the day 50-75% cash, looking for early key support/resistance (Thanks JB and Rexxar) and opening a strangle. After trend confirms, cut most of the losing side, and watch for the next support/resistance line to take profits or reposition. losing trades cut early for small loss, while winners run with manual trailing SL.

HYG
This has not only been my 2nd best ticker trading this year, its also turned into a great indicator. I always watch the movement of HYG throughout the day. This again is junk bonds, it moves like a cruise ship, not like a jet ski, so less violent swings. This gives an advantage imo because if SPY’s volatility or algos moves SPY up while HYG stays flat or red, I’m more confident that SPY will pull back closer to HYG. Or if spy knifes but HYG doesn’t follow, Im more inclined to think spy is oversold. There are select days where they dont move together, but those are rare, and as @Kevin pointed out, historically SPY & HYG are highly correlated.

Treasuries
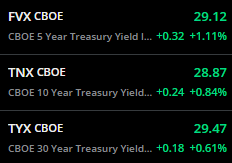
I track the full yield curve premarket every day, Im looking at treasuries and SOFR swap rates, but in webull I keep these up on my main watchlist so I can easily glance at it throughout the day. Its not 100%, but if you see these green and daily % 5yr is higher than 30yr, more times than not the market is red.
image

Unusual Whales
I track this periodically throughout the day. I like setting a 150-250K filter, taking out the major indexes and see what pops up, if there are a significant amount of trades in that range I will move the filter up to 500k-1mill. I don’t necessarily trade based on UW, but I do think the info is valuable and I take it into consideration when thinking about what the market is doing next.

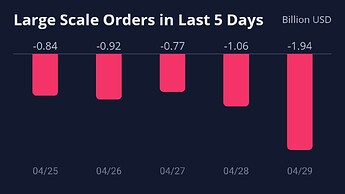
Large order Inflows/Outflows
I check this throughout the day also, but mainly on large advances or declines. super simple through webull. This gives you an idea of what the big players are doing during in the day and current week. So on a large green day, are they selling? On a large red day, are they buying?
This is Apple this week below.

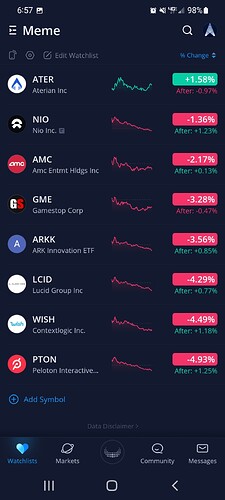
Meme stocks
I watch meme stocks as a temperature gauge on retail investors sentiment.
I mainly watch this on green days, if meme stocks are rallying across the board during an overall market green day, while none of the actual companies have any bullish news, AND low volume, more times than not it is a relief rally.

I don’t think any of these indicators are significant alone, but together they help me paint a better overall picture of what the market is potentially doing. They may seem very basic to some, but I have sure found a lot of value using them together and wanted to share as it may add value to someone else.

Hope everyone has a great weekend
16 Likes

Insightful video as usual by the Maverick of Wall Street: https://www.youtube.com/watch?v=b25CzGl80Mo

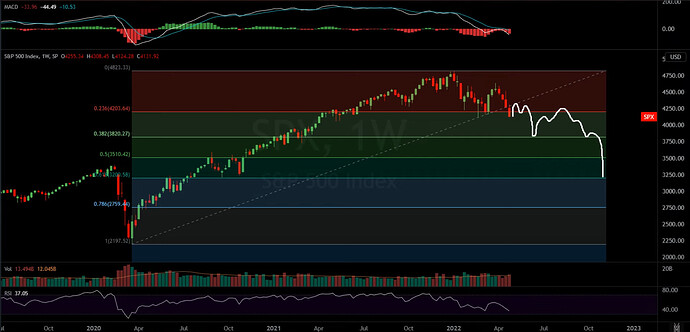
tl;dr it appears that when comparing to the 2008 market crash pattern, we are currently in an “initial shock” stage, which could be followed by a significant crash later on. We will know when the crash happens based on when commodities finally top out and crash back down, just like in 2008, because as commodities rise higher it represents continued global demand. When demand for even commodities go down, that is when the final flush will occur.

Crash pattern could look something like this:

11 Likes

I’m sure some of you have already read this given it has hit the front page, but still worth posting for those who may have missed.

For what it’s worth, I am a NYC native and I don’t fully agree NYC is completely dying. Parts of the main city are “dying” due to WFH policies, but moving to other parts of the city. Plenty of tourists and people engaging in business, just in different parts of the city.

9 Likes

Read this last night and found it to be pretty relevant. We live in your average suburb and it’s astonishing how many of the homes for sale are being bought by investment companies. In NYC or Miami this wouldn’t surprise me, but it’s interesting to see happening on such a large scale in North Florida suburbs.

The home across the street is owned by one and the renters just moved out as the rent was raised over 2x. Definitely doesn’t feel sustainable.

7 Likes

That WSB post made a lot of sense to me, and unfortunately most of the commenters couldn’t wrap their heads around the differences between reaidential properties/mortgages and commercial. Most of the dissent came from people who maybe read the title and first line and thought the OP was talking normal people getting foreclosed on en masse.

Like most things, the fallout probably won’t be as catastrophic as he’s making it out to be, but given the current climate I can definitely see the downside. I live near a small city and there are a lot of commercial properties which have been for sale for a while. Can’t speak on investment firms buying up residential property, it’s pretty rural out here.

1 Like

Thinking out loud here, but if 1/5 of all homes sold last year were purchased from investment banks, “corporate landlords” will be the new norm. But another angle im thinking about is airbnb. Haven’t found figures yet, but just scratching the surface it looks like “airbnb investment properties” have been wildly popular the last few years. As in individuals and companies buying multiple properties in large markets. Not people listing thier primary residence. Im wondering how big this market is and what their exposure would be if housing cools off while travel and hospitality simultaneously does the same. Anyone familiar with this world?

4 Likes

In the last year alone two companies bought over 1600 single family properties in Clay county. That won’t end well.

2 Likes

Do you know which two?

1 Like

Progress and American Home 4 Rent. Progress owns the one across the street from us, they’re basically slumlord level of property management.

2 Likes

Blackrock reached out last week and wants to pitch me on investing in their residential REIT. I plan to meet with them and ask some questions about the above and report back.

8 Likes

Ive seen alot of AH4R on windows and have talked to alot of renters from them. They dont keep up the property, roof, ac, etc etc. I’m wondering under what FL statutes require rental properties to be kept in livable conditions, and recorded that the work was done properly. Reason why I say this is because 95% of these properties I’ve visited and spoken with the renters, the roof is missing multiple shingles, if not entire squares off the roof. Further investigations provide that the renters cant even get ahold of anyone to talk to about repairs to the house so they feel they are forced to do this themselves without compensation. Multiple litigations that are already 1-2 years in process currently.

2 Likes

Wasnt that what your guy was talking about last week? The REIT.

1 Like

The Landlord’s Obligations

The landlord and his employees by law must follow the local housing, building and health codes; or

  • Where there are no applicable building, housing, or health codes, the landlord must maintain the roofs, windows, doors, floors, steps, porches, exterior walls, foundations, and all other structural components in good repair and the plumbing in reasonable working condition. The landlord’s obligations under this subsection may be altered or modified in writing with respect to a single-family home or duplex.
  • Unless otherwise agreed in writing, in addition to the requirements of subsection 1), the landlord of a dwelling unit other than a single-family home or duplex shall, at all times, make reasonable provisions for:
    • The extermination of rodents and wood destroying organisms.
    • Locks and keys.
    • The clean and safe condition of common areas.
    • Garbage removal.
    • Functioning facilities for heat during winter, running water, and hot water.

Additionally, the landlord must do everything he has agreed to in the lease.

The Tenant’s Responsibilities

As a tenant, you also have certain responsibilities. If you fail to live up to these responsibilities, you may be subject to eviction. As a tenant, you must pay the rent and security deposit and follow all other legal requirements in the lease agreement.

Tenants must also:

  • Keep their part of the premises clean and sanitary.
  • Remove all garbage in a sanitary manner.
  • Keep all plumbing fixtures clean and sanitary.
  • Conduct themselves in a manner that does not disturb
  • neighbors and breach the peace.
  • Not destroy or deface the property.
  • Comply with all housing codes.

Source

Additional Reading RE: Constructive Eviction

2 Likes

This WSB post is meandering at best. He is throwing out a lot of data that doesn’t necessarily connect causally.

Some notable omissions and logical leaps:

  1. He never mentions that the reason Wall Street has bought into residential RE is because of the increases rate of household formation, and the robust tailwinds being provided by years and years of underbuilding in key growth markets (namely the Sun Belt). Functionally RE is all about supply and demand, and demand has been high for a while (even before COVID) due to strong personal balance sheets (thanks to a decade plus long bull market) and increased rates of household formation (pure demographics).

  2. He mentions margin debt increases over the past few years and increases rates of “all cash” purchases but from what I can tell there’s no data in his post about how many such purchases are enabled by margin debt. Home equity and personal balance sheets were at all time highs in 2019, before margin debt and the stock market blew up. Again this is largely attributed to demographics. Baby boomers, a big demo contingent, have ridden an incredible wave of low home prices of the 80s and 90s combined with low interest rates of the 2000s. Many now have completely paid off homes worth several multiples of their cost basis, and I don’t see any data supporting the theory that these people are now YOLOing with margin debt and HELOCs.

  3. I can’t speak to his contentions re: commercial real estate as much, but I do work in the CRE finance world. I definitely don’t get a full view of the market (only the transactions I’m working on) but largely what I’m still seeing is lots of investment capital chasing surprisingly few deals. Capitalization rates are low (and prices therefore high) because there is a massive amount of investment capital in the marketplace, thanks to the factors described, and tax code features like Section 1031.

Debt service defaults outside of unique circumstances (like hotels during COVID) have been very low. Obviously that could change quickly if interest rates on variable rate loans increase rapidly, but a huge amount of debt in CRE is either fixed rate or has been hedged through interest rate swaps/collars.

I don’t have any data disproving that investors are using lots of margin debt to finance RE purchases, but what I can say is that lenders have been very concerned with borrower liquidity over the past few years, and most borrower groups have a LOT of liquidity right now. It wasn’t unusual to see investors and funds with 1% as much liquidity as net worth several years ago. Now I see a lot more with 10+% liquidity. That’s a key difference that means there is a stockpile of cash to insulate borrowers (and therefore lenders) from short term shocks that result in LTV/DSCR margin calls on individual CRE loans.

Just like OP in the WSB post, I could easily be wrong, and there’s a chance I’m “too close” to the industry to see what is going wrong. But from where I’m standing he seems to be overlooking some major demographic and inventory factors that are just as, if not more, important in moving RE values as the financing mechanisms.

My opinion is that RE is still in a strong position, but if it moves into a weaker position it would still be an outside catalyst (like a sudden crash in corporate balance sheets, which have been historically strong for years, that results in corporate bankruptcies and increased lease vacancy) that would cause it to crash. I don’t see it imploding on its own and taking the rest of the market with it as in 2008.

7 Likes

So this podcast just got posted a few hours ago.

This is one of the best current macro conversations I have heard. Alf who last year ran a 20 billion bond portfolio, and Michael Green, Chief strategist at Simplify Asset management. If i was going to rank top macro minds, they would both be top 5, next to Ray Dalio, Ben Melkman, and Jeff Snider.

What I find great about this particular podcast is nearly all of the discussion topics are topics we have discussed at length on this thread, so valuable perspective to add, and they do a good job explaining the plumbing in the credit markets and how it relates to equities, housing, inflation, monetary policy, etc.

Enjoy

8 Likes

New Maverick of Wall Street market breakdown video: https://www.youtube.com/watch?v=bdsHMy1l3tE

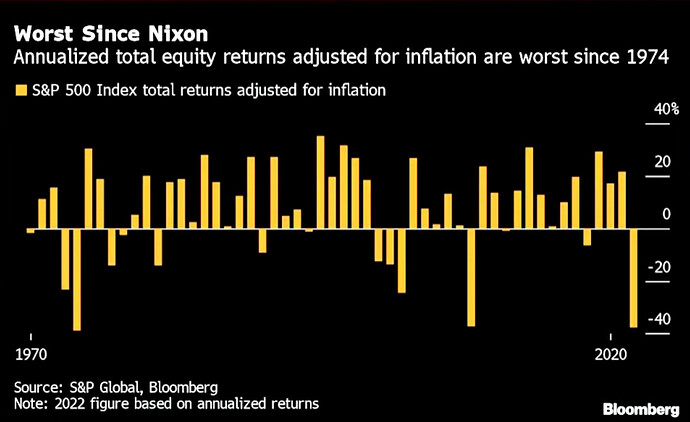
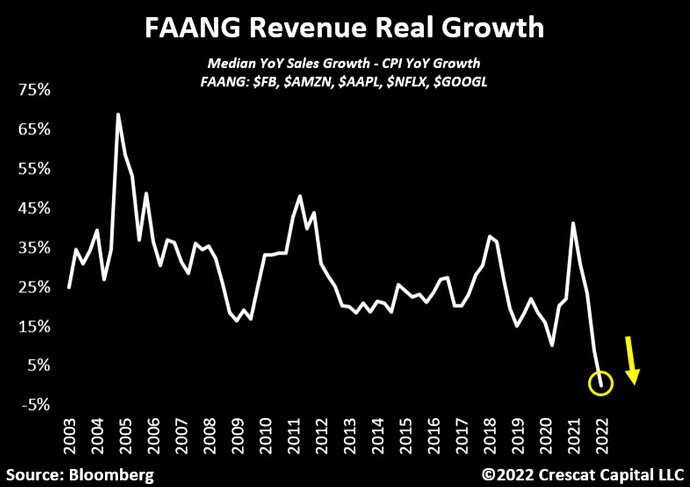
Some highlights

S&P 500 total returns adjusted for inflation is the worst it’s been since 1970.

Big tech real revenues adjusted for inflation are about to go negative for the first time in history

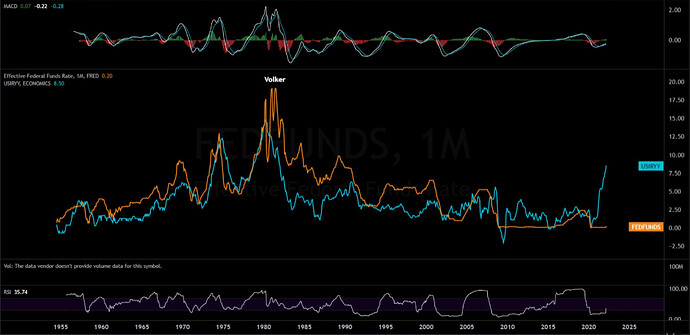
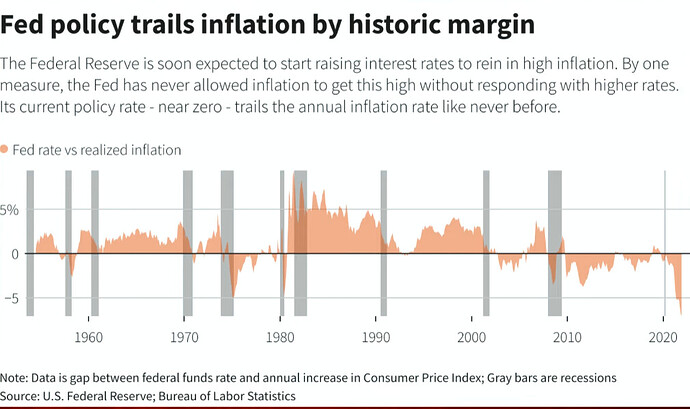
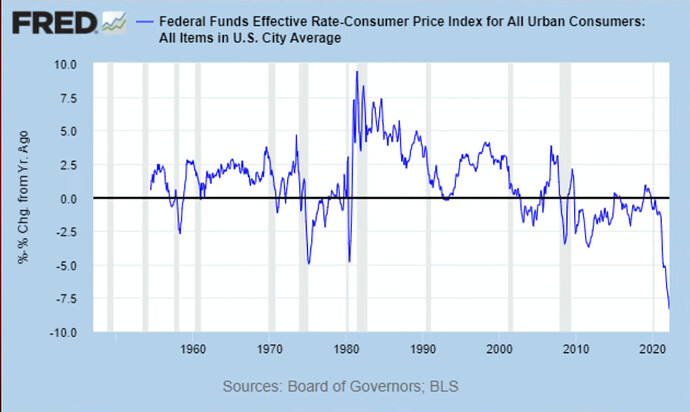
Fed is way behind the curve on fighting inflation. What does this mean?

Before JPow, the fed has had to fight escalated CPI by raising fed fund rates. CPI is in blue, and rates in orange. There is currently an insane gap between CPI vs fed fund rates. We need the orange line higher than the blue line.

In history we have never seen fed fund rates this negative adjusted for inflation.

To even begin catching up, the fed must raise rates more aggressively, dramatically higher in a short amount of time. Higher than 50bps in May. But will they? Seems unlikely.

5 Likes

Thanks @EV1 for alerting me to this on TF. I thought I’d copy the post here so that some eyes that are keen on macroeconomics can take a look.

https://twitter.com/dampedspring/status/1521225074833035271?s=20&t=tkg7nrK-RTC7f1qblcyB5g

Essentially, as I understand it according to Andy Constan there has been a reduction in Q2 of treasury bonds as indicated by the Quarterly Refunding Announcement. The latest report is that Treasury is going to pay down $26B instead of the expected borrowing of $66B.

https://www.morningstar.com/news/marketwatch/20220502380/treasury-to-pay-down-26-billion-in-debt-in-second-quarter

I’m going to have to dig a bit deeper to understand the operation here but would invite anyone to chime in and enlighten us. The only part of me that is skeptical about what Constan is saying at first glance is that he’s the only one saying it. Maybe he’s caught onto something that a lot of people have overlooked?

I believe his overarching thesis is that the reduction in sale of treasury bonds in Q2 will offset the QT that’s suppose to begin in June. Most believe that the Fed will start QT at $50B/month and gradually increase it to their target of $95B/month. If the treasury decreases the sale of bonds, and the Fed doesn’t buy them, then there’s less money (USD) being spent to purchase them and taken out of the economy. Then Constan’s idea is that the reduction in treasury sales (more liquidity) cancels out the Fed’s QT (less liquidity).

What happened when the Fed attempted QT back in 2017 was to greatly reduce liquidity (tied up cash) in the markets and we saw the Dow drop like 16% in a month. I’m gonna have to dig and see what the Quarterly Funding Announcements were back then and if there was any corresponding reduction in treasury bond sales.

2 Likes

Thanks for this, curious to see what you find. Pulled up this article as it had a bit of info about the 2017 QT compared to 22’s, may be useful for ya
https://www.reuters.com/business/feds-qt-plan-then-now-2022-04-06/

1 Like

https://twitter.com/charliebilello/status/1521523794631958528?s=21&t=t7k8Y7ZYpuNR6wavvfk5uw
JOLT Job Openings came out this morning, found this interesting. Small discussion in TF led to the conclusion that this gives JPow more room to work with.

1 Like