TheHouse
Valhalla Trading
Making sense of the current economic situation and what it potentially means for 2022 and 2023
Tickers in this play: VIX, SPY, & HYG
*** Update - Index Puts, TLT, MOS, HYG, and VIX
Disclaimer: This isnt financial advice. It is only perspective, use it how you wish.
This DD is to share my perspective on the current state of our economy and to hopefully shed some light on some potential drivers behind the scenes. I truly enjoy learning about financial markets and dedicate a substantial amount of time and energy exploring the complexity and trying to draw connections and build a forward thinking thesis to ultimately trade.
This DD will at times seem grim, but the intent is to add perspective to Valhalla, not to project my conviction onto others. This perspective can be used to understand a bear thesis, and I will go over some trades that I have made and are anticipating later this year. As I believe any trader should understand “both sides” I am absolutely open to hearing any feedback as I believe it adds value to all parties involved.
Stage 1: Monetary Policy
I started researching this thesis after seeing inflation hit 5% 4 months in a row back in 2021. But this story really starts in 2008.

Easy Money
The Federal Reserve is of course responsible for our monetary policy. We have been in an easy money mode since 2008, The Federal Reserve has kept interest rates extremely low while at the same time purchasing assets like treasuries, mortgage backed securities, and bonds through their Quantitative Easing program thus inflating the prices of said assets and increasing the money supply. This easy money policy was put in place to add liquidity to the system in the financial crisis of 2008. That was the first time they had ever used QE, the problem is, they have never been able to truly stop it. Now nearly 14 years later the Fed’s balance sheet has exploded. Back in early 2008, the first round of QE was nearly $600 million, which at the time was seen as an aggressive measure, by the end of 2010 the Fed’s balance sheet was 2.2 Trillion. The problem was a long recession, the stock market showed signs of recovery but even in early 2012 the unemployment rate was still over 8%.
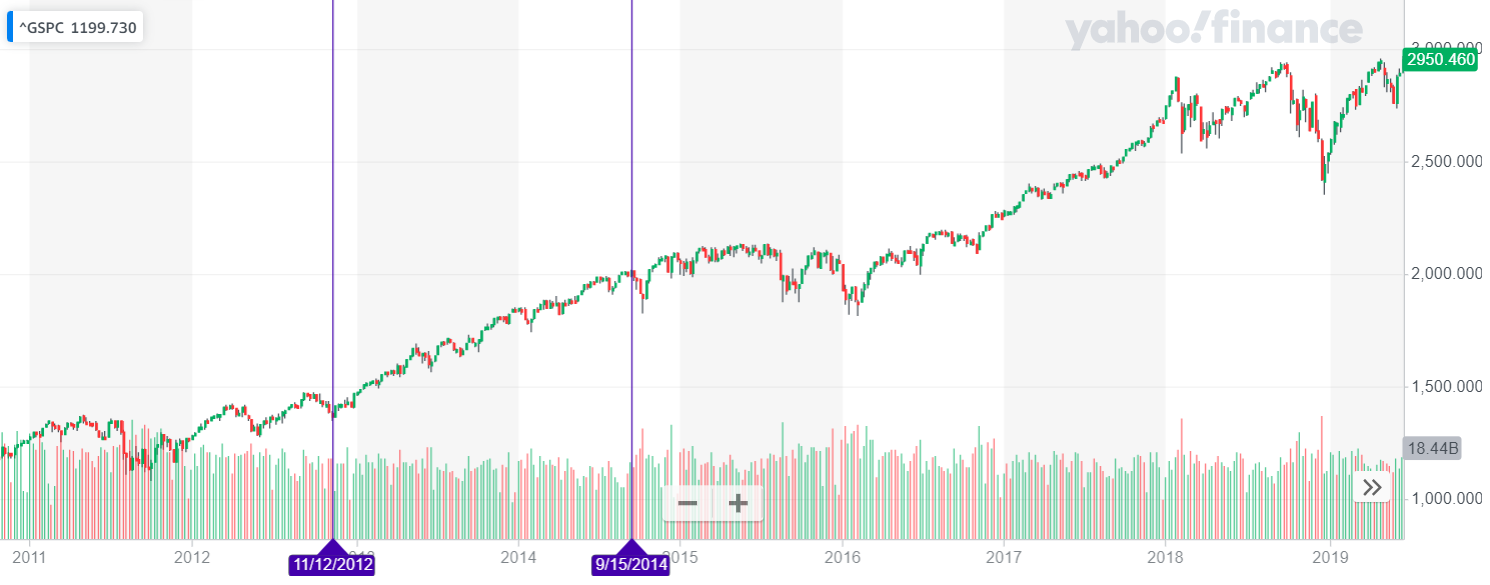
Government officials were putting a lot of pressure on the Fed to do something about it, because it’s hard to get re-elected when the middle class is struggling, and the answer always turned to low interest rates and more QE. So in late 2012 the Fed started QE again seen here:

By late 2014 the balance sheet had ballooned over 4 Trillion and interest rates were effectively zero still. The market had been in quite the bull market, this is the S&P with arrows at 2012 to 2014, about 25%.
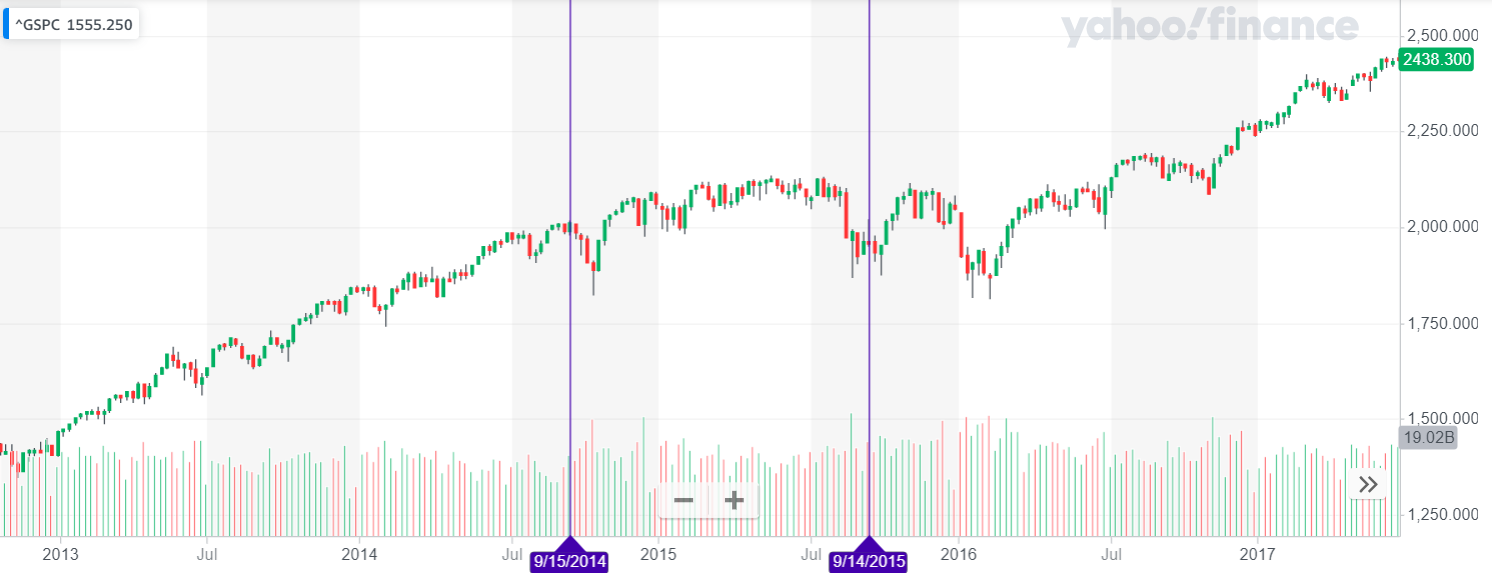
The market looked good but there were concerns over an overheating stock market, so the decision was made early 2015 to stop QE, but not taper, yet, while still keeping interest rates at zero. Seen here:

The market for the next year grew concerned over the Fed tapering assets off of their balance sheet, causing the market to react with lots of volatility and staying relatively flat.
I read articles from this period, and the headlines at the time were filled with speculation on what the Fed was going to do, the economy had slowed and they needed to take action.
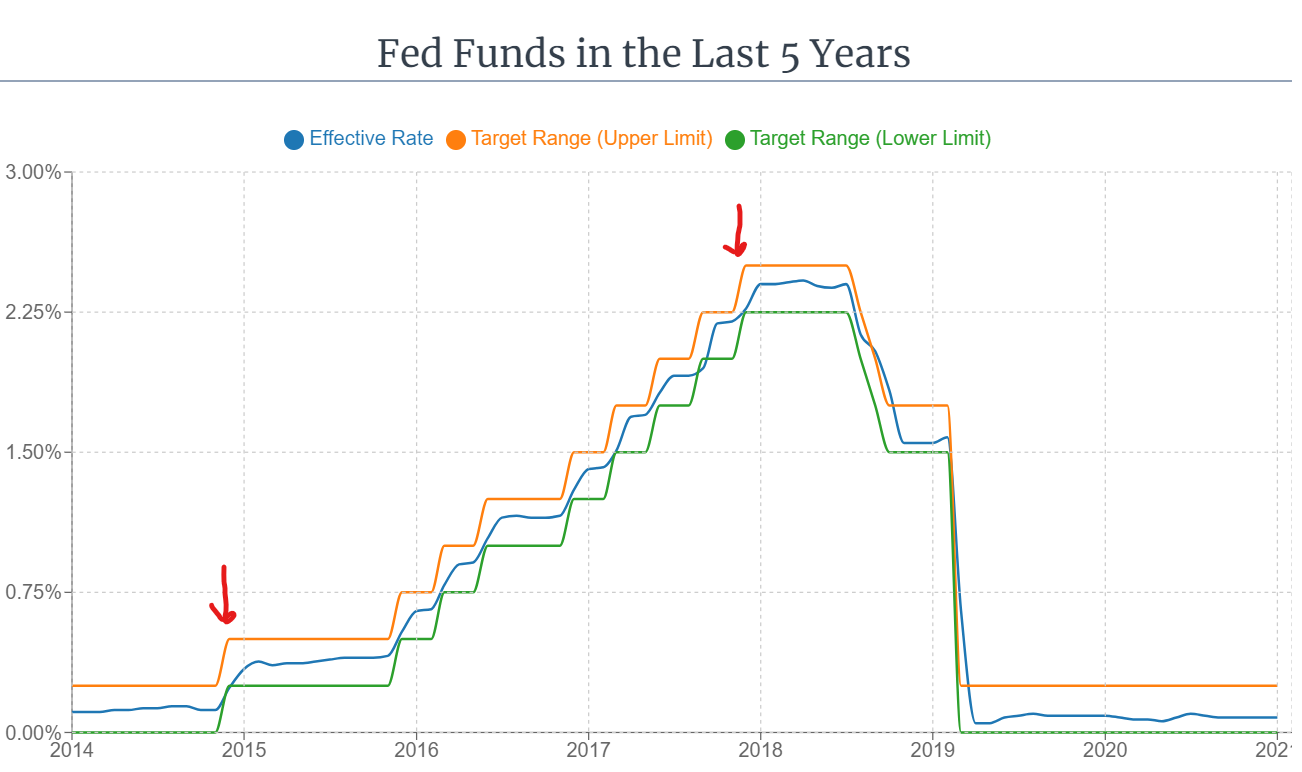
So In late 2015 they decided to not pursue tapering assets but instead decided to ever so slightly raise interest rates, starting at .24% November 2015 to eventually 2.27% November 2018. While still keeping the balance sheet the same. Seen here:
And again the stock market reacted negatively at first, then went on another nice bull run. From September 2015 to January 2018 the S&P grew roughly 30%
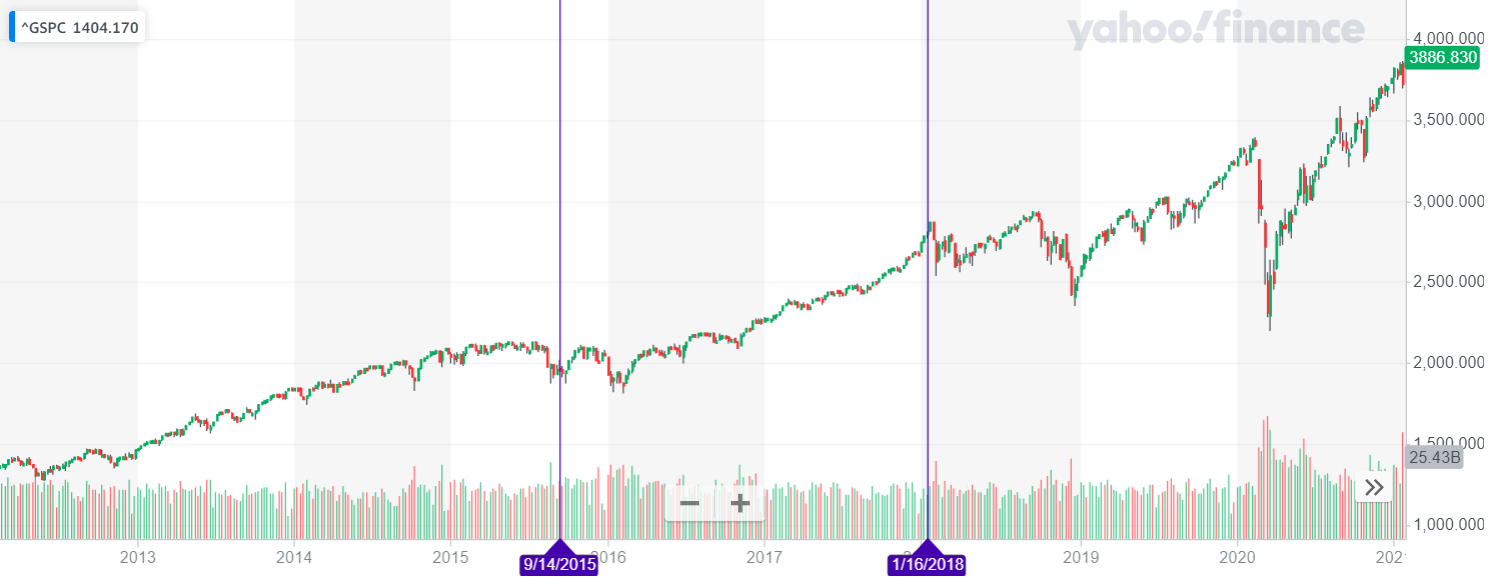
Now that the market looked stable and the economy was strong, it was finally time to taper some of these assets off of the balance sheet. So at the end of Jan 2018 the Fed announced by May 2018 they would start selling assets off of their balance sheet, and they did.

The problem again was the market was overheating, the S&P 500 grew 68% from Jan 2016 to Jan 2018. The minimal increases to the interest rates were not doing enough to slow down the growth so the Fed made the decision to start selling assets on their balance sheet.
There were measures taken to reduce the balance sheet but were always met with push back and a negative market reaction.
Interest rates had been increasing since 2015 but ever so slightly.
In 2018 their assets on the balance sheet went from 4.4T to 4T at the end of 2018. Only selling 400million and the stock market went into a panic. -6.59% for the S&P, ouch.

They still had interest rates rising at a slow rate, remember they got to 2.27% in November of 2018, but tapering while interest rates were rising was causing a pretty dark outlook, so they leveled interest rates in November and then started dropping rates well into 2019 to get easy money back into the system. And as you can see, the party continued.

Another 30% gain in the S&P in this time period.
Up to this point it looks like the fed is in a sensitive game of cat and mouse, for over a decade moving interest up and down and trying to get these assets off of their balance sheet largely unsuccessfully. Then in late 2019 into early 2020 the music stops.
Stage 2: The Covid Bomb
I’m not going to spend a ton of time here talking about covid. We all know what covid did to the world. Our markets were on the brink of collapse and the Fed had to take action. It was uncertain times and they went into crisis mode, justifiably so. The problem was, on a monetary policy standpoint, they were still dealing with the ripple effects of QE since 2008. But none of that matters if the world ends, so they did the only thing they know how to do. Print money.
And they printed, and printed, and printed.
They had been tapering for over a year, and were able to get about 600 million off of their balance sheet. Or essentially the first QE round in Sept of 2008, leaving their balance sheet sitting at 3.8 Trillion nearly 12 years later.
By June 2020, 7.1 Trillion.
And since then, they have been buying assets every month.
As of writing this the balance sheet is 8.8 Trillion. All while interest rates have still remained near zero.

Stage 3: Inflation
Up until 2021 you could make the case that a lower interest rate environment with QE could go on forever. There literally wasn’t any data that proved otherwise, sure there are theories, but what we face today hasn’t ever happened. I do believe that the Fed did too much during covid. I also think in the post covid world we should have seen less QE and higher rates. Both of which have not changed. Think about the last year in the stock market, what a year. No change.
So what are the consequences of all this? There are alot of moving pieces, but a big driver is inflation.
There are 2 types of inflation that are happening right now in my opinion.
#1: Price of goods
This is felt and talked about alot, and for good reason, inflation is regressive, it starts with the low wage Americans and starts working its way up classes. Meaning the first ones to notice it are the Americans living paycheck to paycheck wondering how to put gas in their car or food ont the table when every time they go to buy the same goods they are more expensive, Creating a domino effect that takes strong action to control. This is reflected in CPI.
#2: Asset Bubbles
I know how unpopular this is, but the fact of the matter is that we added 42% more money into the system. It has to go somewhere.
Inflation causes asset bubbles for many reasons. You create a situation where you have too many dollars chasing too little things (Think supply chain issues) and you also have the highest levels of discretionary income ever known. Again, the money has to go somewhere. And, unfortunately, or fortunately however you want to look at it when you send trillions of dollars to Americans to stimulate the economy, they spend it. Furthermore, when companies start reporting their financials from this windfall, it encourages more and more speculation, eventually leaving retail traders in a Bull market euphoria where “Stocks only go up”
Follow the money: The money pours into businesses because we don’t save in America, we spend, we consume. Those businesses start reporting stronger and stronger earnings, they have more and more money to invest in R&D and build more locations and to buy more inventory or even take on more debt and grow faster. This of course isn’t sustainable.
So much money has poured into the stock market that we have completely detached from typical evaluation standards.
S&P 500 Average PE ratio
Modern era historical average
19.60
Compared to when we had interest rates slowly rising and frozen QE
2017: 16.31
Year before dot com crash
1999: 32.92
Last year
2021: 44.60
Here is the S&P vs Historical trend, adjusted for inflation.

We are 186% above trend, and as you can see we have never in history not gone back to trend after breaking the line. That by the way would put the S&P 500 at $1630.
There are so many moving pieces that play into this, this could be a book, I encourage you to look into:
Late 70’s early 80’s Inflation Crash
Collateralized Loan Obligations
Rising 2022 retail Inventory levels
MBA forecast Mortgage Originations to fall 33% in 2022
Consumer debt rises 1 trillion in 2021, fastest increase since 2007
Commercial real estate vacancies
Fixed income COL adjustments
Russia / Ukraine situation and how it could affect oil prices
Rate hike odds after Jan CPI
Stage 4: The Play
I believe the Fed is now in a game they created without the possibility to win. They traded shorter term pain for many times to now be in a position where there are no options that don’t lead to significant financial turmoil.
Timing is the hard part here.
Technicals are painting a picture and it does seem to be moving fast especially after todays CPI numbers, FOMC Meeting in March, followed by Q1 Earning Season
Spy Puts
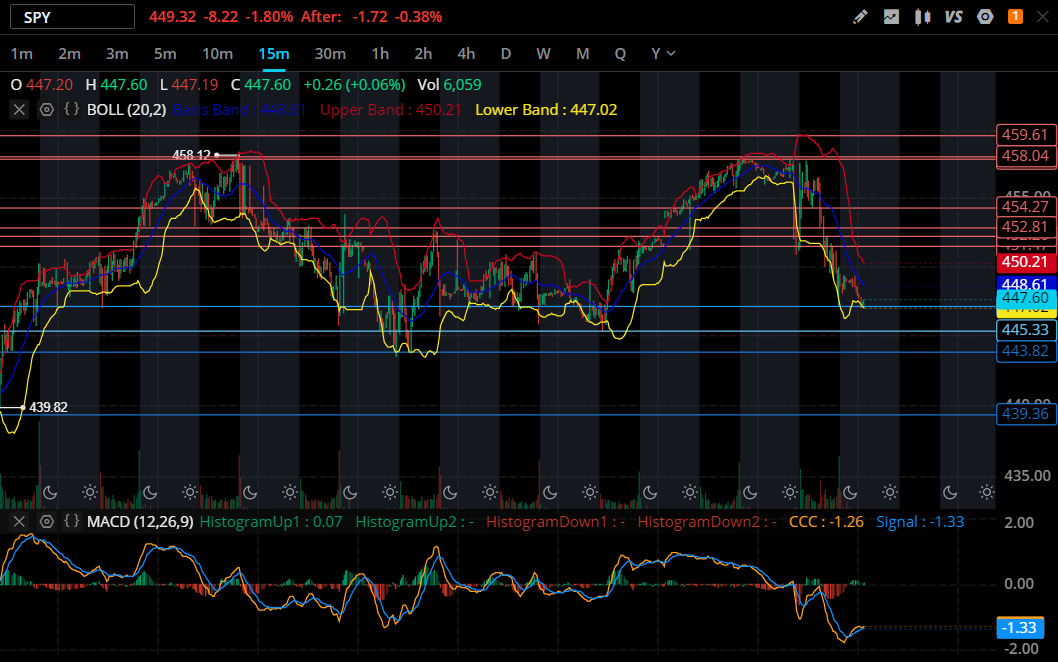
Bounced off 458, with an incredible Bearish divergence on MACD. Has some support to test, but I would keep your eye on 420 in the next few weeks, if that breaks I believe the thesis to be true. Short term, I have been playing volatility. Raising funds for the big plays. This morning went full Bear anticipating terrible CPI numbers. I do think we will see a kangaroo market as everyone is trying to figure out what to do so scalping will be great. I like long term puts 2 deviations from trend for June-Sep, this is the money maker if this is accurate, just need to see how things evolve with the Fed
VIX Calls

I like VIX, you could prob guess by looking at the chart how I have been swing trading this. Heavier on the call side but I have been playing puts on those big swings. European style contracts cash settle day after opex means less selling pressure, and the OI is absolutely jacked mid year. I like close OTM short term calls until march and for the big plays deep calls in June-Sep depending on Fed. In 2008 VIX spiked to 89.
HYG Puts

HYG or ishares Iboxx $ High Yield Corp Bd Etf
These are junk bonds for not so creditworthy companies. There is a case to be made that equities follow credit. HYG peaked in Sep 21, and has been consistently falling since.
Almost to the point of no return. I like deeper puts on March+ strikes, Huge OI on the puts side.

I have researched this nearly every day since last fall. I found that there are some notable figures who have been talking about this.
The top 2 that I want to mention are:
Ray Dalio at Bridgwater & Associates, Runs the world’s biggest hedge fund.
Michael Burry, Scion Capital, He sold 97% of his equities portfolio in Nov 2021. Within 2% of the all time highs.
I obviously have conviction in this thesis, but I could be dead wrong. We could try negative rates, or QE forever, maybe have our government step in and put price caps on things, wouldn’t be the first time in history. Or this really is just the byproduct of “supply chain issues” Nonetheless, I want to reiterate, my intent is to add this perspective to the Valhalla community, and if you like it, understand it is a high risk play.
-TheHouse
