So. I like indicators. I like to play with them and see which work for me and which don’t. I often troll through the endless streets of utter bullshit on TV to find that small nugget of gold. Since I like this dumb stuff, I thought it might be fun/educational to see what other people are using.
Note that I believe this is all personal preference - there are no best indicators and if it works for you then it works.
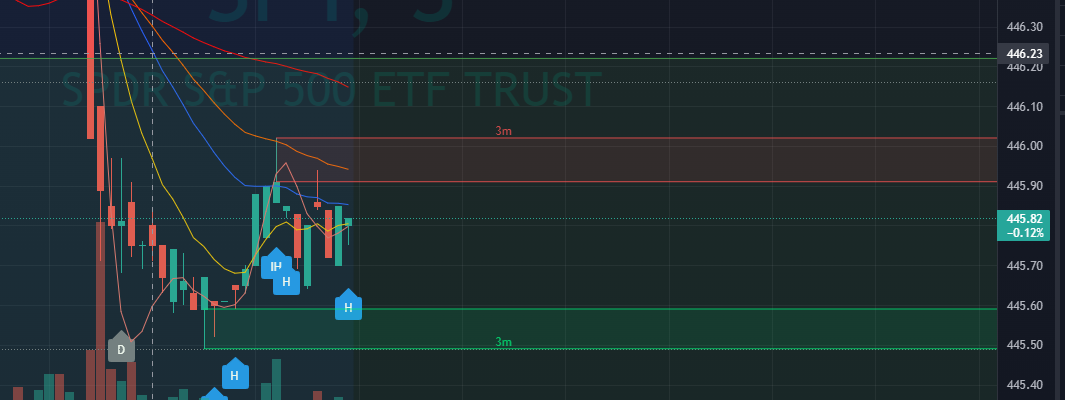
My charts are absolutely degenerate looking in part because I’ve turned on all the auto-TA indicators and candlestick patterns that TV has recently published. I want to see how well they work and I also want to practice my own TA skills, so it helps to see what TV is pointing out on the charts. If you’re interested in trying those out on TV, go to the indicators section and look at the chart patterns/candlestick patterns section.
I exclusively use RSI, VWAP, and Boll bands for my daily spy scalps because theyre pretty reliable for entry and exit signals. I usually try to buy at the bottom of RSI and sell at VWAP for a call scalp.
I’m a big fan of RSI, MACD, Bollinger Bands, and horizontal lines. If I’m actively trading, by the end of the day my chart will have a million straight lines. If it’s a less active ticker than SPY I may take the time to color my lines - cyan for support and red for resistance.
So i’ve been using the Ichimoku cloud indicator on SPY for sometime now. Pretty damn impressed with how SPY generally respects the lines on the shorter timeframes (lines drawn based on the 1D chart).
Would recommend incorporating it in your gameplan if you haven’t already.