The Tradytics Bot - A Descriptive Inquiry into Bobby

Numbers Updated: 10/23/2021

Summary:

Here I present two things that I think may be of interest to Valhalla.

  1. Introduce an initial dataset of all the bot options calls (ai-option-calls channel on discord) and invite others to analyze.
  2. Some preliminary, descriptive analysis of that data.

Motivation

I’m a really new trader, and rely on others’ DD in order to make plays with my small account (started with ~ $100). In fact, my motivation for trading prior to finding Valhalla was trying to make enough money for one pizza a month following wsb plays. Through y’all, I making a pizza a week, thanks! One of my main strategies each week is playing the bot. When you begin to play the bot, the floor (including me!) will suggest “folk theories”. Things like:

Just play the rocket emojis

I only play over X confidence levels

The bot is only good at reading popular tickers

The puts are sus.

These are folk theories in the sense that it lacks rigorous justification because they rely on few cases and lack testing for the meaning of provided data points (assumptions of what ai confidence measures is prevalent). I want to provide some opportunity to make AI Bot suggestions less of a gamble. I am currently a bit busy with life things to conduct the thorough analysis the Bobby data deserves. So I am trying to handoff this data to y’all.

I wrote this all up in R. If you want to see the data-cleaning code, or how this document was created, DM on discord.

The Data

About the collection: So I tried to write a scraper to take all the stuff from the ai bot channel. It was more work than it was worth. Instead I just highlighted and copy/pasted it all. Then cleaned the set. Here’s a sample of 5 rows (YMMV on seeing all 15 columns of the tables):


symboldate_of_signalstrike_priceexpiration_dateoption_orderbuy_selltime_expectation
XPEV2021-06-21452021-06-25PutBuy1-2 days
SOFI2021-09-22152021-10-15CallBuy1-2 days
COIN2021-10-142602021-10-15CallBuy1-2 days
RIOT2021-08-27372021-09-10PutBuy1-2 days
BA2021-06-032522021-06-04CallBuy1-2 days


ai_confidencerocket_emojioicalled_prems_spentapprox_prems_spentvolumeboom_emojitracking_link
58.6FALSE9.58e+03129K1.29e+05411FALSEhttps://tradytics.com/bullseye-dashboard?alert=-ZZJfI-t0Xaq-jov3C-WX5gg-PYIB3
53FALSE2.87e+04689K6.89e+053.2e+03FALSEhttps://tradytics.com/bullseye-dashboard?alert=-BeCfj-YGNR1-8OzlK-dl4N3-9imKh
54.5FALSE5.15e+03317K3.17e+051.16e+03FALSEhttps://tradytics.com/bullseye-dashboard?alert=-YG1Ml-WVOxt-0yxJh-rSKtE-6dnSJ
58.5FALSE2323.36M3.36e+061.48e+04TRUEhttps://tradytics.com/bullseye-dashboard?alert=-BP4bR-6lFw4-2FOni-mLa6l-HZqrH
54.2FALSE1.33e+03179K1.79e+05740FALSEhttps://tradytics.com/bullseye-dashboard?alert=-QmAF1-dBRlL-RYJlo-qFpZ3-6q2me

I think this is an indispensable set of information for getting rid of the folk theory play on Bobby, and would therefore like to invite for others’ analysis.

Some questions of interest to me that I don’t have time to look at right now that requires querying other data:

  • How often does the signal pay?
  • Are rates of success related to the confidence rating? The ticker popularity?
  • Are the emojis actually useful?
  • Can we build a predictive model using the historical bot data to determine when bot plays are worth it? (Hopefully free of overfitting, but we’re already without data, so i’m sure that’s fine)
  • How frequently does news excite the bot to signal incorrectly?

Although I do not currently have the time to conduct this analysis myself, I’m hoping this can be a start for others.

For now, I can present some description of the data as is.

Descriptives of Current Set

The data is currently all dates from June 01, 2021 to October 20, 2021. I’ll take my referenced folk theories in turn, not to debunk them (yet), but to provide context for questioning of what assumptions we make on Bobby.

Just play the rocket emojis.

Here’s a scatter plot of time and options signals with the rocket emojis highlighted:

This theory is the same as “Just play above 60% confidence”. Speaking of:

I only play over X confidence levels.

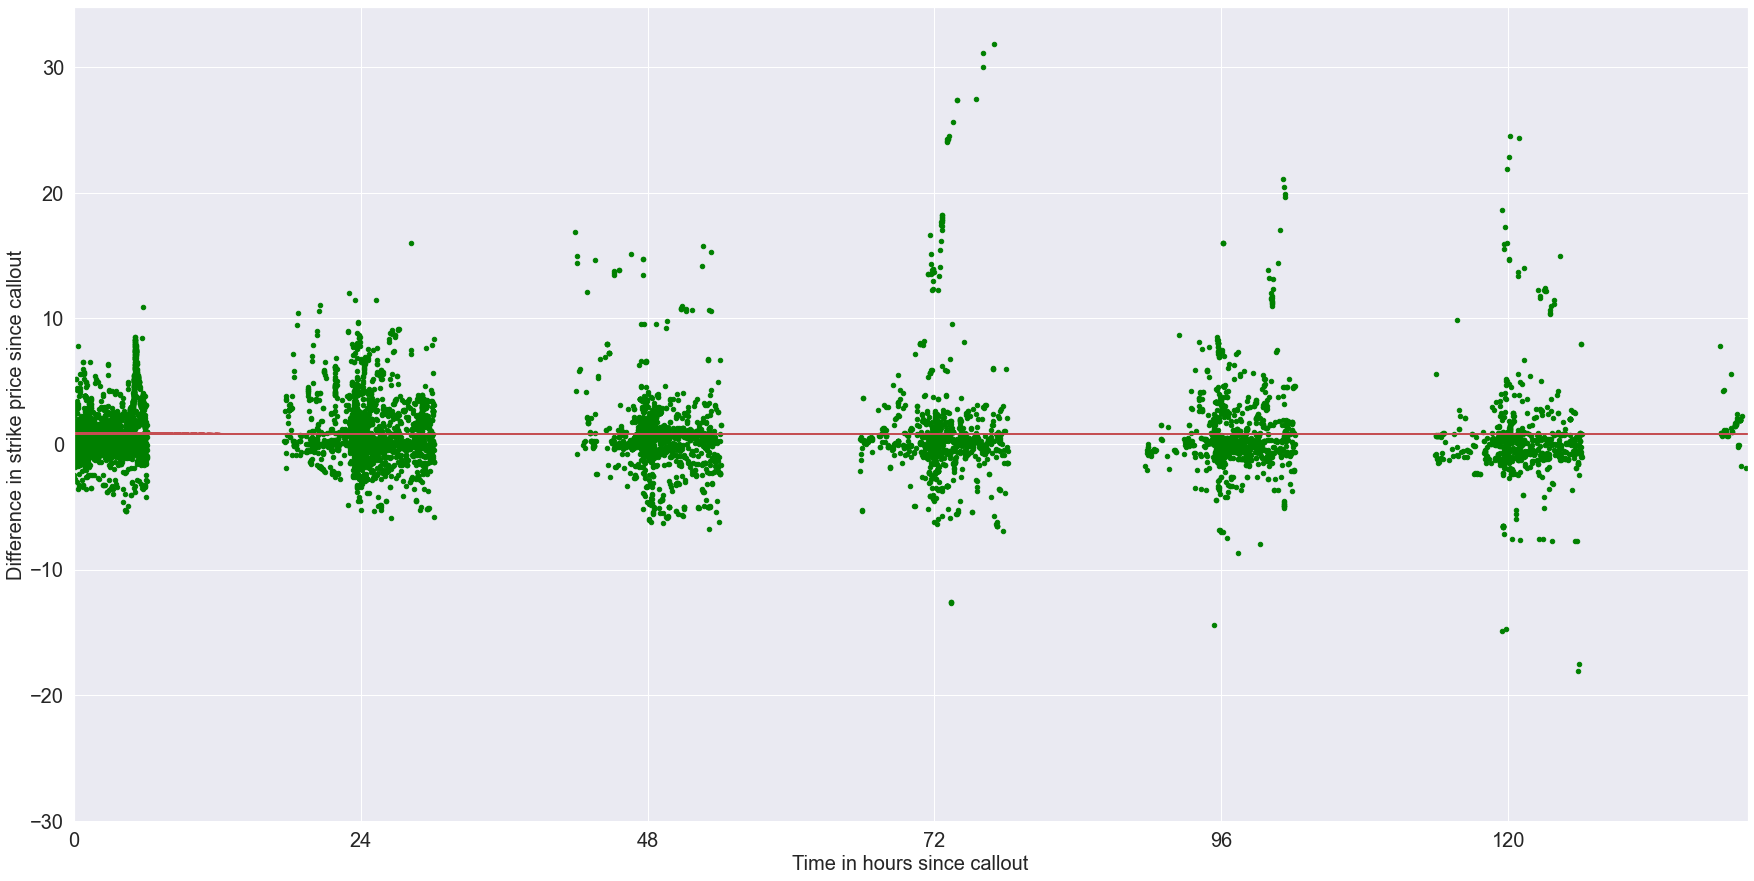
Here’s a scatterplot of the ai confidence over time.

Given that the tradytics website doesn’t really explain what the “confidence” measures (a shrewd business move on their part tbh), note how many plays are limited by such guesses as “Above 65 and you’re good” or what have you. Also the median if 55.9 if you’re into that kind of thing.

The bot is only good at reading popular tickers.

It looks like confidence above 80 is pretty rare. When we zoom in to those, it seems like reddit behavior prompts some of the bots’ read of a ticker imo.

The top seven most frequent ticker calls:


SymbolNumber of

Bobby Signals
AAPL97
NVDA91
AMC85
BABA85
TSLA85
AMD82
MRNA81

Is the bot good at calling popular tickers, or does it get more chances to try? That much is unclear without more analysis. Food for thought though.

The puts are sus.

Here’s the rates of calls / puts:

Now it may be the reverse. Is the bot bad at put signals, or does it get less chances to try? I will note that conq did say a few days back “The bot can’t read the news” more or less.

On these folks theories:

I want to motivate more inquiry here. The risk of such theories became more clear to me when I got the data down.

Here I highlight a couple quick points of the Bobby data:

Virtually all of the calls here have the 1-2 days expectation of paying out. Tradytics could in theory change this part of the post, and have never done so in this dataset.

On the other hand, there are, in fact, sell signals. I know some folks have questioned their existence, and couldn’t be bothered to use discords search function. Table here:


Buy or Sell?Number of Bobby Signals
Buy3076
Sell66

The average expiration date of option signals:


Call or Put?Average Time Until
Expiration (days)
Call17.69
Put22.01

Added this because I feel like it might be important to understanding what they mean by “confidence”

Final Thoughts

Like I said, I’m new to trading; I’m sure others will find more value in the other columns in the dataset than I do (or the links!). I put this together because I would like Bobby plays to have more principled rationales. The link to the total dataset is here: a google drive with the whole set as a .csv

20 Likes

Keep it up and pizzas on me next month (just 1 med cheese though from little cesars)

7 Likes

This is absolutely incredible my friend. In the vein of what @posternutbag said, pm me a cashapp and the community will buy you a pizza.

9 Likes

Really thank you so much for the contribution!

7 Likes

This is amazing. Something I was interested in but glad you generated all this amazing information. I may try and dig into some of this soon. Thanks!

6 Likes

Enjoy the pizza. :pizza:

17 Likes

LETS GO! Thanks, Conq.

Edit - Preempting future questions: It’s going to be pepperoni and jalapeno.

5 Likes

I personally think the “1-2 days” is completely BS since the bot puts that on 1DTE and 0DTE contracts. I’ve also never seen any other interval other than 1-2, so I’m assuming that it’s just a fixed string that is placed on every call.

2 Likes

Agreed. Because if “1” means “same day” then this is the worst way to write that. I think you’re probably right it’s a fixed string. When I tried to scrape the posts initially, the place where they write that message seemed like it could be easily changed on the part of the submitter, and simply never was. I’ll edit the post to reflect that nuance.

2 Likes

@SixUmbreons – this is great. I think it would also be helpful to analyze the profitability vs. time of each callout. Maybe there’s a distribution that could help us bot traders determine the most likely time to profitability vs. the expiry date, like if the bot calls out a X-DTE, then the peak profitability window is Y hours/days after the callout, etc.

3 Likes

@SixUmbreons

Thanks for including the links to each play in the spreadsheet.

I found that when you send a GET request for the URL, the return includes a chunk of JSON which includes fields like “change_since_alert”, “highest_since_alert”, “lowest_since_alert” where the value for each is a percentage gain.

I should be able to write something to pull those out and add them as additional columns to the spreadsheet.

Will need someone to check my math as it’s been a while since I did any statistical analysis but I think we could run a multiple regression to identify how useful the various data fields provided are in predicting future percentage gain.

EDIT:
Also found that it includes a chunk of JSON with the date/time and the bid/ask over the life of the callout, including just before. Could try to plot them all over time to test the 1-2 day suggestion it gives.

Will try to get around to doing this this week.

5 Likes

Trying to look at some of the other data available from the bot, I found that there was options price history for the last ~400 callouts by the bot. I’ve plotted these below, with the X axis counting the hours since the callout and the y the change in the ask price for that contract (the original callout contains the ask price at the time, and the data contains ask prices at various price intervals).:

You can see that the time intervals that it collects the data for aren’t regular which is annoying for comparison purposes but even with that, there’s nothing that jumps out immediately to me apart from a bit of a spike around the 5 hour mark. This graph is zoomed in on the first 72 hours, but more data was available for >1000 hours for some reason.

Here’s 5 days worth:

You could break this down much further and separate it into calls vs. puts/DTE of the bot call/rocket emojis etc., but I had a spare hour so put something basic together. Happy to make the data available to anybody who wanted to dig deeper into it.

2 Likes

Check out what @kelli20 has been putting together below. Those graphs to me seem like a set up that could be modeled with some shrewd MLE or bayesian modeling to capture the distribution you’re talking about.

1 Like

These look great! Thanks for working on this. I know there are a few other data saavy folks who are looking into this, and more hands makes less work. So expect some folks looking for the data soon.

This is amazing! I think you’re opinion about Reddit to confidence % is spot on. Taking a MBA course next quarter in Machine learning with Python. Hope I can take data sets like this in the future and make some $.

1 Like

Some more descriptive analysis for stats fans. Exploring the available data some more, I’ve found that I was able to pull the ‘highest possible percentage gain since alert’ and ‘lowest percent gain since alert’ and tally these against the AI confidence. One word of caution - this data was from Tradytics[1] and I don’t know how often/whether they’re collecting intraday prices to come up with this figure. There’s also no indication of how long this gain would have lasted for, or how long after the alert it would have been available.

It would be great if anyone with intraday options pricing could have a look as well and confirm whether this is accurate.

The first thing I looked at was how often the bot alerts have a positive percentage gain at some point during the callout period. I found that the bot alerts provided a gain at some point during the callout 2082 times, against no gain at all 1043 times. This suggests that This means that 66% of alerts will give the possibility of gaining money (at the strike price they call) at some point during the callout period. Conversely of course, this means that 33.376% of the time, you had no chance of making money from the bots callout. This is close to agreeing with Tradytics’ own performance metrics which state that the Bullseye bot has an accuracy of 69.39%.

Bot Result Count
Gain (at any point) 2082
Loss 1043

To look at whether the percentage confidence had any impact on these figures, I broke it down into bands of 5%. Out of the bands with a decent sample size, the 60-65% band seemed to perform the worst, with nearly 4 in 10 alerts failing to gain you money.

AI Confidence Bands Average Percentage of Alerts with Positive Gain at any point Count of Alerts
50.01-55.01
Gain (at any point) 70.28% 953
Loss 29.72% 403
55.01-60.01
Gain (at any point) 67.52% 551
Loss 32.48% 265
60.01-65.01
Gain (at any point) 60.37% 291
Loss 39.63% 191
65.01-70.01
Gain (at any point) 60.87% 168
Loss 39.13% 108
70.01-75.01
Gain (at any point) 60.98% 75
Loss 39.02% 48
75.01-80.01
Gain (at any point) 64.41% 38
Loss 35.59% 21
80.01-85.01
Gain (at any point) 40.00% 4
Loss 60.00% 6
85.01-90.01
Gain (at any point) 66.67% 2
Loss 33.33% 1

As well as the number of possible winners, I also looked at the average size of the gain.

One word of caution with this. Outliers.

IRNT, for example, was called at ~61% confidence and the highest percentage gain possible given is 3500%. Considering the fairly low sample size and the fairly low average in that 60-65% band, without IRNT, you’re looking at closer to a 59% average. One final thing to remember is that the max loss on buying calls is 100%, whereas the max gain is theoretically infinite, so the average will always (hopefully!) be biased towards the positive. With all of that in mind, here are the averages for the different confidence bands.

One thing I noticed was that the largest loss possible decreases nicely as it moves through the bands, suggesting the downside risk is decreasing as the bot gets more confident.

AI Confidence Bands Average of highest_since_alert Average of lowest_since_alert Count of alerts in each band
50.01-55.01 78.7095755 -37.37164404 1356
55.01-60.01 86.15826979 -30.9443898 816
60.01-65.01 66.51248542 -29.90360519 482
65.01-70.01 78.28481015 -28.52211442 276
70.01-75.01 103.1129965 -17.3140195 123
75.01-80.01 87.18135644 -16.91527814 59
80.01-85.01 2.09414 -33.72933 10
85.01-90.01 14.8541 -30.3566 3

One final thing I would say is that this shouldn’t be used as any sort of recommendation on particular trading strategies. Without being able to confirm the veracity of the data (i.e. when was it collected, how often do they collect prices, how long do they collect prices for?), I can’t put any sort of confidence on the analysis beyond saying it might give a general picture of the bots performance.

[1] - Highest Gains and Highest Losses come from the maximum profits section for the given URL for each call out.

9 Likes

@kelli20, this is the type of analysis I was hoping would be completed with this data set. This is very insightful! Thank you!

Love looking at the data! Thanks for all the work fellas

incredible! thank you so much for putting this together!

Thanks, glad you’re interested in having a look at this too!

Agreed that there’s a ton more value we can get out of this data! I wasn’t confident in the data that I had access to to be able to do any time series analysis, so had to plump for basic descriptive statistics. Off of the top of my head and with the time and access to accurate and regular price options history I would like to look at:

  • Sector (which sectors are bot alerts more accurate at predicting?)
  • Time (how long should we optimally hold for based on past performance of the bot? Do sector or any other characteristics change this?)
  • Does the DTE of the contract affect the bot’s accuracy?
  • Bid/ask spread - I’ve seen the bot sometimes alert on contracts with a wide bidask spread. Would be interested into looking at how that can affect profitability.
  • How? - Which characteristics of the bot callout are most useful in predicting performance
  • Tickers - is it better at particular tickers? Better at large cap, mid cap, small cap?
1 Like