Today I was browsing www.usethinkscript.com for ideas when I stumbled across a code that I thought might be a nice quality of life improvement for us all - particularly for gamma squeeze plays. The code is for a custom options chain column - it calculates and displays the day change in OI, from yesterday to today. It uses green to indicate an increase in OI, and red to indicate a decrease in OI.
I know I’m not the only one fumbling through screenshots each morning to try to compare and subtract OI while half awake in premarket…but that is now behind us.
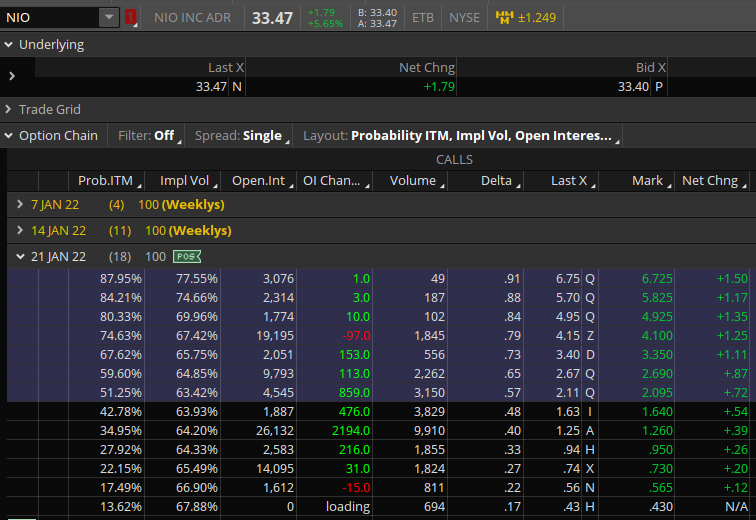
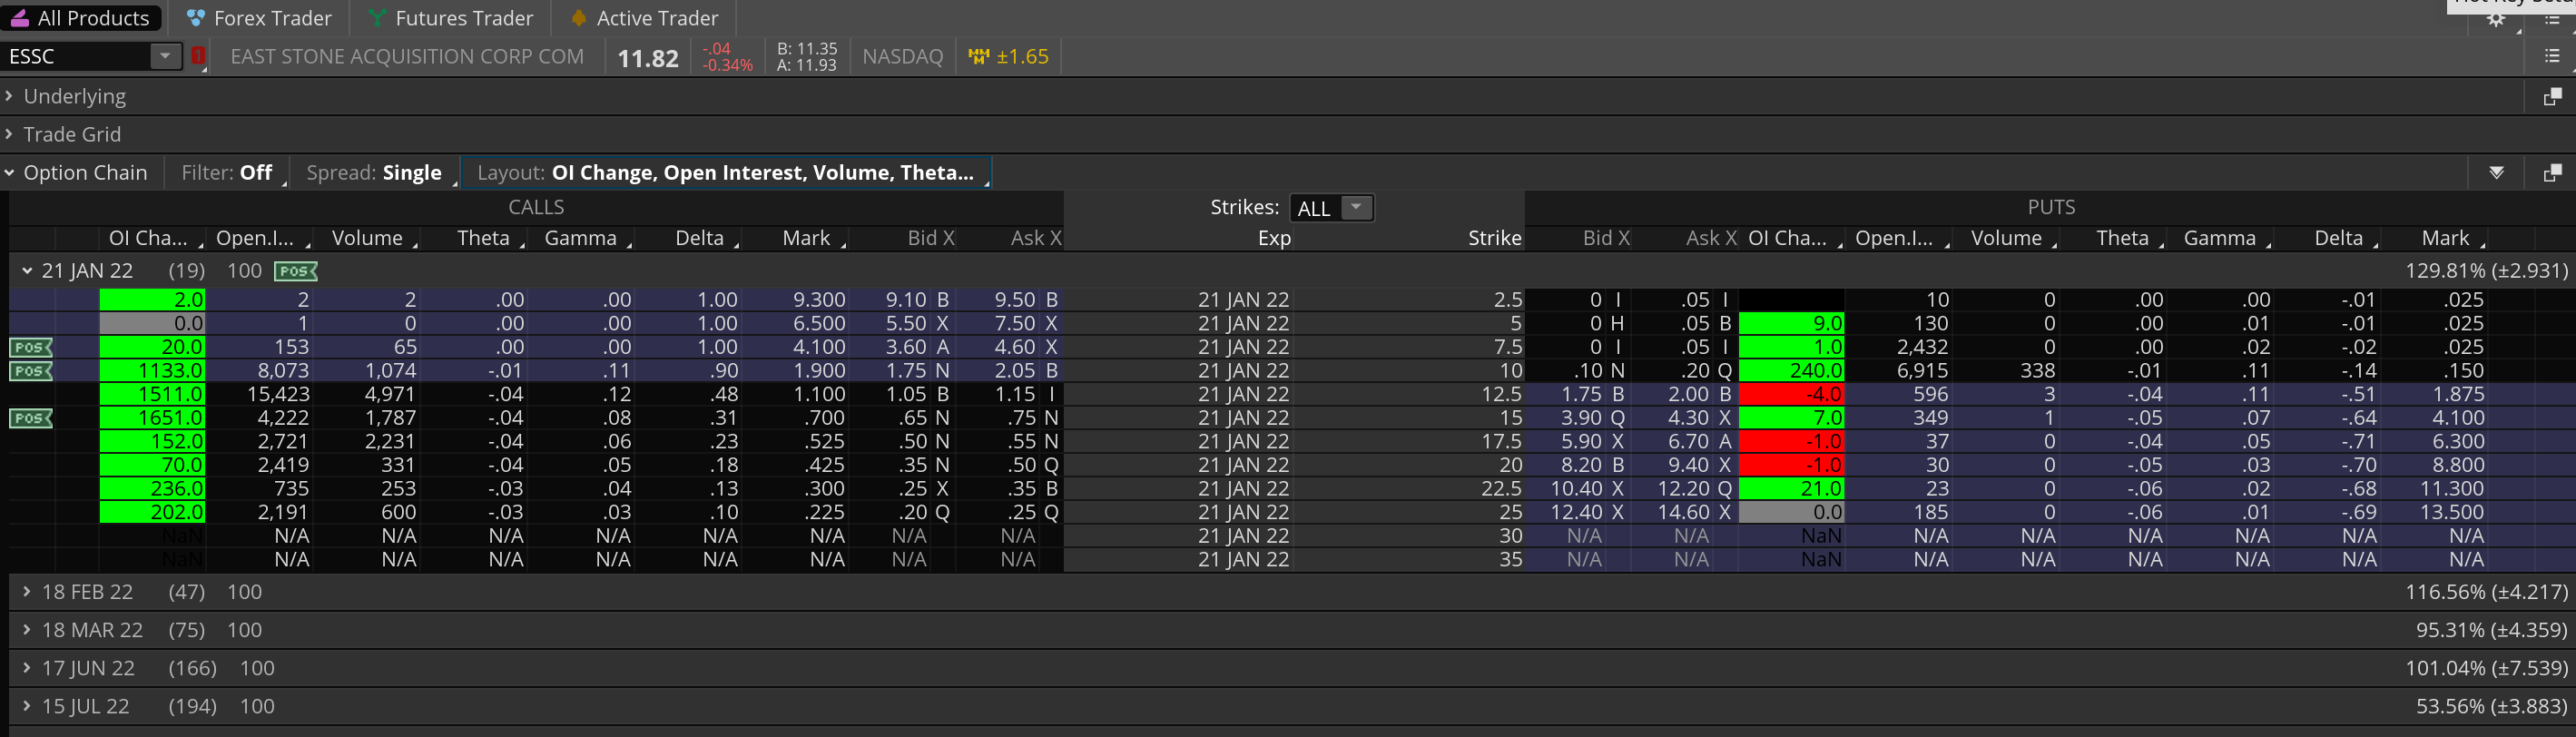
Here’s what the day change OI column looks like:
The code is:
plot OI_NetChg = open_interest() - open_interest()[1]; OI_NetChg.SetDefaultColor(color.black); AssignBackgroundColor(if OI_NetChg > 0 then color.GREEN else if OI_NetChg < 0 then color.RED else color.GRAY);
If you like’d like to add this, here’s a step-by-step with screenshots:
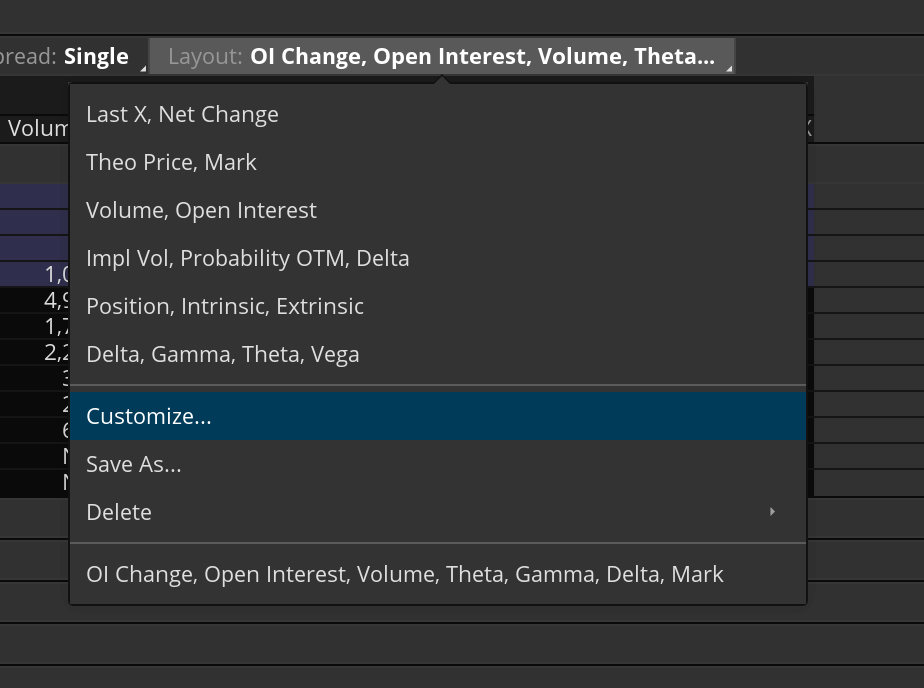
To create a custom column, click “Layout” just above the options chain, then “Customize”
In the left column, use the drop down menu to get to “Custom Quotes”
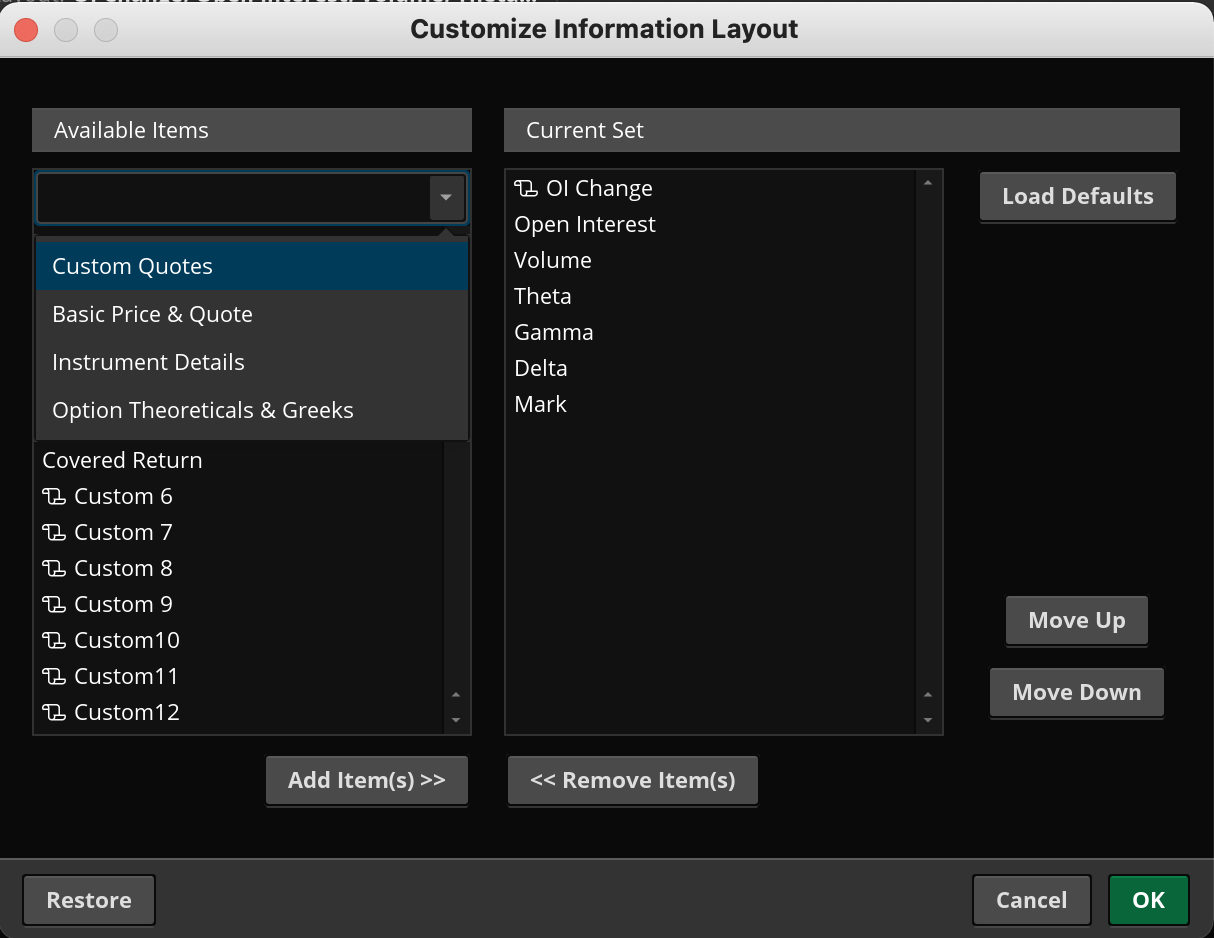
Select any “Custom x”. In the pop-up, select the tab “thinkScript Editor”, get rid of whatever is there by default, then paste the code into the box. Change the column name so it isn’t just Custom 1 or whatever.

Now just save it, put the new custom quote in your active column list, and enjoy not having to do bunch of calculus to figure out the OI change each morning…
- You can also change the colors, if you don’t like the green/red default.
Hope this helps!
-machalica
Edit: I removed the end of the original post because the code was incorrect (regarding calculating OI change from 2, or 3 or whatever, days ago, etc). And in this next code, I used the text color instead of fill color, credit to Khalidad in this comment chain.
ToS requires you to define those days first… then subtract them. Without the bracket value, it references the most recent bar (today, after it has updated); with [1], it is the bar before…and so forth.
def x = open_interest()[1];
def y = open_interest()[2];
plot OI_NetChg = x - y;
OI_NetChg.AssignValueColor(if OI_NetChg > 0 then color.Green else if OI_NetChg < 0 then color.Red else color.Gray);