Daily updates on economic data worth knowing about. Nothing posted on days without data of significance.
4 Likes
Completely agree with your key takeaway
To me, the recent data surrounding the home sale bumps suggest more confirmation of aggregate demand. As soon as rates start to stabilize or even give the impression of peaking, demand is ready to sweep in from the sidelines. I’ve posted some links over the past couple of months on this topic in housing.
Thanks for keeping up with the data! I always read these.
2 Likes
Today at 7 AM PST at the jobs opening data, which came out lower than expected:
- GOLD spiked up + DXY spiked down = recessionary
- QQQ spiked up, perhaps on algo reaction on “soft landing”, but we see it got sold off after. Perhaps by human reaction.
Recall that “soft landing” comes from the fed seeking for lower job openings coupled with maximum employment (unemployment rate rising as slowly as possible). This is something to watch this week because we have more employment data this week.
2 Likes
2 Likes
From your key takeaways it looks like higher costs coupled with a cooling economy.
Thx as always for keeping up with this.
Wednesday, August 9
- The weekly MBA Mortgage Applications Index declined 3.1% with purchase applications falling 3.0% and refinance applications dropping 4.0%.
- The weekly EIA crude oil inventories showed a build of 5.85 million barrels following last week’s draw of 17.1 million barrels.
1 Like
Thursday, August 10
- Total CPI was up 0.2% month-over-month in July, as expected, and core-CPI, which excludes food and energy, was also up 0.2% month-over-month, as expected. On a year-over-year basis, total CPI was up 3.2%, versus 3.0% in June, and core CPI was up 4.7%, versus 4.8% in June.
- There were several key takeaways from the report: (1) there were no hawkish surprises as total and core CPI were spot-on with consensus estimates (2) the shelter index accounted for more than 90% of the increase in the all items index and (3) the all items index less shelter was up just 1.0% year-over-year on an unadjusted basis.
- Initial jobless claims for the week ending August 5 increased by 21,000 to 248,000 (Briefing.com consensus 230,000) while continuing jobless claims for the week ending July 29 decreased by 8,000 to 1.684 million.
- The key takeaway from the report is that, while initial claims are still running well below recession-like readings, they moved in a direction in the latest week to corroborate the thinking that there is some softening in the labor market, which is what the Fed expects to see (and hopes to see).
- The weekly EIA Natural Gas Inventories showed a build of 29 bcf versus a build of 14 bcf last week.
1 Like
Friday, August 11
- July PPI 0.3% (Briefing.com consensus 0.2%); Prior was revised to 0.0% from 0.1%; July Core PPI 0.3% (Briefing.com consensus 0.2%); Prior was revised to -0.1% from 0.1%
- The key takeaway from the report is that wholesale inflation has come down sharply from its peak in 2022, although with the recent increase in oil and gasoline prices, there will be some concern that further improvement is going to be delayed.
- August Univ. of Michigan Consumer Sentiment - Prelim 71.2 (Briefing.com consensus 70.9); Prior 71.6
- The key takeaway from the report is that it reflected little overall change in sentiment, due in part to largely steady inflation expectations, as year-ahead and five-year expectations decreased by ten basis points apiece.
2 Likes
Wednesday, August 16
- The weekly MBA Mortgage Applications Index fell 0.8% with refinance applications falling 2.0% while purchase applications were flat from last week.
- Total housing starts increased 3.9% month-over-month in July to a seasonally adjusted annual rate of 1.452 million units (Briefing.com consensus 1.446 million) and building permits increased 0.1% month-over-month to a seasonally adjusted annual rate of 1.442 million (Briefing.com consensus 1.460 million).
- The key takeaway from the report is that the increase in starts and permits, albeit modest, was driven by single-family units, which are badly needed in a supply-constrained existing home market.
- Total industrial production increased 1.0% month-over-month in July (Briefing.com consensus 0.3%) following a downwardly revised 0.8% decline (from -0.5%) in June. The capacity utilization rate jumped to 79.3% (Briefing.com consensus 79.0%) from a downwardly revised 78.6% (from 78.9%) in June. Total industrial production was down 0.2% yr/yr. The capacity utilization rate of 79.3% was 0.4 percentage point below its long-run average.
- The key takeaway from the report is that most major market groups recorded growth in July, demonstrating that there was a pickup in activity that fits with an economy that continues to operate in a growth mode despite the Fed’s rate hikes.
- The weekly EIA crude oil inventories showed a draw of 5.96 million barrels following last week’s build of 5.85 million barrels.
1 Like
Thursday, August 17
- Weekly Initial Claims 239K (Briefing.com consensus 240K); Prior was revised to 250K from 248K; Weekly Continuing Claims 1.716 mln; Prior 1.684 mln
- The key takeaway from the report is that initial jobless claims – a leading indicator – are pacing at levels that are indicative of a tight labor market, which is indicative of an economy that isn’t pacing for a hard landing.
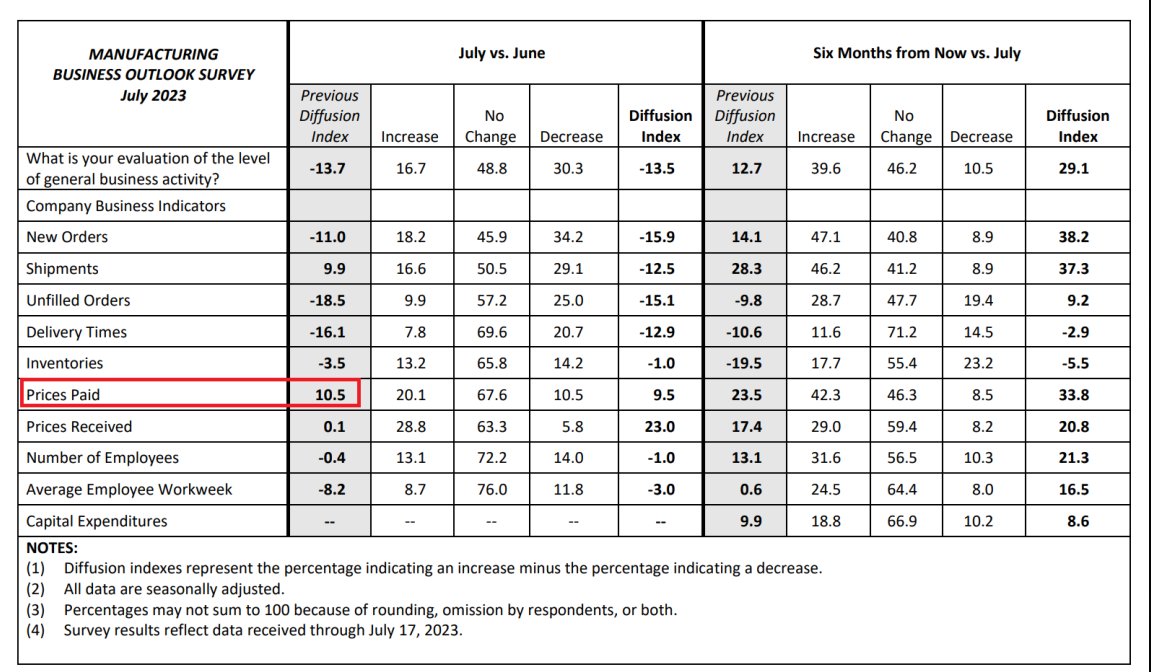
- August Philadelphia Fed Index 12.0 (Briefing.com consensus -9.0); Prior -13.5
- July Leading Indicators -0.4% (Briefing.com consensus -0.4%); Prior -0.7%
3 Likes