I’ve seen a lot of questions recently on trading SPY. I have a methodology that has worked out well for me. If you’d like to discuss what I do, feel free to get in contact with me and we can run through a private tutorial. Over the upcoming days I’ll do a write up on what I do and post it here.
30 Likes
Looking forward to this. Thank you!
1 Like
Looking forward too it too!
1 Like
To get some points started, here are a few ideas that I heard on trading floor. Feel free to correct me if I am wrong.
-
SPY relies a lot less on TA and more on news. SPY can blow through every S/R line you have if the sentiment is there. As Conq puts it, “SPY technicals can tell you where it might bounce but won’t tell you if it will bounce”
-
Yet, one trend that SPY respects are double/triple bottoms. In further out time ranges, if SPY double bottoms, there is a good chance that it will run back up once sentiment picks back up. Recent example is omicron news and how it dropped SPY with fear of lockdowns, which formed a double bottom. Once that fear was gone, SPY recovered nicely for a swing trade. You can look at Rpgeek’s swing trade post of SPY for more details.
Regarding the first bullet point - isn’t that how you would expect to apply TA to literally anything though? S/R to tell you where it might bounce, but not if it will bounce?
1 Like
Yup, but I think more so for SPY. I think SPY technicals matter a lot less compared to other tickers
Would also like the write up in this
2 Likes
Hey friends, Tedro here. I appreciate the patience on this. I have been sick the last few days and haven’t had the energy to do much more than lie in my bed. Even yelling obscenities at my cat was exhausting. Have no fear, I’m feeling better and my cat has once again been berated.
I like to trade SPY pretty regularly when I just cannot get a good feel on other tickers or I have money tied up in things and I can usually make a quick buck on the SPY trades with my lower funds. I’m going to show you my method I use. Please keep in mind, that this makes sense to me and it might make sense to you but I really want you to figure out a methodology that works for you. My intuition will be different from you and at the end of the day, you need to trust your gut and your own instincts because it’s your money.
I originally learned this technique from someone that learned it from Kryptek. So, in some way, shape, or form, this is something that Kryptek has used as well. I use different indicators because they make more sense to me.
I typically buy SPY weeklies and I normally choose a strike just outside the money. For example, if SPY is trading at $470 on December 22, then I will buy a $471 or $472 strike for December 27 or December 29. Basically, I’ll take the first strike just OTM and the next weekly that is not an FD.
My broker is Fidelity. I just started using it one day and their desktop software Active Trader Pro. It’s stuck in the 1990’s visually but I learned it and I don’t mind it overall. My charts are going to look outdated so I tried to make them a little easier on the eyes with different colors. I am sorry if I burn your retinas.
Prerequisite Rules
There’s a few things to keep in mind when trading SPY. I’ll list them out before going further into how I trade SPY
- SPY is pretty heavily influenced by the news. Not always all news, and sometimes what you might think is bad news ends up sending SPY up 3% and what you might think is good news ends up tanking spy 5%.
- Because of this, I rarely every hold SPY longer than a single day. I can probably count on one hand the number of times I’ve held SPY over night. Because of how quickly news can change SPY, I’m normally holding SPY for less than an hour per position. Keep in mind, I might open the same position multiple times in a swing method (more to come on that).
- Sometimes I just cannot get a good read on SPY. Those are days I just walk away from SPY. It can be fickle and revenge trading is the last thing I want to be doing.
Charts and timeframes I use
I keep three charts open for SPY as follows:
- 1 minute day chart. I use the 1 minute chart to tell me what is happening in the shortest time frames.
- 5 minute day chart. This is my main chart. I make my SPY decisions to open/close on the 5 minute chart. I use the 1 minute chart to see what is happening inside the 5 minute candles
- 1 minute 3 day chart. This is a small chart in the lower corner of my screen. I like using this one not only to see how SPY is doing over the course of a few days, but it also helps me see if SPY performance is impacting any other tickers I’m currently watching.
Indicators I use
I am going to list all the indicators I use, then I am going to list what I’m using them for. Finally, I will explain which ones I watch closer and why I give them more importance over other indicators.
- Bollinger Band 20 day period, Standard Deviation 2
a. SPY will almost always (there is always exceptions) honor this Bollinger Band (BB) setup. If it tracks the upper band for a few candles, it’s likely about to pop up. If it tracks the lower band, there is a good chance it’s going to drop for a few candles. - Parabolic SAR (PSAR). Acceleration Up .02; Acceleration Down; .02 Max .20
a. I use PSAR alongside with Bollinger Band. This way I can see how quickly the rise and falls are in comparison to the BB. It can predict faster movements than BB so if I see a larger arch forming or the dots are further apart, I know SPY is moving fast. - EMA 20, Modern
a. I use this to help track what I’m seeing inside the BB. SPY honors the 20 EMA pretty significantly. If it is above the EMA, we’re heading into a bull run. If it’s below the EMA, we’re usually about to see a dip. - RSI, 14 period, Overbought level 70; Oversold level 30
a. “RSI Before You Buy” is a post-it note I had on my monitor for a few months. I use RSI to help me time my entries. If I like how the charts are looking, I check RSI. RSI can get below 30 and above 70. If RSI is above 50, I typically will wait for a better entry as it’s likely SPY is about to head back down. If RSI is at or above 70, we’re likely on a bull run and it’s a horrible entrance. If RSI is anywhere near 30, that’s usually a good time to get in. Typically with RSI, 30-50 is a good entry. - MACD Period 1 (12), Period 2 (26), Signal Line (9)
a. Honestly, I cannot remember why I chose these specific numbers but they work well. Basically, MACD is a good tool to use alongside RSI. If they’re matching, you’re likely at a good entry to either buy or sell. MACD is also great because it tells if the ticker is likely to go up or down. If the MACD line crosses over the Signal line, this means MACD is heading up and we are likely to see SPY also go up. If the Signal line crosses over the MACD line, this means that SPY is likely to go down. - Volume. I keep an eye on Volume but I do not pay much attention to it when it comes to SPY.
- Price Action. Yes, it’s corny to list but it’s true. Keep an eye on the actual price of SPY and you will be able to determine pretty quickly if SPY is overall going to be a green day or a red day.
My Order of Indicator Use
-
I am watching MACD pretty much constantly. I’m waiting to see how the lines are moving and which way I think SPY is going.
-
I use RSI to confirm what I’m seeing on MACD. If RSI and MACD are lining up, this is likely my signal to buy or sell
-
I’m watching the SPY candles and how they are moving inside the Bollinger Band. If the candles are in the middle, MACD will tell me which way we’re going. If the candles are at the top of the BB band, I’m likely making money. If the candles are at the bottom of the BB band, I’m likely buying more.
-
If MACD and RSI are not playing well together and the candles are in the middle of the BB without knowing which way SPY wants to go, I look at EMA. If SPY is below EMA, I’m likely going to either buy, or wait to see if SPY drops further. If we’re above EMA, we’re likely about to move up.
-
However, I don’t use EMA until I see what PSAR is doing. If PSAR is below the candles but looks like it’s heading up, I’m buying. If PSAR is above the candles and looks like it’s heading down I’m selling.
-
NOTE: I probably use PSAR and EMA the least as I can normally get a good grasp on what is about to happen from MACD, RSI, BB and price action. I’ll use EMA more than PSAR but your mileage may vary.
Chart examples
I’m a visual learner and reading about charts is stupid if I have no idea what I’m actually supposed to see. So, here’s a few examples of my charts and how I would have played them.
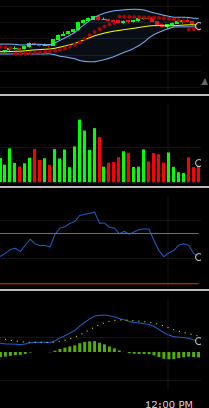
This is my cute little 3 day chart. I use EMA only on this one. I just like to keep an eye on SPY all of the time.
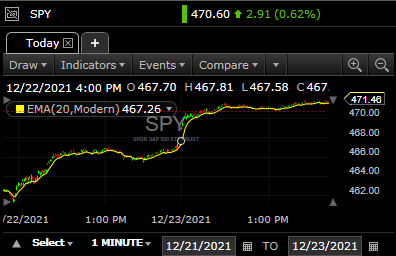
This is my 1 minute, 1 day chart. I don’t normally keep it this zoomed out

This is my 5 minute, 1 day chart. This is my decision making chart

Let’s take a look at 21-December between 10:00am and 12:00pm on the 5 minute chart

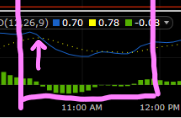
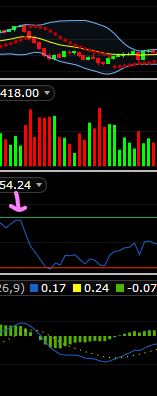
First, look at the bottom of my chart where I have MACD, see that Blue solid line? That is my MACD line and the Yellow dotted line is my Signal line.
When that blue line crosses at a downward angle like we see at around 10:30 am, that’s the indicator that we are about to drop down in price.
Now, look at where RSI indicated that overbought top signal right near 70, now look at where MACD crossed into that downward pattern. This is what I like about RSI plus MACD.
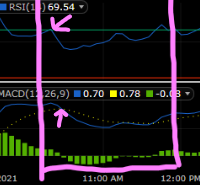
Going back to the further out zoom, look at how RSI and MACD line up with EMA. What you see, is even though we had that drop, SPY simply went back to the EMA and then bounced right back up and stayed just above the EMA most of the day.

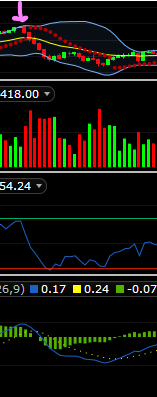
This is what that same time frame looked like on the 1 minute chart. This is from 10:23am to about 10:42am
From here, you can see SPY touched the top of that Bollinger Band
RSI was at Overbought (70)
And the blue MACD line was higher than the yellow Signal line
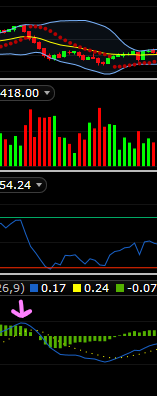
Do you see how the indicators all work together to tell the same story in different fragments? By using them together, I can better time my SPY entries and when I want to sell my SPY positions.
Here’s how the same day looks on the 5 minute candle during an uptrend right around 11:30am
You can see the blue MACD line crossed over the yellow dotted Signal line and SPY had a good updtrend after that crossover
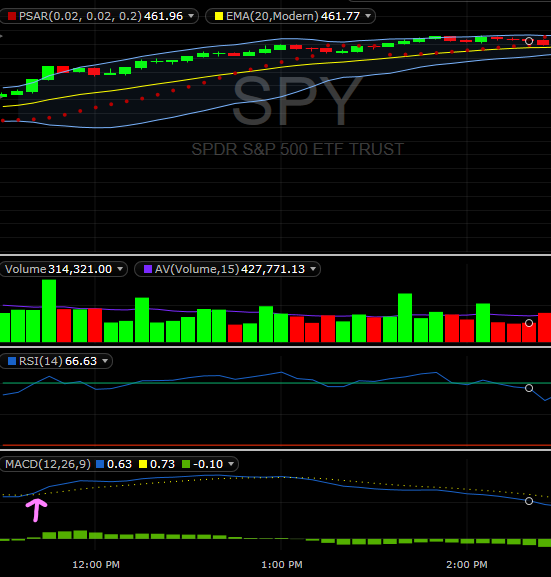
However, take a look at RSI, and see how it stayed in that upper 60 and even went above the 70 mark several times. Overall, I wouldn’t take this as an entry point for me but you can see how the indicators look during an uptrend.
Here is how that same time period looked on the 1 minute chart
As you can see, MACD crossed over, the candles were at the top of the Bollinger Band and well surpassed EMA. Once again though, considering where RSI is, even though this was a good run, I wouldn’t have considered it a good entry. Although, if you bought at the beginning of that run and sold the peak, you would’ve made good money.
I’ll keep an eye out for some better charts as SPY has not been very exciting lately. Seeing the bigger swings with SPY helps understand some of the indicators a bit better.
You Can Practice Timing Entries with Old SPY Charts
One thing I like to do (no really, I do this pretty regularly) with my charts setup the way I have them is type in some random ticker and put a piece of paper on my screen. I will simulate the ticker movement by slowly moving that piece of paper from the far left part of my chart to the right just like it would during the normal trading day. I’ll try to call out what I think is a good entry to buy and a good entry to sell based on what I see at the current moment. It’s a good way to try to get some practice with your indicators before using real money.
Final thoughts
Just because these indicators and method works for me, does not mean it is going to work for you. You may have read this entire post and now have more questions than you did before. Or you might have read this entire post and now think I’m overcomplicating things. Whether it’s this post, a small portion of something I showed you, or a completely different method that makes more sense to you. As long as you are doing something that makes you successful, that’s all that matters in the end.
Feel free to drop your questions here or on the Discord. I’d be happy to answer!
29 Likes
Thanks for taking the time to post this!
2 Likes
Thank you for this post. This will take a little time to digest. I will try to reach out once I have questions.
SPY broke through its last support of $450 with ease. I’m expecting SPY to come down to test that $426 support this week. And at the rate it is falling, that test looks like it will fall in line perfectly with the Fed talks on Tuesday 01/25 and Wednesday 01/26 because the way the fall has been occurring the last few days, I’m looking at SPY to open on Monday 01/24 at $434, run up to around $438 during the morning, and then slowly trickle down to a EOD close around $432. That would set up perfectly for that possible $426 test on Tuesday during the Fed meeting.
7 Likes