I’ve been mainly using Bollinger Bands (BB) and RSI to track SPY and other tickers throughout the day, keeping two charts open on the 1 and 5 minute. Recently, I started looking at the 20-day Moving Average (MA) as well (which is another short term trading indicator).
I’ve heard people discuss when the lower BB is tested, paired with a drop on RSI below (at least) 30 on the 1 minute (and 5 minute if you’re “lucky”), an entry may present itself. Now channeling my inner risk averted self (whom I haven’t seen a whole lot of lately LOL), it tells me a THIRD indicator signal added on could make your entry even clearer (and more profitable).
Typically on SPY (remember we’re talking 1&5 min), when you see a drop below the 20MA, it doesn’t stay down there too long and you see it pick back up to touch or rise abode the 20MA within a short period of time (5-20 mins).
Now I say this all barring larger downward momentum, so you have to keep your eyes on the news during the day (too much going on right now)
The Signal:
- On the 1 min chart you need to see lower BB tested, RSI at or below 30, and the price below the 20MA
- On the 5 min chart you need to see lower BB tested (or CLOSE), RSI at or below 30 (or 50*, I’ll explain later) and the price at or below the 20MA
*I say below 50 on the 5 min for RSI because I noticed another way to analyze this that I think needs further research. When RSI drop 20-30% on the 5 min, this can also support the signal you see on the 1 min (which avoids you “missing” the overall signal)
There were two cases I played SPY today that resulted in a “win” using these guidelines “loosely” (note it didn’t exactly trigger all of these signals perfectly, but we’re not looking for perfection, just a solid win rate, and conviction)
The first signal was around 2:46pm today on the SPY and again at 3:24pm (I don’t have any experience charting so apologies for not being able to grab these screenshots to add here). The first play resulted in a 17% gain and the second signal would’ve produced similar but I was “scared” and pulled my money out sooner for only about 5% gains.
I’d love to hear any thoughts on this as I’m sure I’m not the first to think of this but wanted to share since I brought it up in VC and some people sounded interested.
2 Likes
Thanks for taking the time to type this up.
For me, these indicators only serve as half of my strategy bias.
I too started noticing patterns within these indicators to make decisions when I first started out, but as you go on you realize that they are lagging and only help you in determining the probability of a play going your way, they’re not an assurance in my experience.
You have to be careful - in economics they teach that correlation does NOT equal cause. Just because RSI is low (on any timeframe) does not mean that when it comes back up you’ll be profitable. For example, on a downtrend you could buy in when RSI is 30 or less but a swing towards 50 could just mean consolidation before a continued drop in price.
I use multiple indicators to help form a thesis and increase the probability of my thesis being correct.
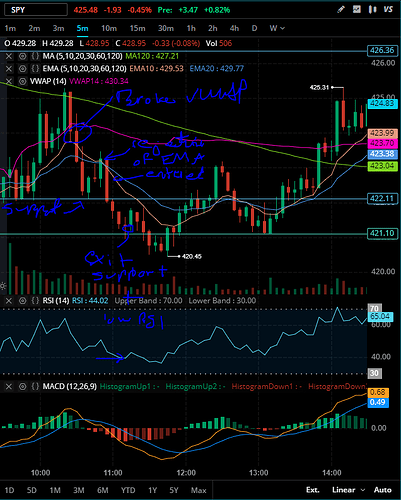
For example, on a downtrend, after a decent drop I wait for it to retest VWAP or a significant price level, combine it with RSI and MACD to gauge potential momentum and then make a good short entry.
Small trade buying calls on SQQQ yesterday while looking at SPY levels
As you can see, it went a bit below that support line before climbing back up but the probability of it bouncing at the level (and looking at the levels of current indicators to confirm my thesis) are kind of high so I decided to get out with a small profit.
2 Likes
Thank you for the reply! I really appreciate the added insight as it felt like my view was fairly simplistic. I completely agree you have to be careful here because absent any information the signal is actually pointing towards bearish. I see this working on weeklies if your trying to play the bounce (even in a downtrend) really quickly. I think you just avoid trying this with stocks showing a larger downtrend (I know the title said SPY but curious to try this on other stocks with lots of volume). I’m also curious how you can play the opposite with puts when RSI is knocking on 70+, etc.
I’ve been trying to pull up VWAP on fidelity’s active pro trader, do you know where this is or any “free” platforms to track this? I assume VWAP is on TOS and I really need to open an account there but for now I’m on fidelity.
1 Like
Try TradingView. It’s free but limits you to a few indicators.
1 Like
Yes this has it, thank you!
