One thing I wanted to share is my view for trading:

I’ve used a lot of indicators in the past, but what I usually base my levels and entries/exits on is pretty simple.
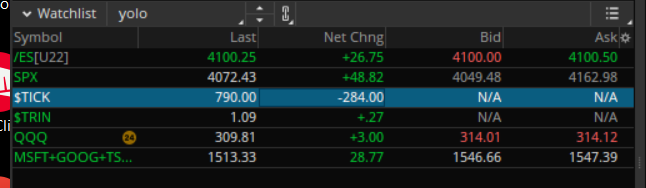
For momentum, I use $TRIN and $TICK. Maybe TTM if I need extra confirmation.
TRIN is essentially an indicator that shows sentiment based on volume. TICK is an indicator based on the delta of winning stocks vs losing stocks.
In the simplest terms, a low TRIN + high TICK means it’s bullish, while a high TRIN + low TICK means it’s bearish.
Another indicator I use to understand my levels is DOM - short for Depth of Market.
What you see in the image is the bid, ask, and the volume associated at each point. If you scroll up and down, you’ll see ‘batches’ of volume. It’s in these areas that we consider supports and resistances, depending on the current direction of the market. It’s at these levels where I can enter or exit positions, regardless of where the ticker goes after either breaking through or failing the breakthrough.
sidenote: E-mini is what I use for my spx levels considering SPX is an index, not a tradeable ETF.
In the end, we all trade using what works for us, and this has worked for me the best. It’s also extremely simple to understand and visualize, without having to do many napkin math equations. I only know how to set this up in TOS but I’m pretty sure it’s available on any robust trading app.