Parabolic Stop and Reverse (PSAR) is an indicator that I see a lot of people ask about but not many people seem to understand. I am going to do a quick write up of what PSAR is and how to use it in your daily trading.
The Parabolic SAR is a technical indicator developed by J. Welles Wilder to determine the direction that an asset is moving, or the direction of a trend. It is a lagging indicator, which means it measures factors after other correlated changes. Other lagging indicators include MACD and RSI.
PSAR is used to identify potential reversals in the price movement of traded assets. I like to use it more as an ENTRY SIGNAL generator and I have recently tried using it as a TRAILING STOP LOSS indicator.
This is what PSAR looks like with the Daily 1-minute chart on SPY for February 22, 2022. You will see the red dots ABOVE and BELOW the candles. Fidelity defaults to this red/maroon color so that’s the color I am going to use but feel free to change this color to whatever you would prefer. I also use the default input settings.
So, let’s start with the basic strategy that I use. Then we can discuss some of the ways to determine false signals and how this can be used to time better entries and get better fills on your orders.

BASIC STRATEGY
When PSAR is BELOW the candles, the market should be considered in an uptrend. When PSAR is ABOVE the candles, this market should be considered in a downtrend.
If we zoom a little bit on SPY to 2:25pm on February 22, 2022, when you see that first red dot appears on the bottom of the candle (pink arrow). That would be a good spot to enter a call (or buy shares) as PSAR is indicating a reversal into an uptrend.
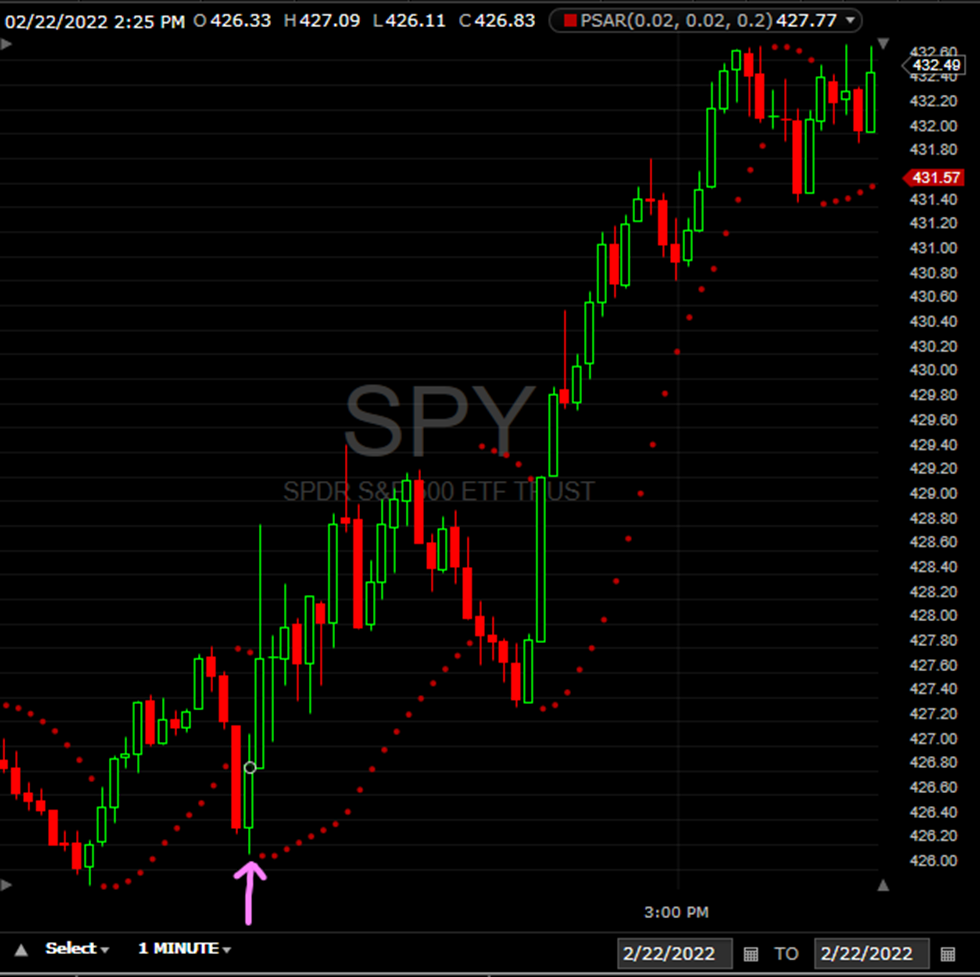
Alternatively, when PSAR had the first red dot first appears on the top of the candle (orange arrow) at 1:35pm, that is an indicator of a reversal into a downtrend. That would be a good spot to exit your calls, sell your shares, or enter a put position.

As I stated previously, PSAR is a lagging indicator, so make sure you wait for the candle to be completed before you make an entry. You should also be trying to time opening your position near the closing of the candle.
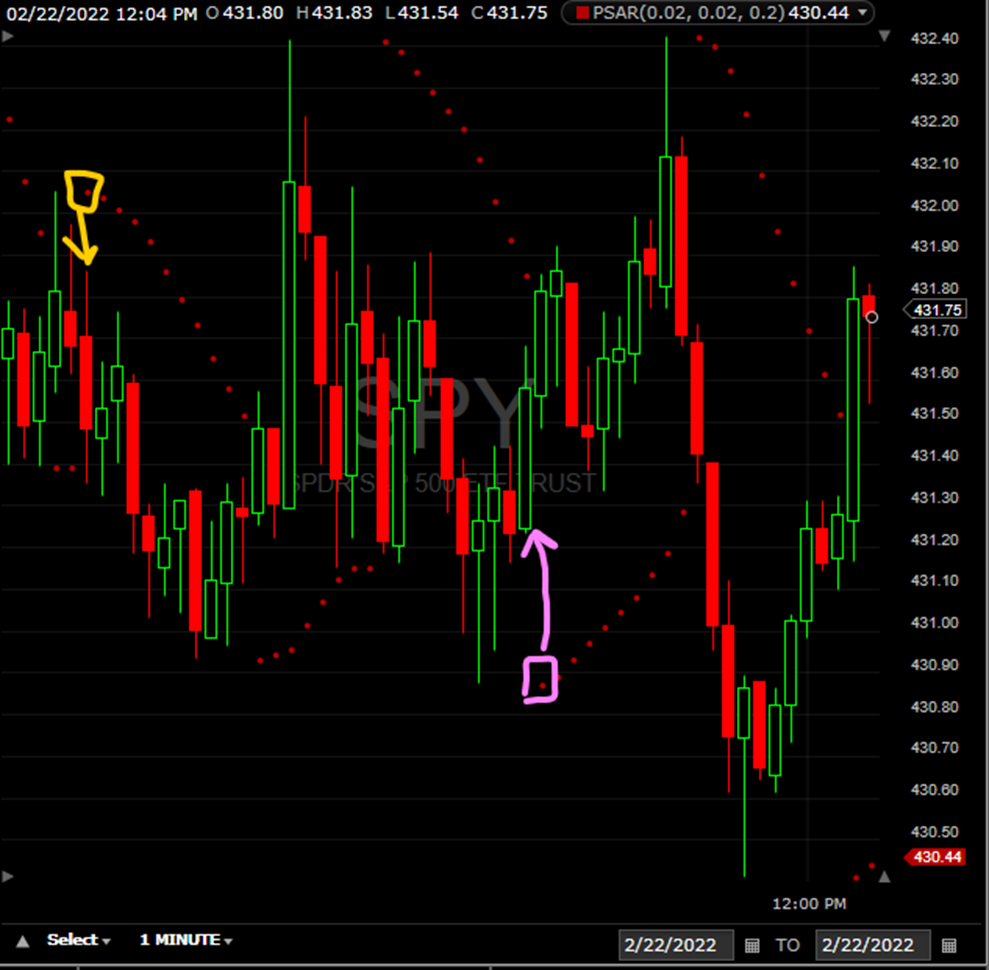
Here’s some other examples from around 11:00am on February 22 where PSAR indicated several different reversals to the current movement:
Like I mentioned earlier, you can also use PSAR to help determine stop losses. Using the same chart, we can see where stop losses would be (please excuse my line drawings, I’m doing this freehand!).
Also, you can trail your stop loss using PSAR. If you have calls, set your stop loss just below the dot. If you have puts, set your stop loss just above the dot.

Spotting False Positives
As with all indicators, sometimes you will see false positives. It is very important to know how to identify false positives, so you do not take a risky position.
To help with this, I like using EMA. A lot of people use 20 EMA and in my previous SPY thread, I did too. Recently, I switched to an 8 EMA as it makes the averages a little tighter while still taking volatility into consideration.
My EMA is Yellow, so keep that in mind with whatever tool you are using. On that same chart from earlier, the EMA will help determine the direction of the long term trend. EMA acts as a strong support or resistance on a trend.
If the market is trending upwards, the EMA will act as a support. If the market is trending downwards, the EMA will act as a resistance.
Also, keep in mind, if the price is above the EMA, the market should be considered in an uptrend.
Conclusion
If the price is above the 8 EMA, it is a good time to take a call. When the dots flip below the candle, it is time to exit (if you didn’t already) and consider a put position. Remember to wait for the candle to be completed because PSAR is a lagging indicator.

If the price is below the 8 EMA, we will only look for a put entry. When the dots flip above the candle, it is time to enter a put position. Set the stop loss above the dots. Again, wait for the entry candle to complete before taking a position.

TLDR
- Parabolic Stop and Reverse is a method to find entry signals.
- On most trading platforms, PSAR will look like a series of dots.
- PSAR dots flip when the price stops and changes direction.
- If the dots are below the candles, the market is in an uptrend
- If the dots are above the candles, the market is in a downtrend
- Do not take a position until the entry candle is completed
- Be sure to enter at the closing price
- Do not take every entry signal given due to false positives
- Watch EMA and price action to help indicate false positives