Disclaimer
This post is not me teaching how to use VIX, but rather as as generic thread to gather insight and commentary about VIX and therefore, I’ve categorized it as Research & Analysis instead of Education. Mods can edit/move the post as they see fit.
Context
I’ve been trying to read up on VIX a bit more because I thought I knew “enough” until observing it recently in relation to market movements.
My summary of my understanding is as follows, after some quick reading:
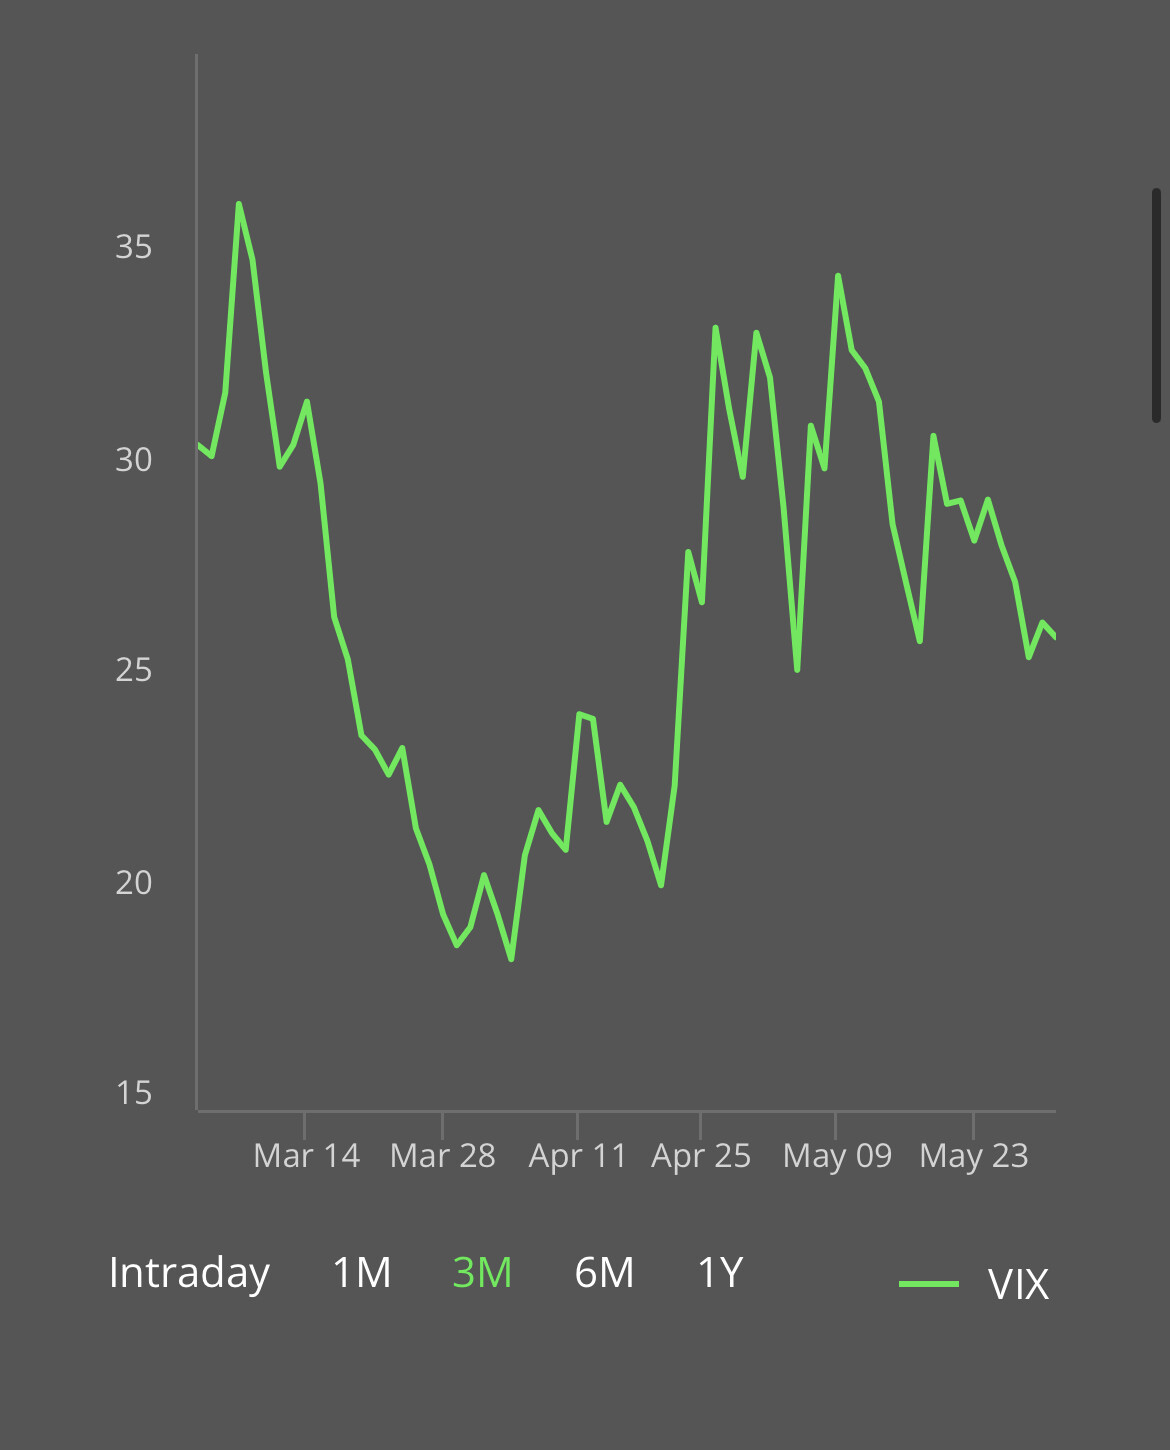
- It’s a fear sentiment. VIX >30 means peak uncertainty. VIX <20 means stable market, generally bullish(?)
- VIX is calculated using SPX options prices <30dte
- High IV on options = high VIX
- High VIX means options market is pricing in big swings both up and down
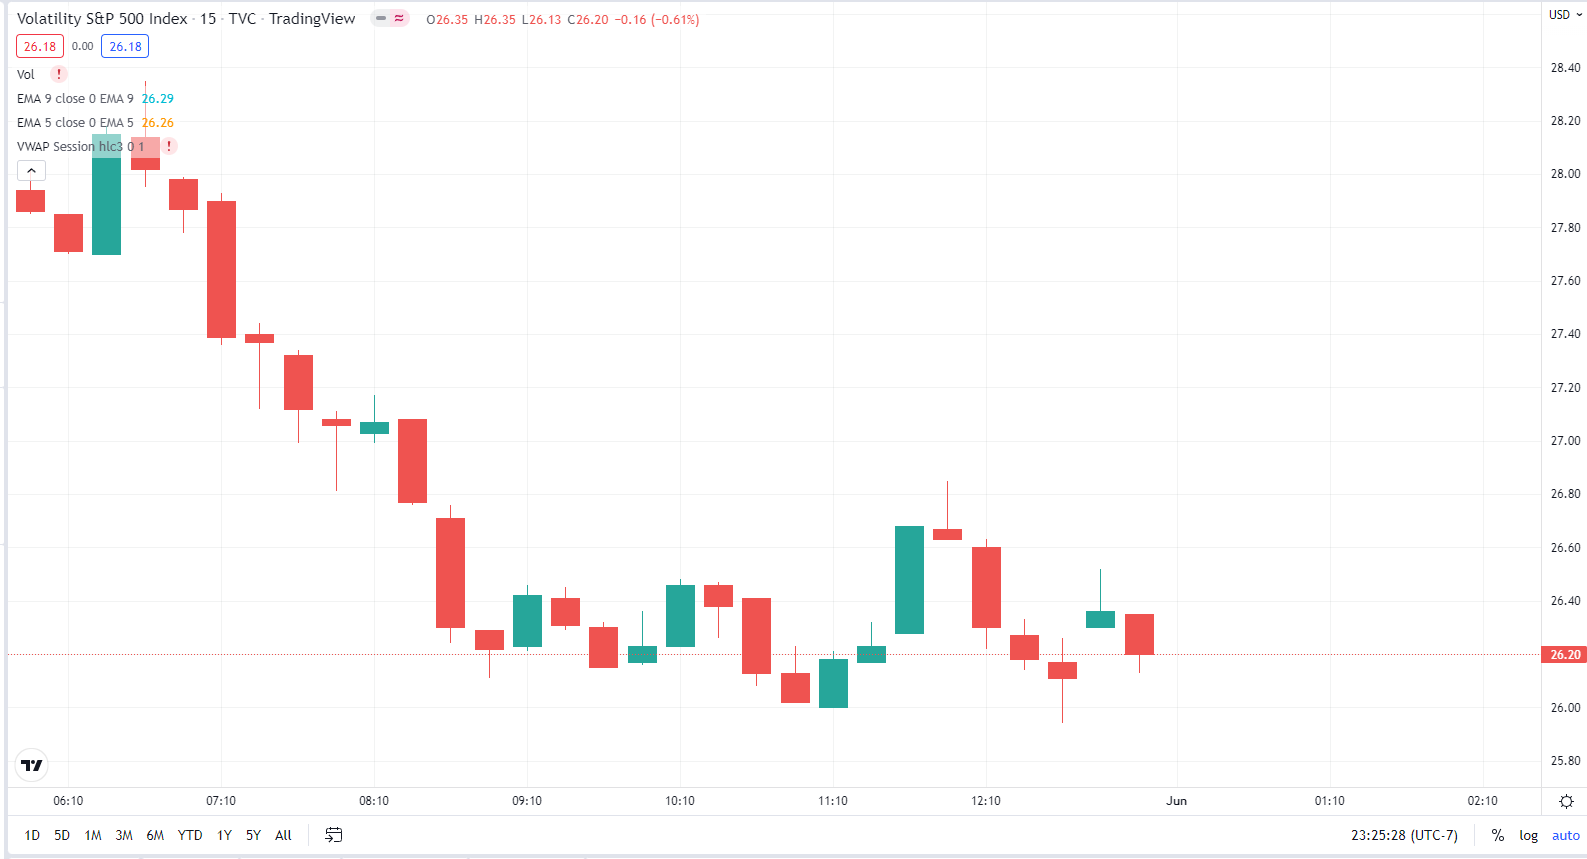
But then why was VIX down today when market was choppy? Shouldn’t it be relatively higher than the previous days where the market was stable and going up? Is it because options traders are not necessarily following along, in particular, SPX <30dte traders? VIX did gap up at open, but gapped back down intraday despite increased volatility and more bi-directional swings (relative to previous days).
And if this is the case, does it imply that during these times where options market is not as active, that “support” and “resistance” of VIX key levels don’t really matter? How does it affect the way we should look at VIX intraday as an indicator of market movements?
VIX - May 31 chart, 15m
SPY - May 31 chart, 15m