Webull is the recommended zero fee trading platform. The charting available is fairly robust, but there are a few indicators available on other platforms, e.g. Think or Swim, that you can not get in Webull. One solution is to just get a TD Ameritrade account for Think or Swim. The other solution is try and port over the indicators into Webull.
The web version of Webull allows custom scripts to be loaded and used. The negative is you can not access it on mobile or the desktop app. With those caveats, I’ve worked on porting over a few indicators that have passed through discord. I’ll continue to update these as time passes, and I’m willing to add any if there are requests.
How to create a custom script:
- Open up your web Webull version
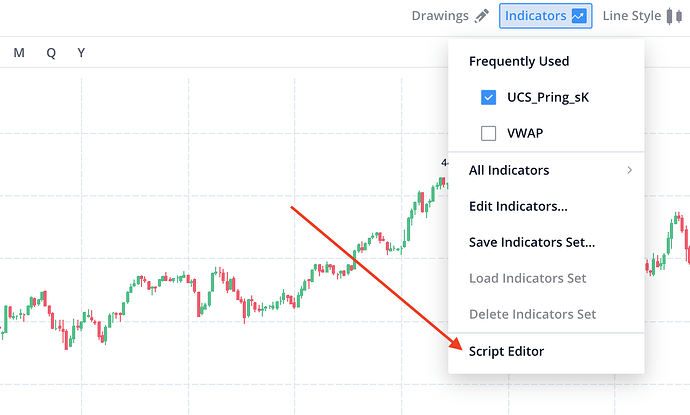
- Open a chart of a ticker, and click on the
Indicatorsbutton in the upper right corner - Click on the bottom entry titled
Script Editor. - Create a new script and copy/paste the scripts available here.
- Title and save chart.
Some warnings:
- These are usually ported over from other versions I’ve found over the web, so they may not match ToS’s indicators exactly. YMMV
- Most important thing to remember. A single indicator is not the tell all for how an asset will behave. Use these with caution. It is a good thing to use many different tools to strengthen analysis.
Questions or comments let me know!
Martin Pring’s Special K
Source and background:
- UCS_I_Martin Pring's Special K — Indicator by UDAY_C_Santhakumar — TradingView
- ChartSchool | ChartSchool | StockCharts.com
Description: Combines short-term, intermediate and long-term velocity into one complete series
Function:
- Primary Trend Reversals at a Relatively Early Stage.
- Timing Short term Price Moves.
Notes about usage: Requires at least 725 bars to calculate this correctly. Webull’s web version lazy loads bars in small time frames which may prevent Pring’s from working correctly till you scroll back in time and have more data loaded. You will notice when you scroll back to the most recent time frame the indicator will start to load.
//@version=1
study(title="Martin Pring's Special K", shorttitle="UCS_Pring_sK")
// source: https://www.tradingview.com/script/ijM9W11O-UCS-I-Martin-Pring-s-Special-K/
// https://school.stockcharts.com/doku.php?id=technical_indicators:pring_s_special_k
a = input(100, title = "Smooth" )
src = input(close, title="Source")

roc(src, length) => change(src, length) / src[length] * 100
pring_slope(src) => (src - src[10]) / 10

roc1 = (sma(roc(src, 10), 10) * 1)
roc2 = (sma(roc(src, 15), 10) * 2)
roc3 = (sma(roc(src, 20), 10) * 3)
roc4 = (sma(roc(src, 30), 15) * 4)

roc5 = (sma(roc(src, 40), 50) * 1)
roc6 = (sma(roc(src, 65), 65) * 2)
roc7 = (sma(roc(src, 75), 75) * 3)
roc8 = (sma(roc(src, 100), 100) * 4)

roc9 = (sma(roc(src, 195), 130) * 1)
roc10 = (sma(roc(src, 265), 130) * 2)
roc11 = (sma(roc(src, 390), 130) * 3)
roc12 = (sma(roc(src, 530), 195) * 4)

osc = roc1+roc2+roc3+roc4+roc5+roc6+roc7+roc8+roc9+roc10+roc11+roc12

plot(osc, color=pring_slope(src) < 0 ? color.red : color.green, title="Martin Pring's Special K")
plot(sma(osc, a), color = color.blue, title = "Smooth")
hline(0, title="Zero Line")
TMM Squeeze
Source and background:
- TTM Squeeze (thinkorswim default) — Indicator by OgiK — TradingView
- ChartSchool | ChartSchool | StockCharts.com.
Description: A volatility and momentum indicator introduced by John Carter of Trade the Markets (now Simpler Trading).
Function:
- Capitalizes on the tendency for price to break out strongly after consolidating in a tight trading range
Notes about usage: There are several types of smoothing that can be used on the momentum oscillator. I believe the type used by ToS is a linear regression smoothing. Because Webull web uses a restricted version of Pine Script, it is missing a linear regression function. I’m looking into adding this back in. The closest I’ve found to be like ToS is EMA, which I put as the default.
//@version=1
// source: https://www.tradingview.com/script/b5imi7GG-TTM-Squeeze-thinkorswim-default/
study("Carter TTM Squeeze", shorttitle="TTM Squeeze")
source = input(close, title="Source")

length = input(title="Length", type=input.integer, defval=20)
kcMult = input(title="Keltner Channels Multiplier", type=input.float, step=0.1, defval=1.5)
useTrueRange = input(title="Use True Range for Keltner Channels?", type=input.bool, defval=true)
bbMult = input(title="Bollinger Bands Multiplier", type=input.float, step=0.1, defval=2.0)
smoothType = input(title="Smoothing Type", defval="EMA", options=["None", "EMA", "SMA", "VWMA", "WMA"])
smoothLength = input(title="Smoothing Length", type=input.integer, defval=14)
widthRatio = input(title="Width Ratio Alert", type=input.float, step=0.1, defval=1.0)
src = input(title="Source", type=input.source, defval=close)

// Keltner Channels (by Chester W. Keltner)
basis = ema(src, length)
avgrange = ema(useTrueRange ? tr(true) : high - low, length)

kcUpper = basis + kcMult * avgrange
kcLower = basis - kcMult * avgrange
// Width
kcw = 2 * kcMult * avgrange / basis

// Bollinger Bands (by John Bollinger)
mean = sma(src, length)
stdev = stdev(src, length)

bbUpper = mean + bbMult * stdev
bbLower = mean - bbMult * stdev
// Width
bbw = 2 * bbMult * stdev / mean

// Momentum
mom = change(src, length)
 iff(smoothType == "WMA", wma(mom, smoothLength), mom)
// Smoothing
hist = iff(smoothType == "EMA", ema(mom, smoothLength),
     iff(smoothType == "SMA", sma(mom, smoothLength),
     iff(smoothType == "VWMA", vwma(mom, smoothLength),
     iff(smoothType == "WMA", wma(mom, smoothLength),
     mom))))

histColor = hist >= 0 ? (hist[1] < hist ? #0aa9a9 : #190ba6) : hist[1] < hist ? #a8a80b : #a70a0a
plot(hist, style=plot.style_columns, histbase=0, color=histColor)

dotColor = bbw / kcw <= widthRatio ? color.red : #00ff00 // bbUpper <= kcUpper or bbLower >= kcLower ? red : #00ff00
plot(0, title="Squeeze", style=plot.style_circles, linewidth=1, color=dotColor, opacity=0)

 .
.