Mimir’s short interest output includes two “DTC calculations”, the first of which is traditional DTC and the second is ConqDTC. I’m going to quickly explain the difference between both methods to help people better understand why normal DTC sucks.
Normal Ass DTC
The normal DTC calculation is the current number of shorted shares divided by the average volume of the last x number of days:
Total Shares Shorted / Average Daily Volume
ORTEX for instance defaults to 3 months but also offers 2 weeks. The problem with these calculations is that they are assuming that the volume will remain consistent, which anyone that has ever seen a “squeeze” before can tell you isn’t the case.
Therefore if we’re simply calculating DTC with recent volume the calculation is almost worthless because it won’t tell us how long it would take them to clear correctly based on the normal volume we’d expect in a squeeze.
Normal vs Squeeze Volume
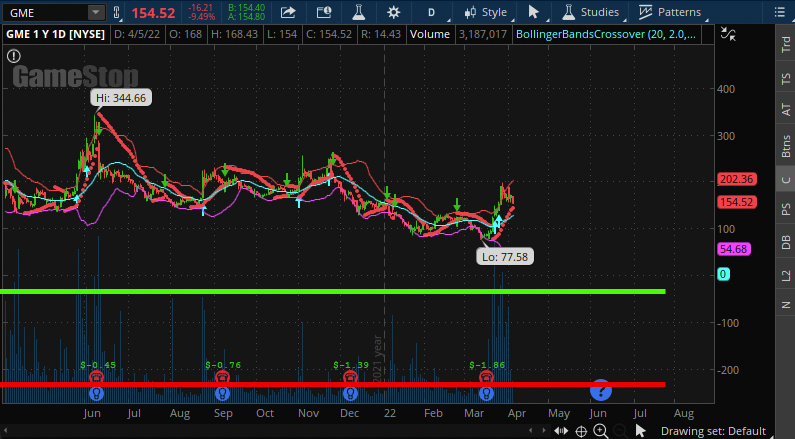
So to solve this, I’ve broken volume into two categories because most stocks seem to have two “modes”. There’s normal volume which is what the stock does when it’s doing fuck all. These volumes are usually low and about the same so your DTC calculations will always look super high per traditional calculations if you’re pre-squeeze, however, there’s another mode; squeeze volume. In the graphic below, normal volume is marked by the red line and squeeze volume is marked with the green line:
So if we’re looking to calculate how many days it would take to cover a position, we should be using the volumes that we’d expect if they were to do so. This is where my calculation comes in.
ConqDTC
My calculation takes the 10 highest volume days of the last 6 months to calculate average daily volume… in a squeeze. This method solves the problem traditional DTC has with being inaccurate when volume starts to rise, however, there is one other issue that we haven’t touched on and that’s the fact that traditional DTC assumes every share can be used for clearing. This is obviously not the case. So in making my calculation, I also averaged out the typical percentage of volume that can be used for clearing by looking at a couple famous short squeezes (AMC, SPRT amongst others). Across several stocks this came out to roughly an 1/8 of average daily volume.
So my calc becomes:
Total Shares Shorted / 1/8th of 10 Highest Volume Days over 6 Months
This calculation still isn’t perfect, with the data ORTEX provides, I technically could still calculate the true “clearing average” to make it even better. Thus far I’ve been happy with the results but in the future I may further improve upon this idea with something of that nature.
Use Which One?
In my personal opinion, traditional DTC calculations are worthless and the ConqDTC figure should be used instead. While the bread and butter is giving a true estimate of DTC, it also shines in exposing pump and dump scams. If ConqDTC reads “intraday” there is almost never a chance that it’s a real short squeeze opportunity.
Thank you for coming to my TED talk ![]()