Here is my trading system @Gale
So the most important thing in my system are the support/ resistance levels and then the volume associated with them. So I’ll first show you how to find them levels.
So on tradingview, you go click on the left tabs to find the “Fixed Range Volume Profile” tool. Then you draw that and click between the 2 time points to find the volume between those times. Then you’ll get the yellow and blue volume peaks. What you want to do is search for the start of those peaks to mark your supports and resistance. And combining with the starts of the peaks, you want to make sure the daily and the hourly candles do show wicks or rejections/ bounces from those levels. So on my chart, you can see that I chose supports near the peaks or when the peak starts to form and you can see lots of reactions near those levels. To refine these levels, you want to go to the hourly and then repeat the process to get more accurate levels. Then during PM, you want to mark the PM highs and lows to see if they align with your levels and if the market respects those levels during trading hours. If the PM lows and highs are respected during market hours, I typically leave them on, if not, then I remove them.
Next for volume. It’s the basic indicator found on Tradingview. What you want to see is the either the buy/sell volume increase with the trend so that you know that this trend is real and not a bull/bear trap. Let me give you an example of my trade today.
I use the 3 min and the 1 min.
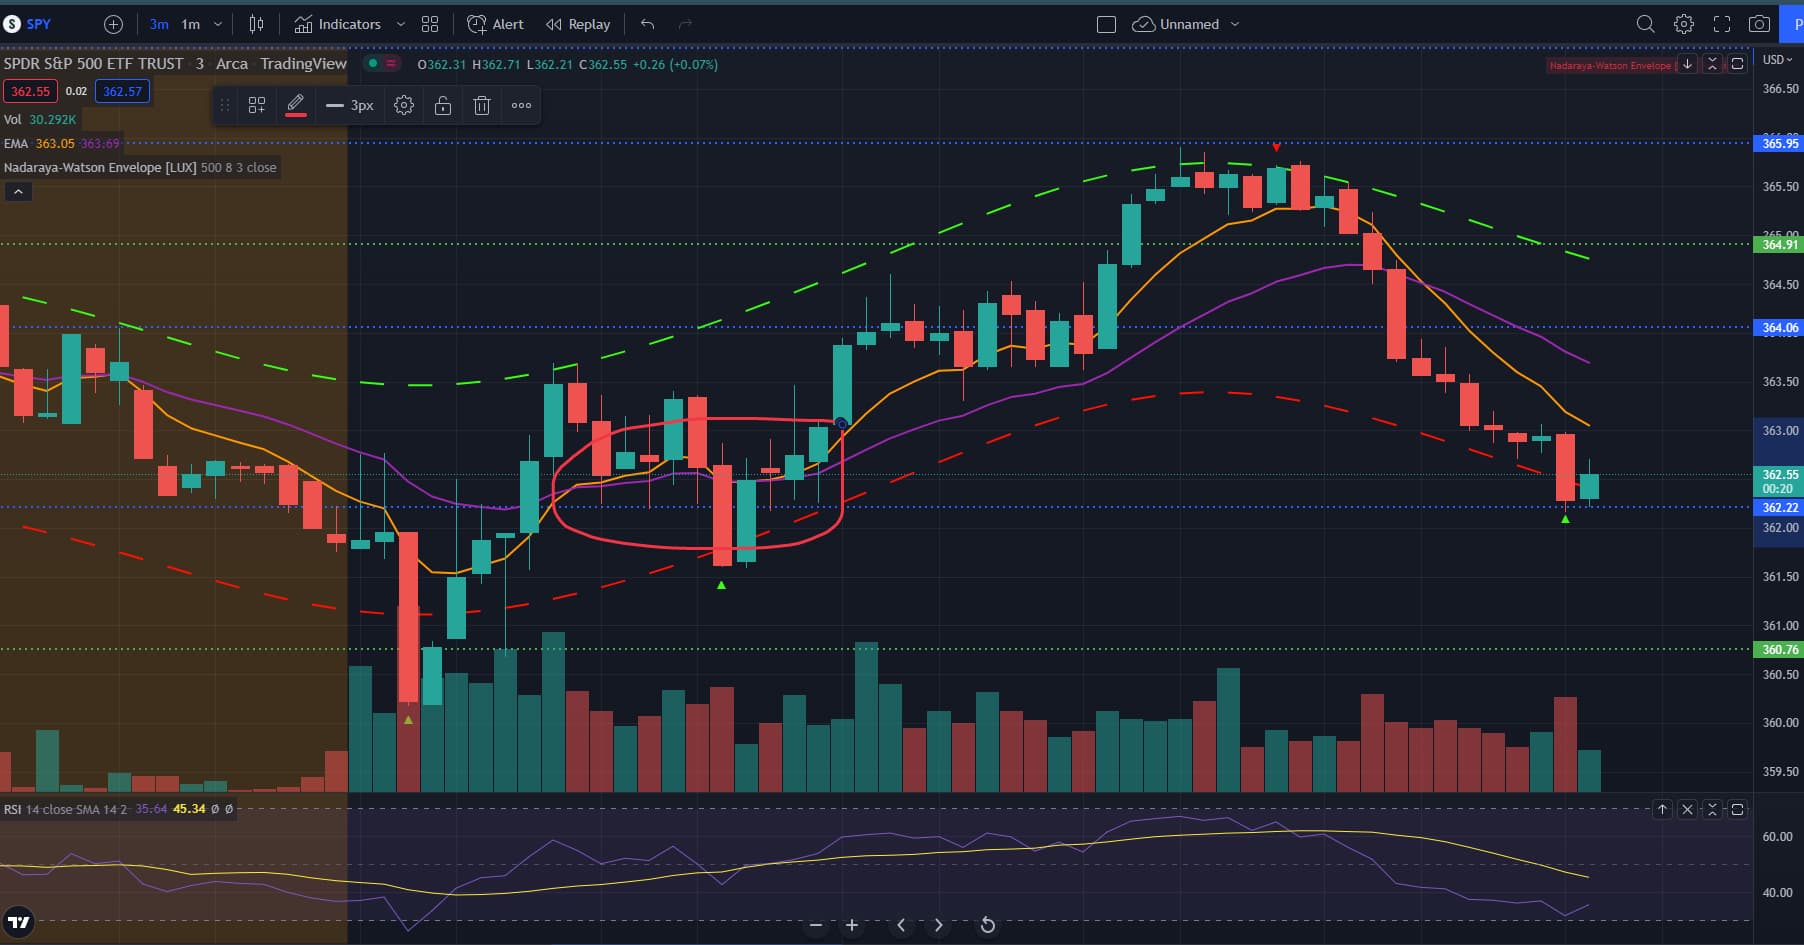
3 min chart:
1min chart:
So I highlighted the candles where I entered my trade. On the 3 min, you can see the huge bottom wick, which made me lean bullish, especially when looking at the big green volume following the huge red candle and the even bigger buy volume on the bottom wick candle. Then I switched over to the 1 min to refine my entry. On that red candle, I entered because the sell volume was stupid low and the 2 previous candles had huge buy volumes. So I didn’t think that SPY would reverse here. Ideally, I would have entered after the 3 min candle ended above my 362.22 resistance, but I knew that once SPY broke above that level, it would be an explosion so I front ran it, although I rarely do it. But since the buy volumes were huge and the candle formations were all bullish, esp with SPY testing that 362.22 level constantly, I knew I had to jump in. Then you can see that SPY exploded upwards and led to a 100%, I cut pretty early because my port is small so I take quick entries and exits to minimize risk. But if you were playing with a bigger port, you could have held for a little longer for a 100% gain.
For exits, I either cut a couple cents before my next resistance line so that I don’t get reversed before I reach there, as seen here. But I also rely on my 3 indicators - 8/21 EMA, Nadaraya - Watson Envelope [LUX] and RSI.
For exits, I typically use the Naradaya Watson as my exits. Once the price exits the top and bottom ranges of my indicator, I know that it’s time to cut soon. Using the 1 min this time, I cut quick because these violent and quick moves up typically requires the 1 min to make the better exits IMO. For the slower and less violent moves, the 3 min is used better. The other thing I use is the RSI. If the RSI is nearing the overbought/oversold range, I sell.
Now for entering with these indicators, I really only enter calls if SPY breaks above the 21 EMA on the 3 min. The 21 EMA works as a super strong resistance/support so it’s better to play calls if SPY is above and puts if SPY is below. For entering, enter the trend. If the trend is down, wait for a retracement back to the 8 EMA on the 3 min to enter or for the confirmation of a rejection at a resistance level. I also check if the RSI isn’t oversold/overbought, showing me that there’s more room to run. I also don’t buy the trend when price is overextended to the upside or downside.
If you wanted to play a counter trend, I would really only enter if SPY starts to break above the 8/21 EMAs (like today’s play), or when it’s super overextended to the downside like today at 360. Let me give a few more examples of potential good trades today.
So I highlighted where I would see my potential play on the 3 min and where I would enter on the 1 min. On the 3 min, you can see that SPY was oversold and shot back up above the 21 EMA and the 362.22 resistance and bouncing off that level.
Then checking the volume, the green candles after the red doji were on good volume, showing that there were buyers incoming. Then switching over to the 1 min, I would have bought a call after the 1 min green candle ended. That showed weakening volume on selling and volume coming in for buyers. Then it broke above the 8/21 EMAs with a good body. I would have cut at the 364 resistance and you can see that buyers kept stepping in with equal volume. The RSI was also at the middle, showing that there were good moves in store for the upside or the downside. But the RSI was staying above the 50 level, which was leaning bullish. So combined with this, I would have entered calls and exited at my resistance level or when price started to near the naradaya watson levels.
Hope that helped and let me know if anyone has questions. This isn’t a perfect system since you’re waiting for confirmation everytime, but works great for me. You just have to be patient and let plays develop instead of trying to front run every play.