There’s a lot of discussion regarding 2008 but I’m not sure many people are familiar with what exactly that looked like so I wanted to take a second to post the chart with some markings to put things in better perspective.
While we refer to “The Great Recession” as “2008”, it actually started in 2007. The market hit peak in October of that year at $157:

Now, 6 months off that peak, like where we are now in our current market, SPY had fallen 15%. Today, we’re down 23% in a similar timeframe, outpacing the 2008 crash.
Part of the reason I wanted to post these charts is because I think people envision market crashes as a “straight down” sorta deal and they aren’t really. There is a whole lot of volatility like we’re seeing now but really only a few very short lived moments of “holy shit”. Pay special attention to how there weren’t very many gaps in the chart, a revelation that I’m sure is somewhat surprising to most.
So let’s look at today and compare:
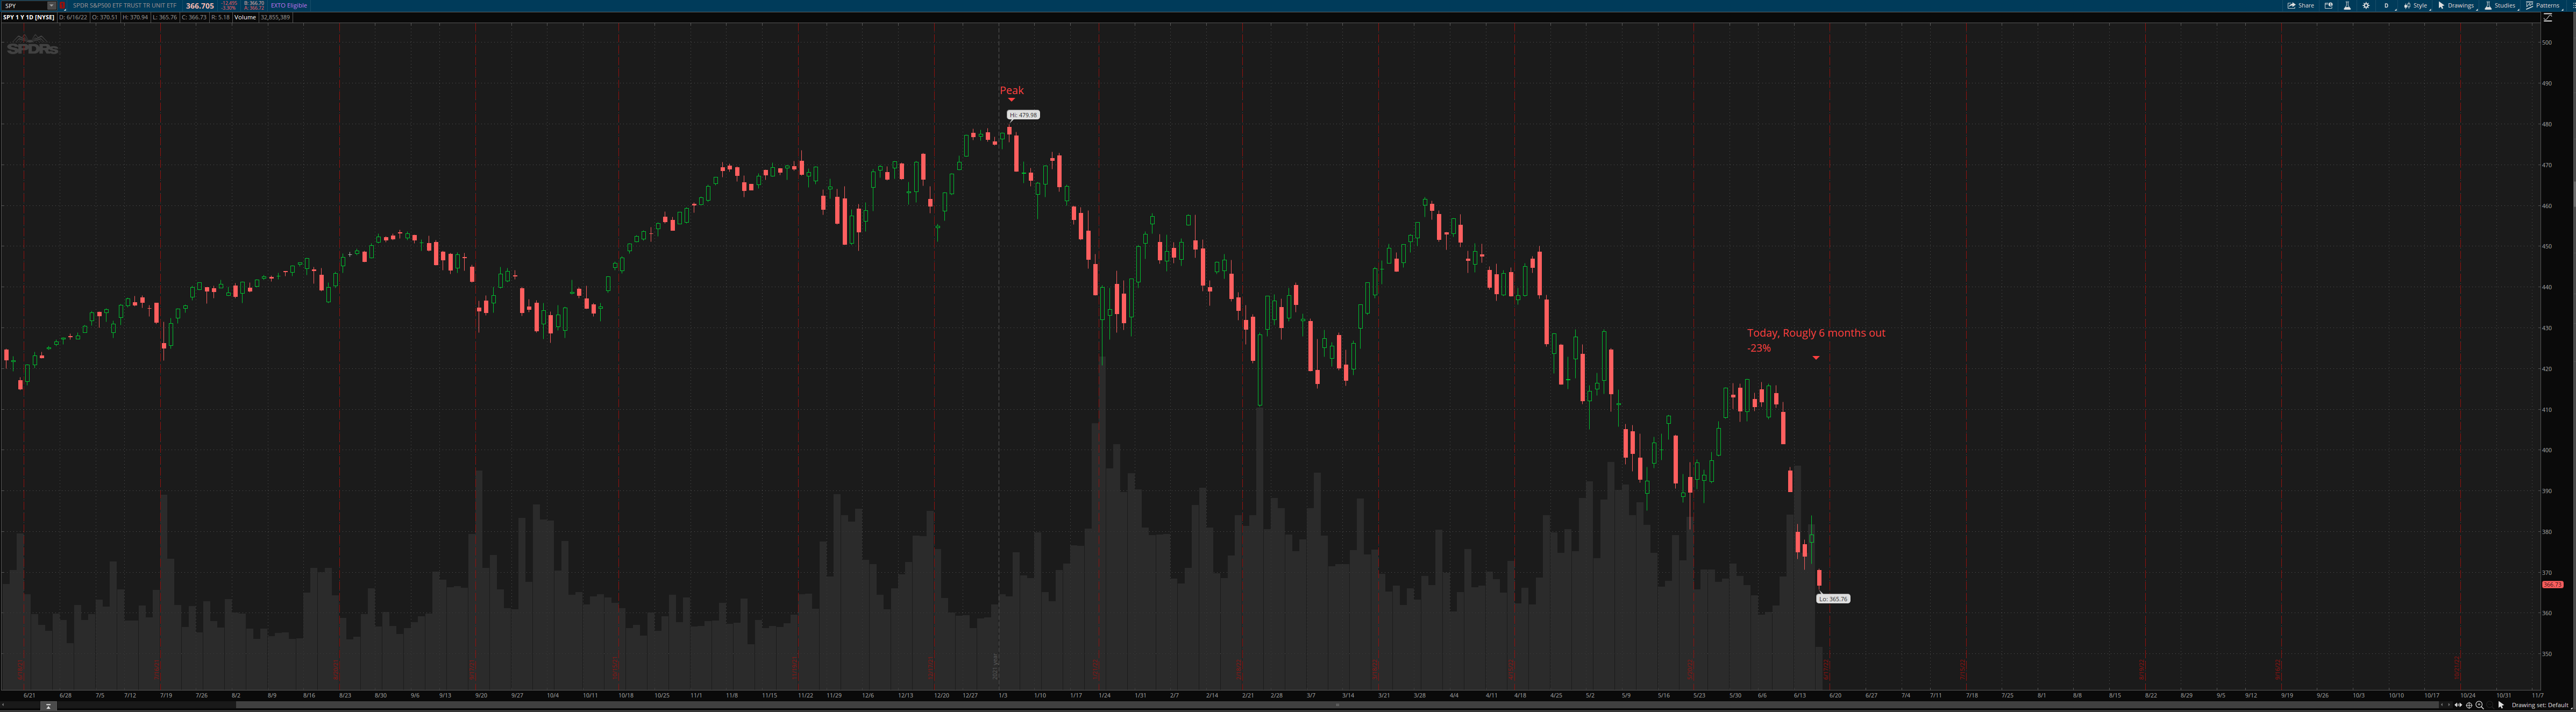
Like I said previously, we’re down 23% off peak while “The Great Recession” was down 15% in a similar timeframe. Does this mean that things are worse now? Potentially, however, I have another theory and it routes back to our favorite copypasta “!pricedin”. The markets are overall more efficient now-a-days than they were in 2008. There is a whole lot more technology and a whole lot more research and understanding of the economic forces at play, especially having “seen” 2008 which I’m sure taught investors a whole plethora of lessons.
Now are the forces at play here the same? No. The housing market this time around seems to be “okayer”, inflation is higher and so on and so forth. But the market is complex and simple simultaneously. While a bunch of factors are leading to an economic downturn, it’s still just an economic downturn in the eyes of the market.
“The Great Recession” lasted 1 year and 5 months or so with an absolute bottom occurring on 03/08/09 at -57% off the peak almost a year and a half earlier, which I’m sure is a bit slower than most had in mind as well. “The Big Drop” occurred between 10/03/08 and 10/06/08 almost a full year off peak and lasted only a couple days before resuming “normal” volatility for the time.
So all of this is to say that if you’re hoping to catch “the crash”, you’re looking to catch 7 days out of 510… if it even happens at all. At almost every stage of the 2008 crash, unless you were taking very long out options you would’ve been blown out getting too dedicated to either sentiment. While the trend is down, the path to get there is full of ups and downs. So make sure that if you’re trading these movements, you’re playing the catalysts as they come (!mcal is our bible right now) and be willing to realize when the effects of those catalysts have probably been !pricedin. If you are looking to catch those 7 days, it might be worthwhile to research exactly what triggered “The Big Drop”, specifically what policy decision, data point or news catalyst started that selling pressure, otherwise, you’re just gambling.
Food for thought. ![]()
Either this is coherent or it’s a COVID induced fever rant, ya get what ya get ![]()