Did you want to see it back to 22 for another run up???
Hopefully we see some good action PM.
This just popped for me in AMC-related news - Could it cause some FOMO - that is yet to be seen…
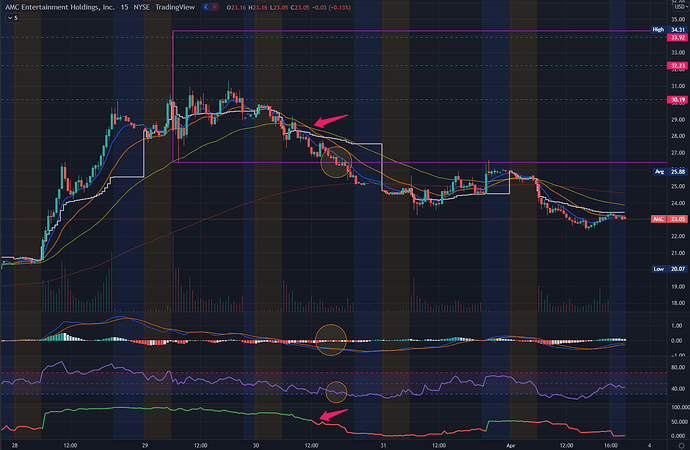
Hey Rexxar, curious to see if you would be willing to give more of an explanation on why you see AMC as bullish on the 1HR and bearish on the 15minute currently? If you are busy/do not want to, no worries. Thanks!
Heya bud, I’ll try to discuss some of the points that I saw on Wednesday…
a) The 21 day price movement average line (orange) crossed under the 55 day average (yellow), joining the 8 day line (blue).
b) Volume Average was down too, that’s the white line (vWAP).
c) Previous day’s (Tuesday) support of 26.42 (bottom of violet bounding box) did not hold, and kept getting rejected at the 8day EMA.
d) Sell Candles by Volume confirmed there was no reversal before market close that day.
e) MACD and Signal lines just kept digging under the MACD histogram bars, though tight knit.
f) RSI confirmed momentum to downside–got rejected on that bullish reversal attempt on 12:45pm, finally touching bottom again when price broke past support.
g) Volatility meter totally fizzed out–green to red transition, then total nose dive.
Today, AMC also entered a Sell signal for me on the 1hour, but it’s a Friday, and that may be a false signal.
Also SPY did try to recover a bit, so Monday is anybody’s guess.
I expect volatility to ramp up again early next week.
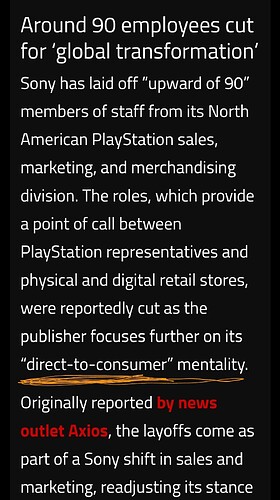
This is Sony news, but I’m tying this up to Video Game retail businesses like GME:
https://www.destructoid.com/sony-playstation-division-lay-off-sales-and-merchandising-staff/
And since AMC gets sympathy pull from GME as retail favorites to trade, one can consider this as a possible indirect factor in both short and long time frames.
I’d like to point out that AMC has been offering their own streaming service for some time now.
They do still need to distinguish themselves from the rest in that space too, but at least they are in it.
Both companies will have to do much better in the coming seasons to survive.
Keep following Conqueror’s thread on GME and AMC’s synchronized momentum play.
I’ll try to add more TA there as needed.
[size=5]AMC: An Analysis For What Is To Come[/size]
This post will be my summary of a list of technical analysis sources I have found during the past couple of days.
To start off, we have PinoyApe’s analysis.
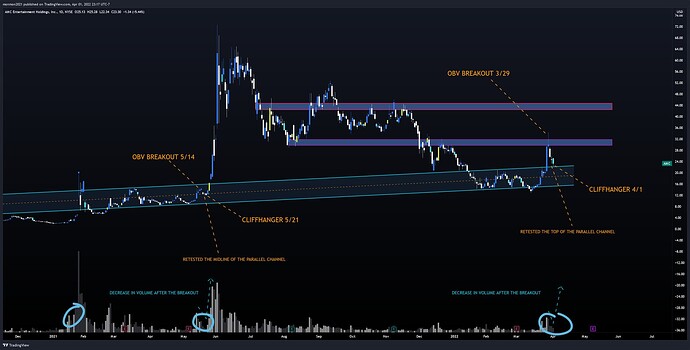
Two separate instances of decreasing daily volume have been recorded so far, the runup in January of 2021 and late May of 2021.
Currently, AMC’s daily volume has been on a decline after a significant runup to $34+ on March 28th - March 29th from $20.54. The daily volume in the coming days could repeat past events - A significant increase in daily volume followed by a decline, and then an explosion of volume following.
For those who do not know what OBV (On-Balance Volume) is, it is a technical indicator of momentum, using volume changes to create price predictions - OBV shows crowd sentiment that can predict a bullish or bearish outcome. So, higher OBV reflects positive volume pressure (bullish) and lower OBV reflects negative volume pressure (bearish).
PinoyApe makes use of OBV (On-Balance Volume) for this technical anaylsis to represent the support and resistances based on it. AMC is currently touching the support/top of the parallel channel based on the daily timeframe, a likely scenario of bouncing off of it due to how strong the support is.
Source: xJTHUNDAx
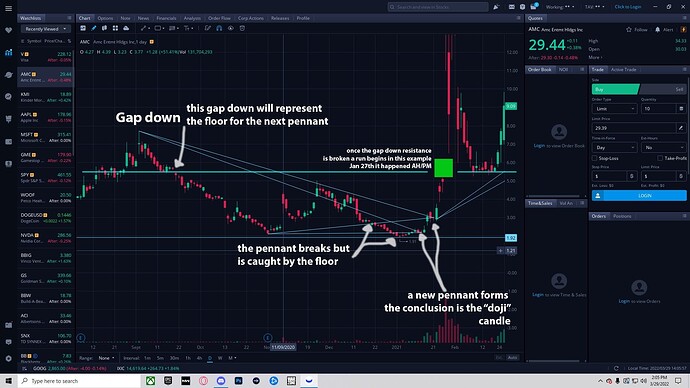
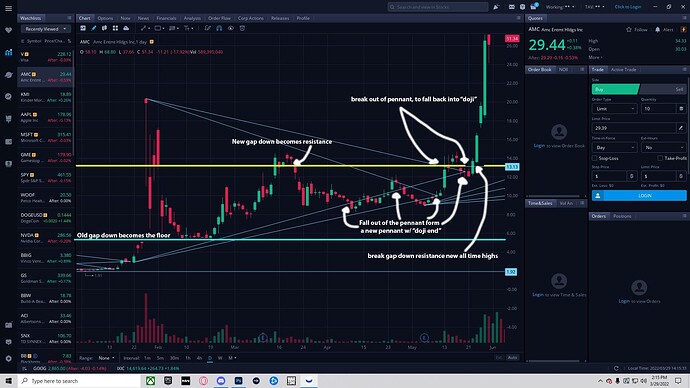
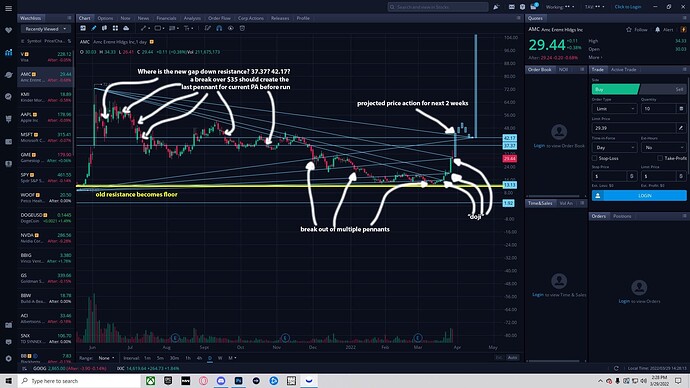
In Thunda’s technical analysis, he mentions that past gap downs will represent as a floor for AMC’s runup. When these floors that the gap downs have created through its resistance lines are broken, a runup occurs. This time, the floor that needs to be broken seems to be $42.17 in order for the “event” to occur.
Source: Oliver Kaiden
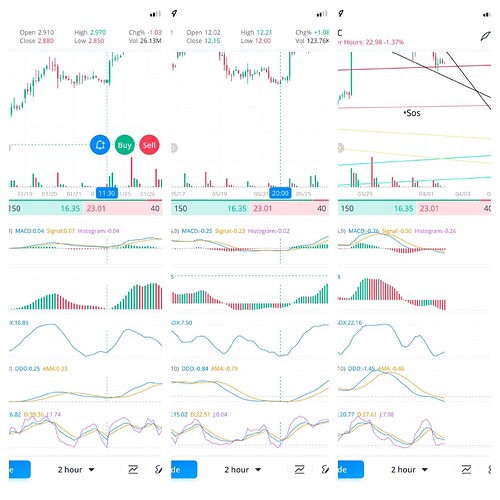
Here, Kaiden suggests we gap up on Monday based on the past runups. Right before the runups of January and May, these 5 technical indicators as shown in the screenshot all crossed before it happened. The indicators are showing the same signs again.
Source: NMInvestments
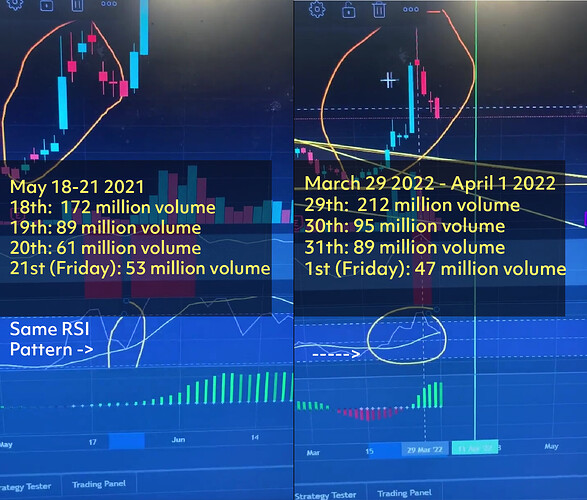
NMInvestments shows us similarities through the perspective of fractals from the May 2021 runup: We have 4 days of decreasing volume and the same RSI pattern.
Source: Tom Gernhart
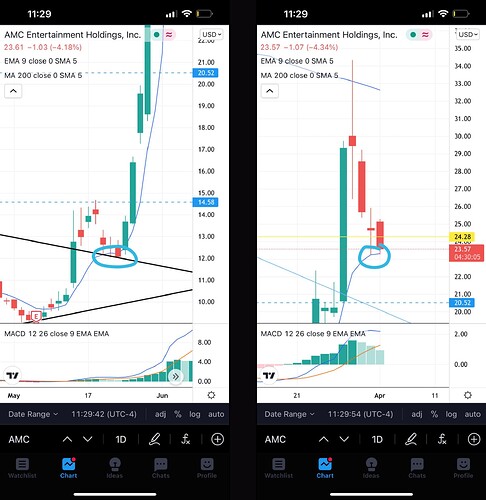
Again, another similarity from May’s runup was the fact that after a 3 day consolidation period, AMC bounced off the 9 EMA.
Source: Ace Ventura
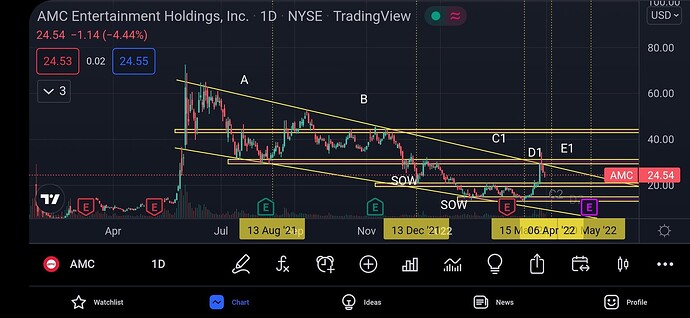
This pattern on the daily timeframe is a descending wedge, which is regarded as a bullish pattern.
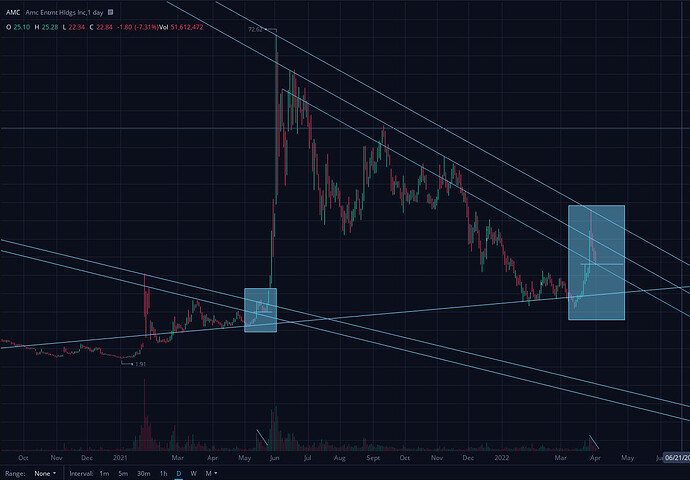
My analysis of AMC is simply from a fractal standpoint - The bounce on May was supported by the peak of the runup in January of 2021, a similarity seen today. The runup from May is support for this upcoming bounce for the April 2022 runup.
In Summary:
a). 4 days of decreasing daily volume of similar quantity
b). Gap downs from past runups supports April runup
c). Same RSI Patterns on the daily timeframe
d). 5 Technical Indicators of the same patterns in January and May appears again
e). Descending Wedge on the daily timeframe
f). 9 EMA Bounce supported by gap downs, peaks of past runups and OBV
With six different pieces of evidences, I am personally invested into AMC with a confident position. I must mention that Technical Analysis or Fundamental Analysis will not always guarantee you a 100% return on investment, no matter how good the analysis is. However, they are substantial for determining confidence in positions.
[size=4] Please only invest what you can afford to lose - AMC is a highly volatile play.[/size]
Thank you for reading this, do let me know if anything stands out or wrong. I will happily accept constructive criticism.
Great job !
AMC just keeps chugging along with GME and the broader market.
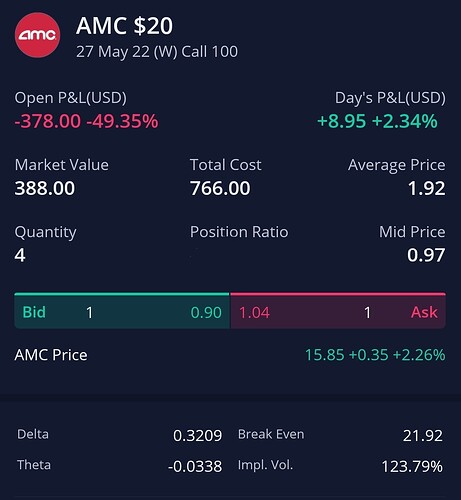
I do like this price now so will start a position today with 1 call for June/July.
I’ll average down as needed, each time buying at least 2 more calls–will probably max out at 20 calls.
If GME rockets next week, I’m buying PUTs against AMC.
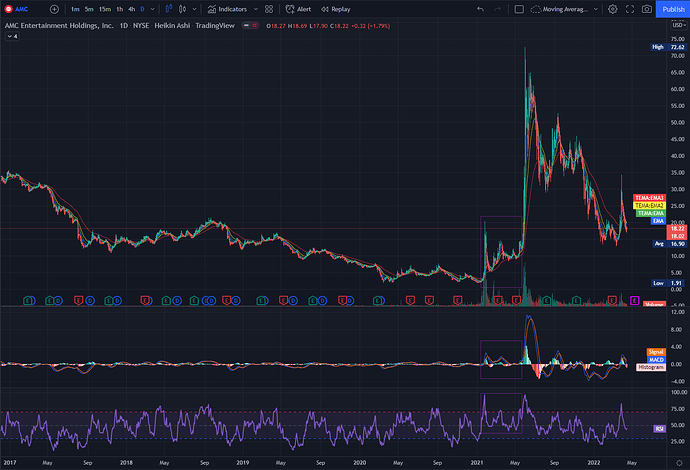
I try not to consider too much of the older data past 90 days.
It just doesn’t make sense to me to go too far out previous candles’ for support and resistance levels.
The chart is clear enough for me. What we see is what we get.
What strikes are you taking? I wanna follow the ![]() …
…
I’m just going with 20 for now. Next week is more bearish.
Took 1 call for now in the May27 opex, considering Dr. Strange 2 numbers.
These are intriguing rationales, Gale. Thanks for adding them here.
I do choose to simplify my studies now, which translates to faster profit taking.
Don’t even have time to take screenshots, I prioritize exiting on greens, whichever way it takes.
So here’s the simplest strategy I have concluded to be the most effective for AMC and other p&d plays…
For buying and selling shares:
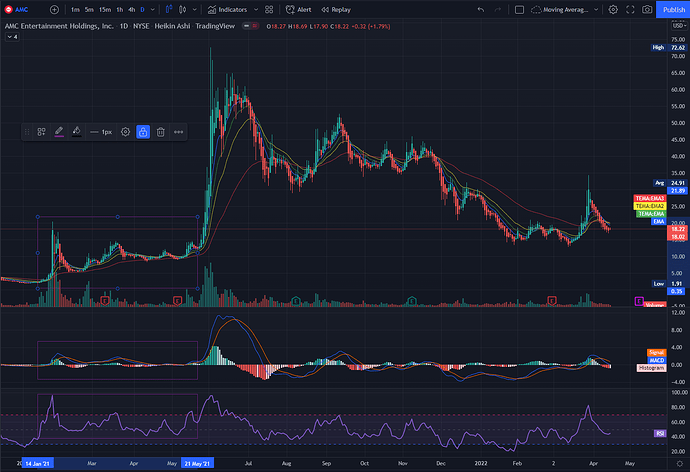
- It’s always with the basic indicators, Moving Averages (bgyr lines), Moving Average Convergence Divergence (MACD), and Relative Strength Index (RSI).
- All we want is To Buy when the Red Line stays below the price bars and other colored lines, and sell when it’s back above the other lines along with the price bars.
- The MACD and RSI indicators will help us decide the best entries.
- Notice from Jan 14, 2021 to May 21, 2021, the MACD and Signal lines stayed above the histogram bars.
- Notice also the RSI stayed pretty much above the middle line, bullish all the way to the big pop of June 2021.
Those are the same things we want to see in the next few weeks.
So if you have WeBull or TradingView or TD, at least turn on the MACD and RSI indicators to help yourself watch out for strength signals–on any ticker.
This can be profitable for both sides–since puts and shorts benefit a lot after the biggest runs.
That said, for Options:
- Once the above mentioned pointers are satisfied, we also want to check the Options Chains for future multiple opEx.
- The Put/Call ratio must ideally be closer to 0.01 to signify really strong bullish sentiment.
- You’ll also want to prepare some capital for eventual puts, of course.
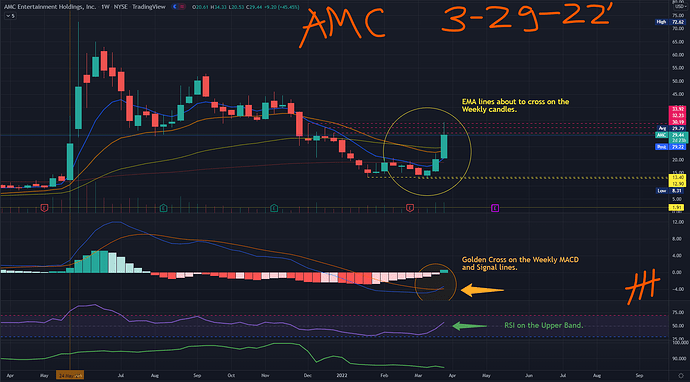
Right now, I’m waiting to see if AMC will maintain this price over $10-15.
If it does, then this may definitely be the Big Double Bottom that I’ve been waiting for.
If not, then it may yet be another year of waiting–regardless, what we want is to be ready.
It took 2 years for AMC to be a big play…
Whether or not you believe it deserved to be among the best meme plays of 2021 is moot.
Circumstances aligned perfectly and that’s that–players who were ready, made big bucks.
So you’re looking for a bounce off of the lows of January/ March for a double bottom? Or are you looking for AMC to consolidate above $10-15 while your indicators move back into a bullish zone
The latter.
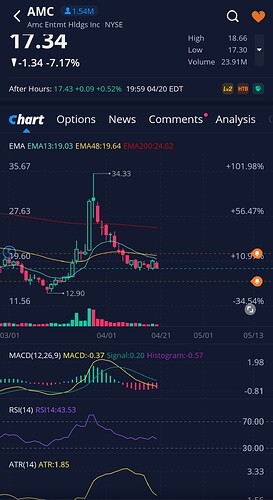
Price has dropped under 18 again and this is where I want to start loading up for June/July long calls…
MCU fans have been teased with Thor: Love and Thunder.
Nerds like what they see.
Nerds will buy big screen tickets.
Adam has done well keeping his apes intact for as long as possible.
In the end, it’s all about the movies.
Just a few more weeks before we get the numbers for Dr. Strange…
I rarely play this far out. But when you do, and for this ticker, are you looking at strikes a bit OTM?
Oh yeah, 20 to 25 will be my strikes. We expect a move, so the premiums will surely get jacked.
