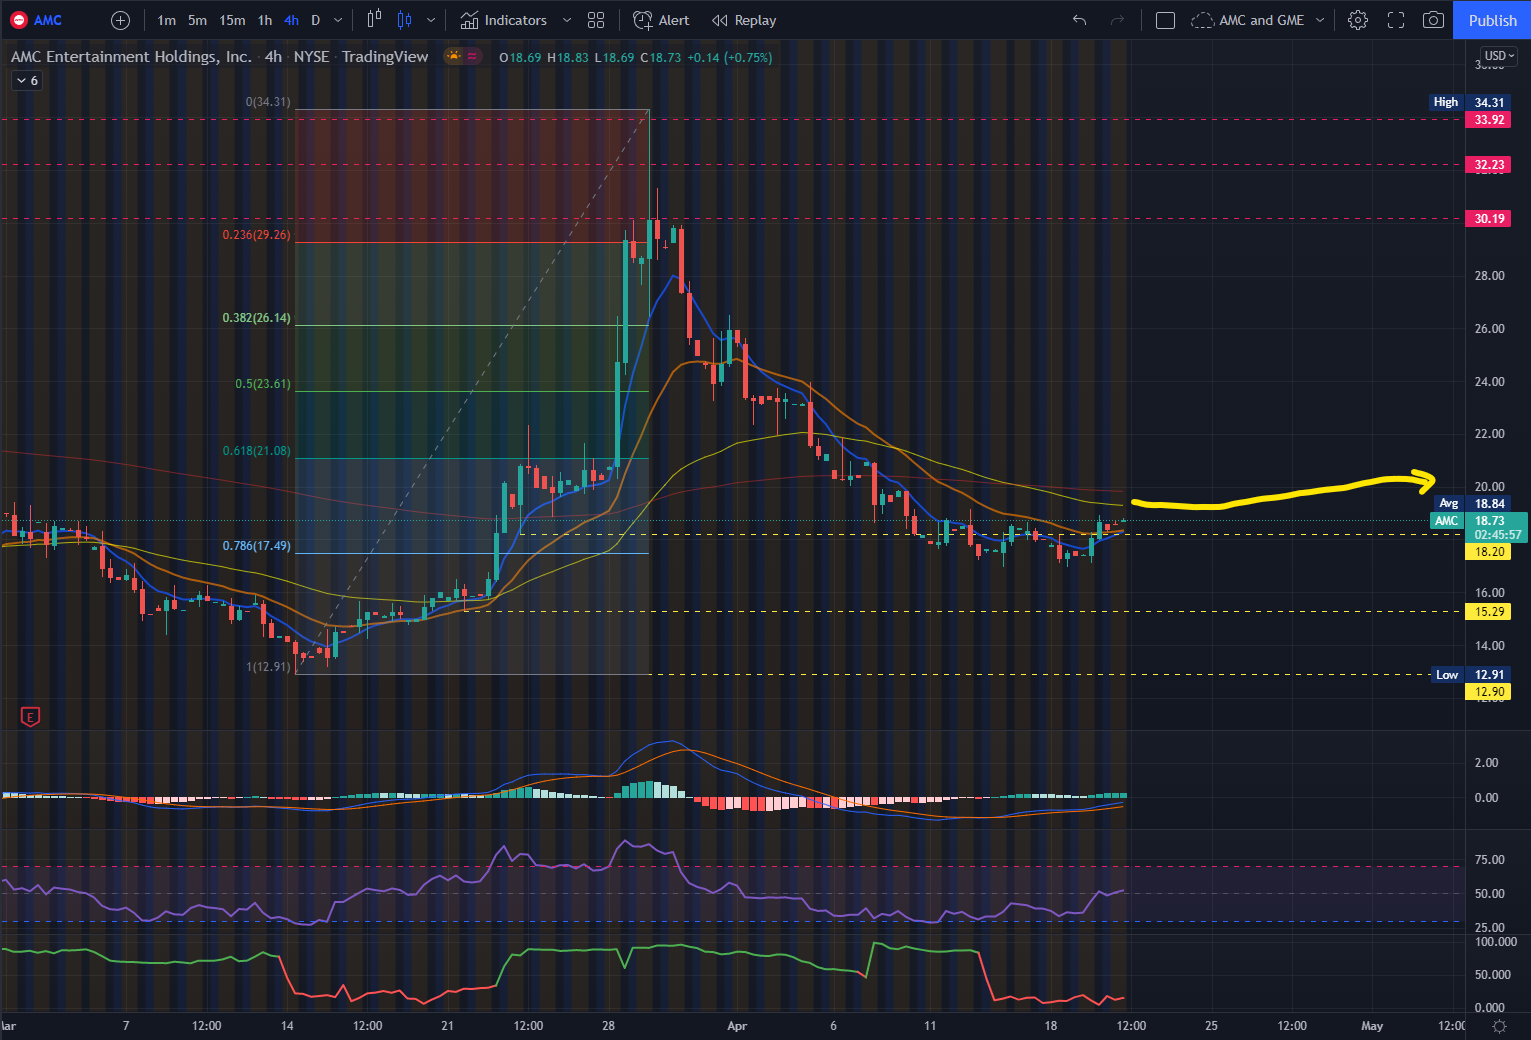
Levels to monitor…
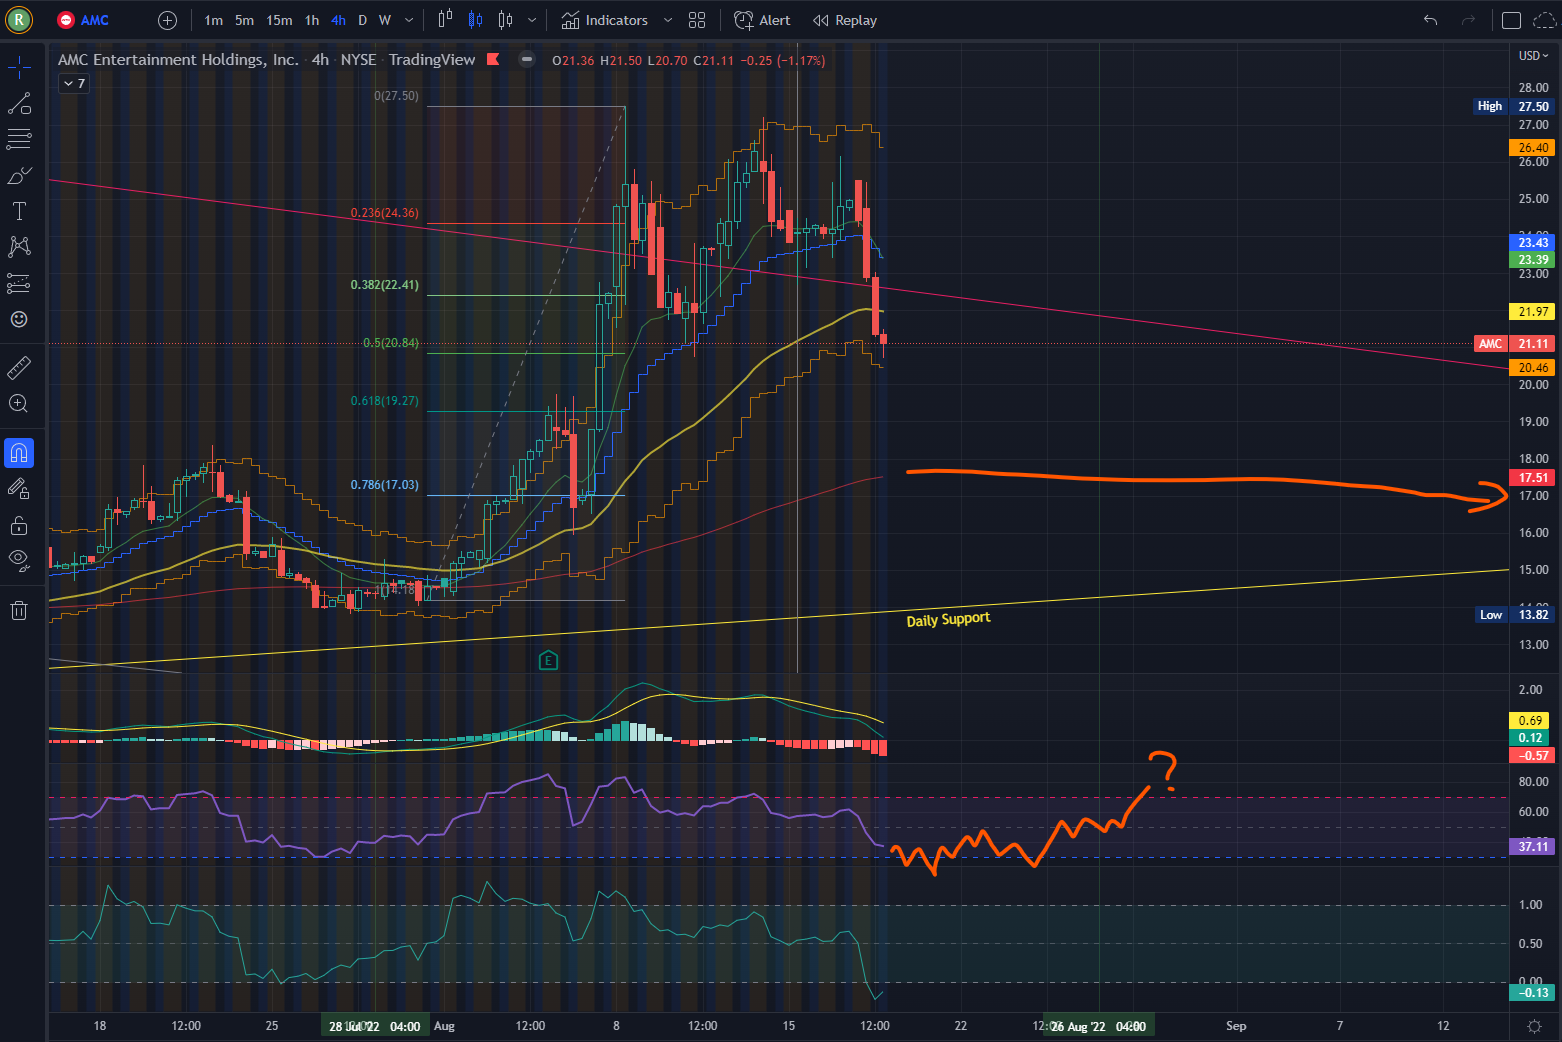
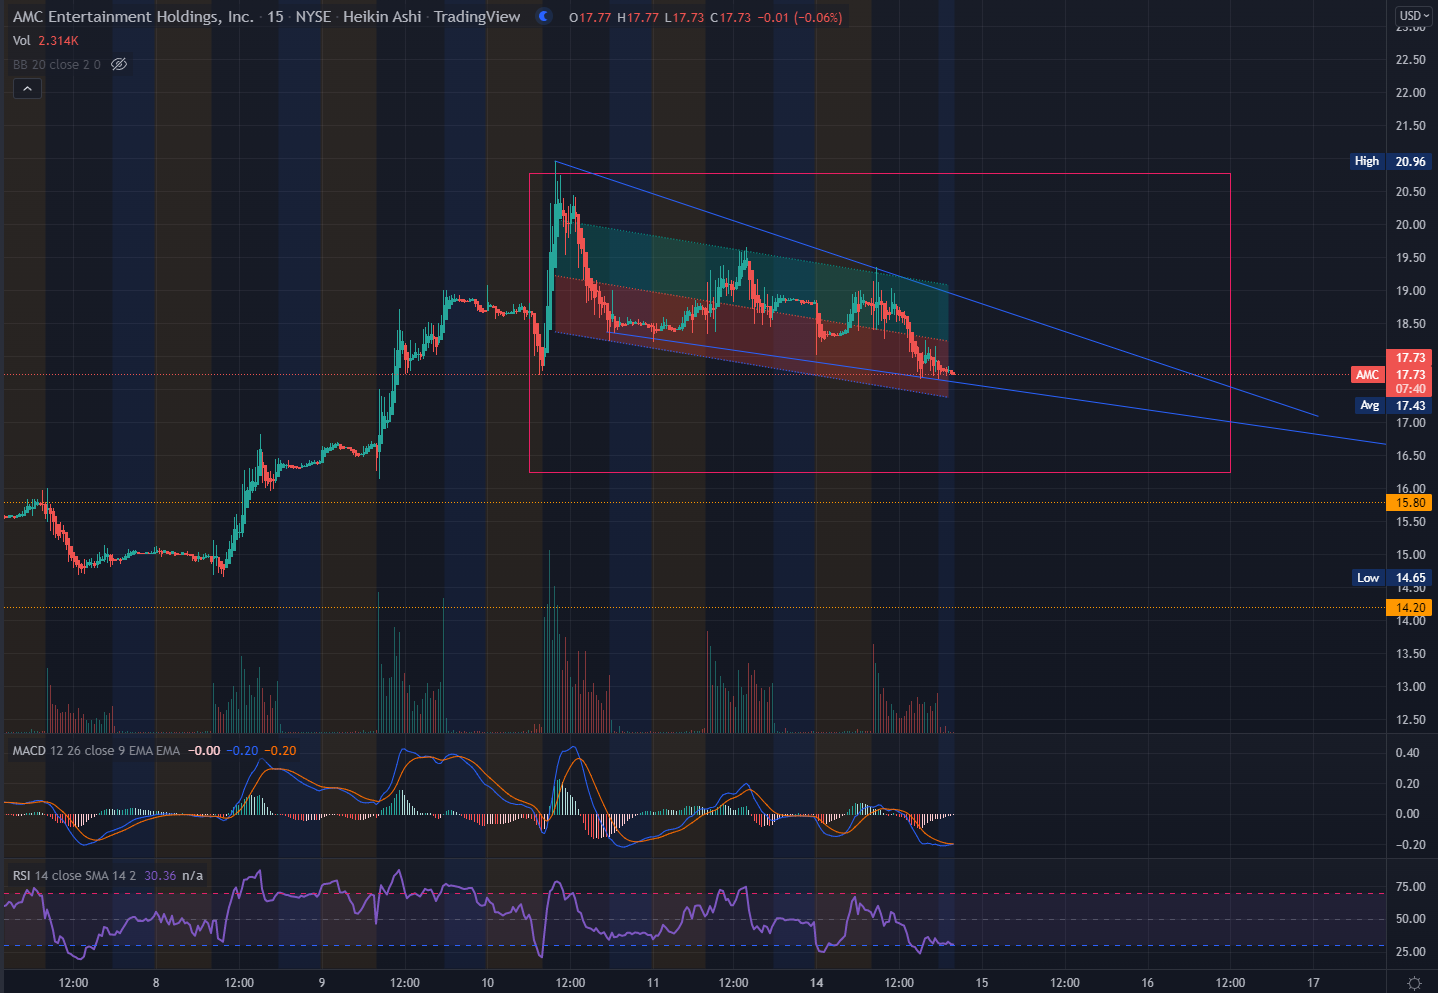
- $17 price line is the 4hour 200 EMA, consolidation above this line is good for the bulls.
- I think next week is the last chance for any run-up for this ticker.
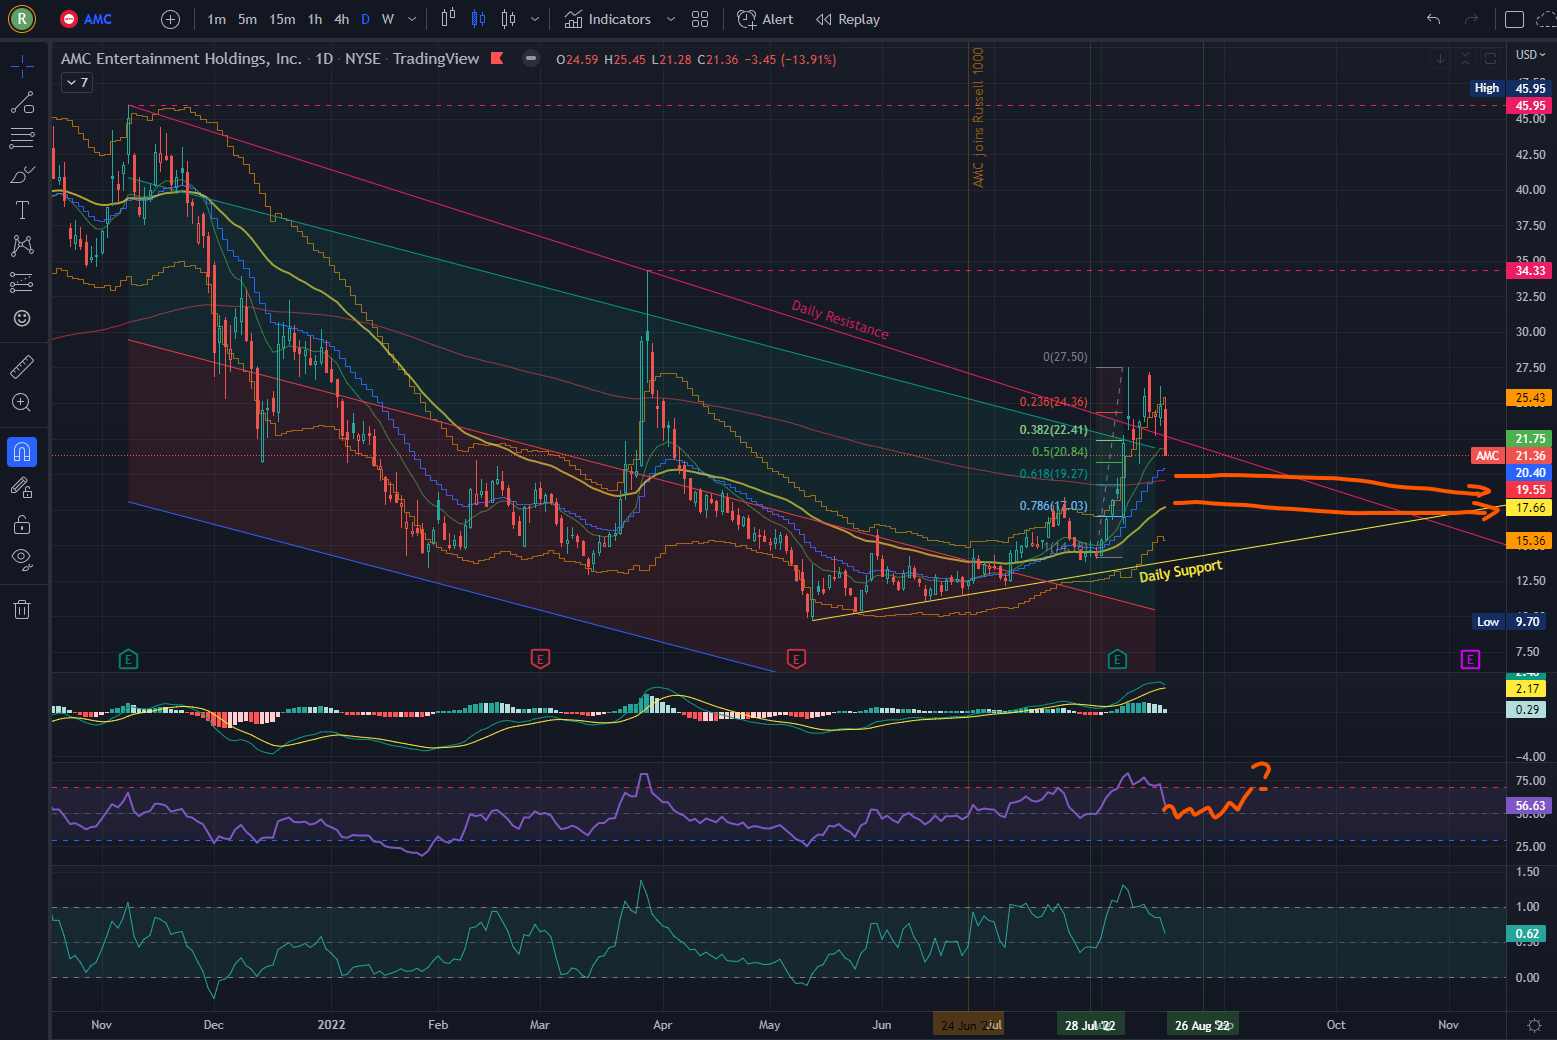
- $19 price line is the Daily 200 EMA, I’m expecting some bounces here before it either consolidates above 17 or dive under that critical support.
- 15 and 12 might have the last buying powers waiting on the sidelines, before a worse market crash help the easier bear case.
- A break under 12 should finally force this thing to sleep for at least another year.
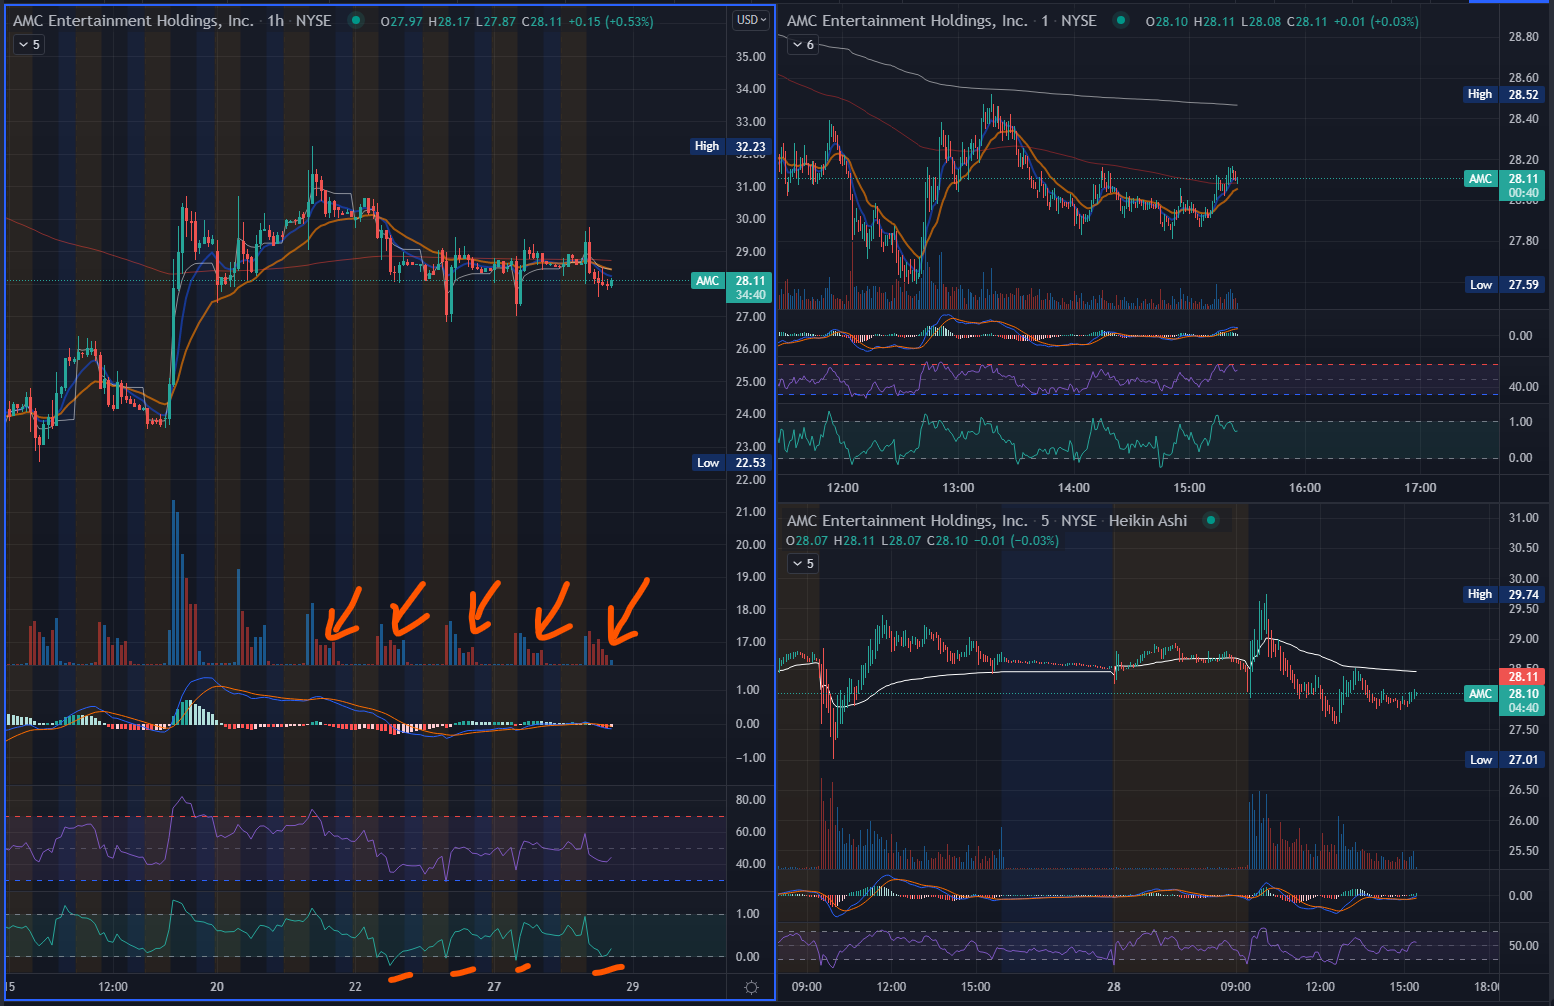
Indicators you see here:
- Hollow Candles
- TripleEMA, 13, 48, and 200 days.
- Kertnel Channel, default.
- Fib Retracement
- Regression Trend
- MACD
- RSI
- BB %B
xxx
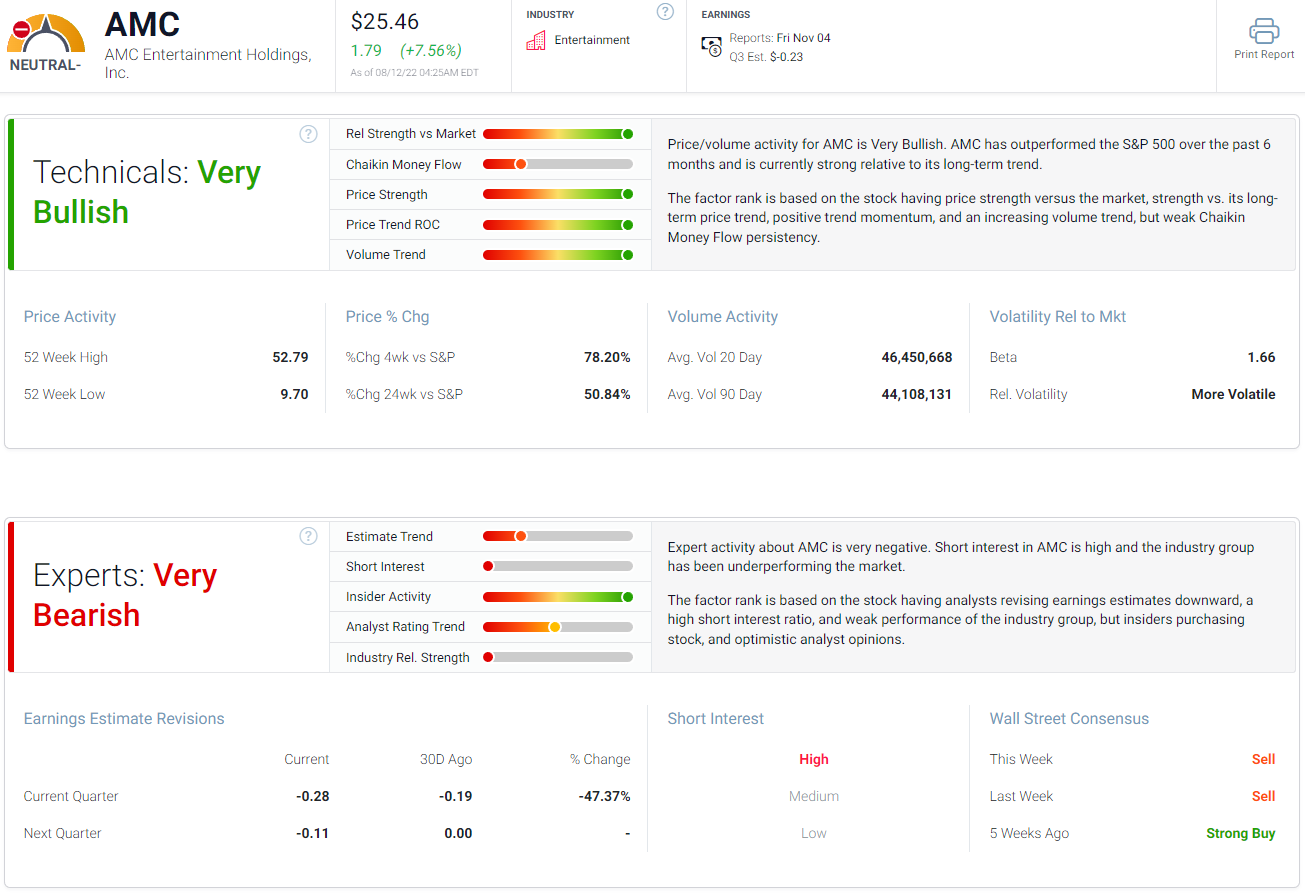
Chaikin now has AMC’s Technicals as Very Bullish…
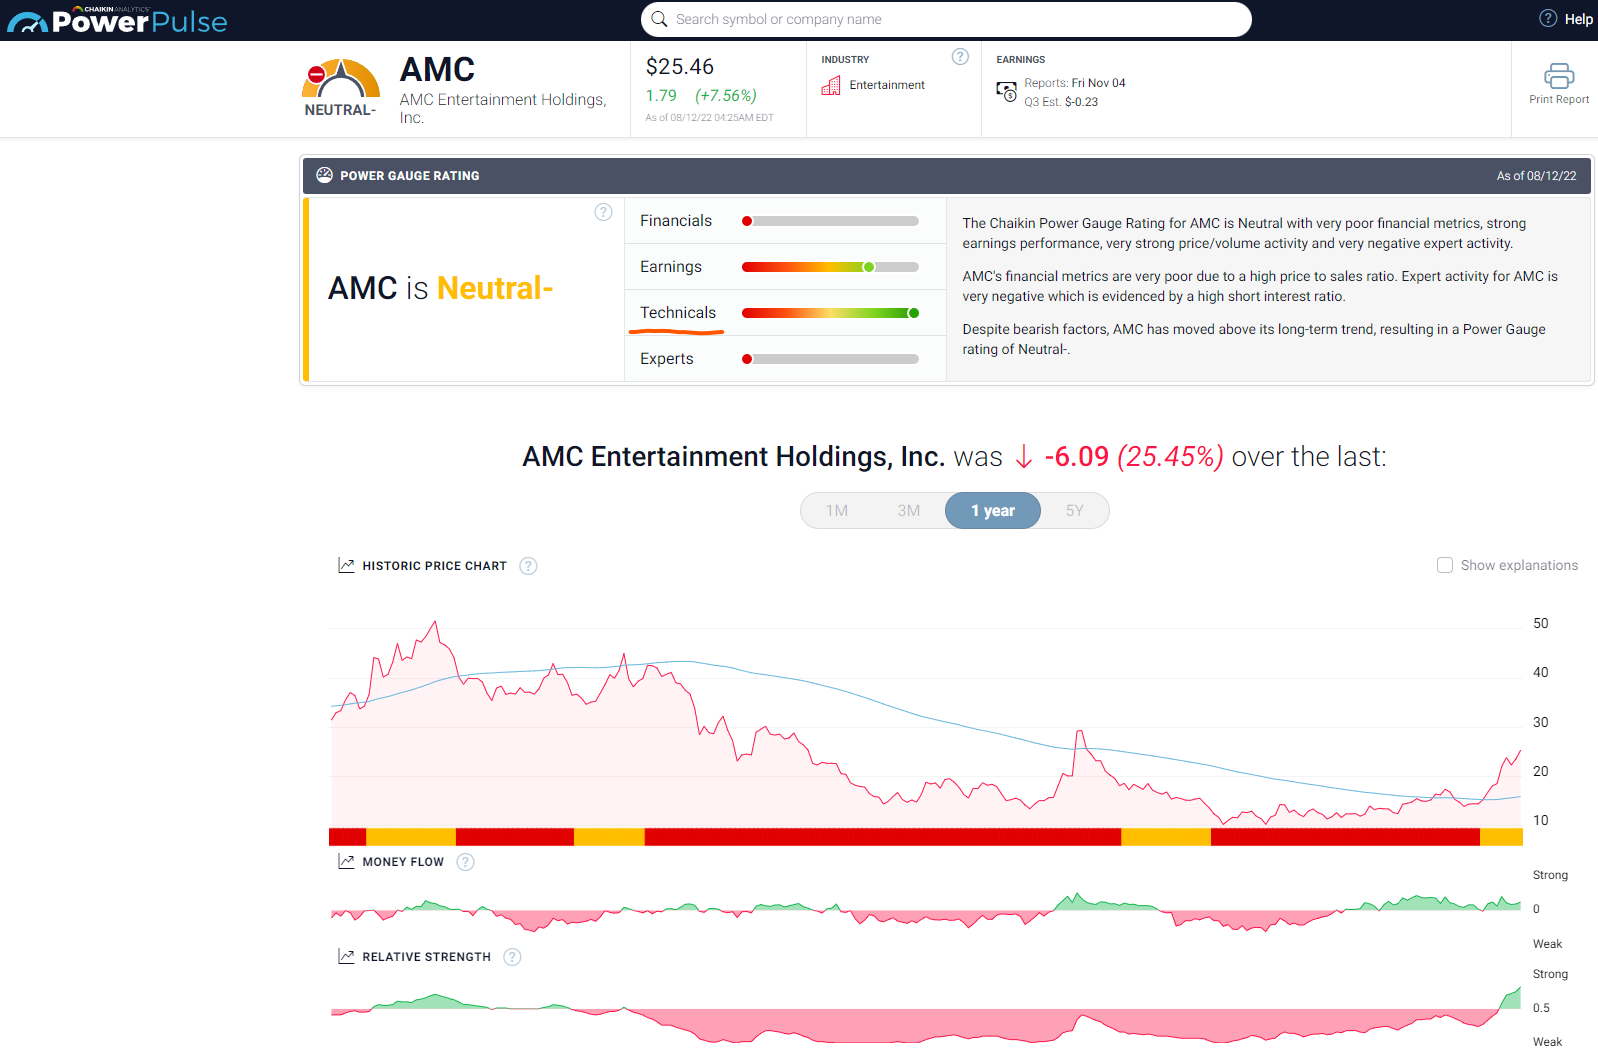
Financials and Expert Opinion remain unchanged, of course.
Earnings…
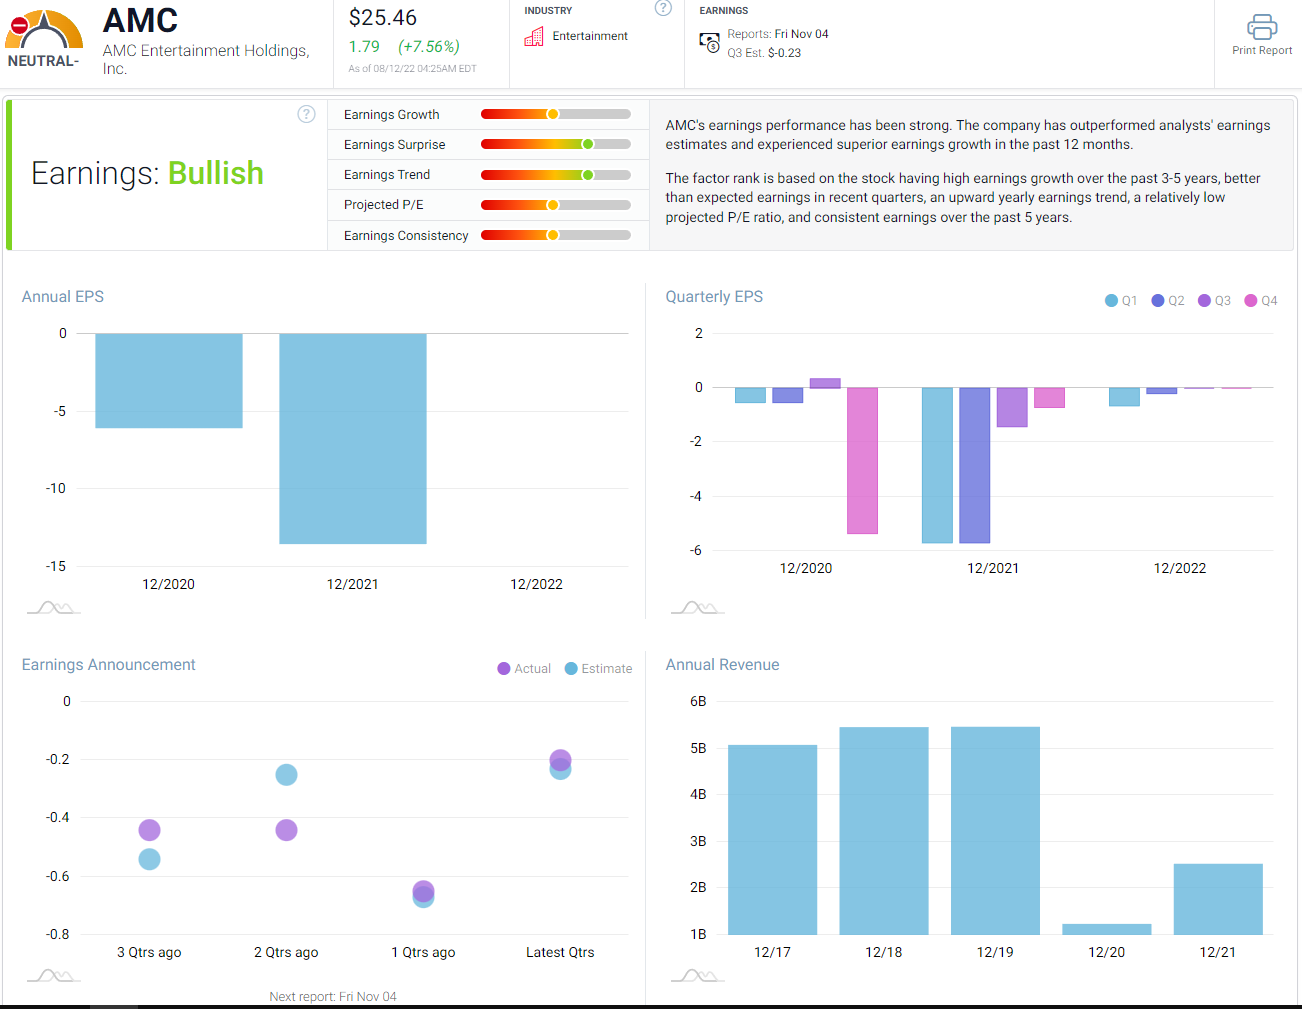
Retail strength continues to go against the fundamentals…
I’m simply trading the movements, not holding anything for the long term.
xxx
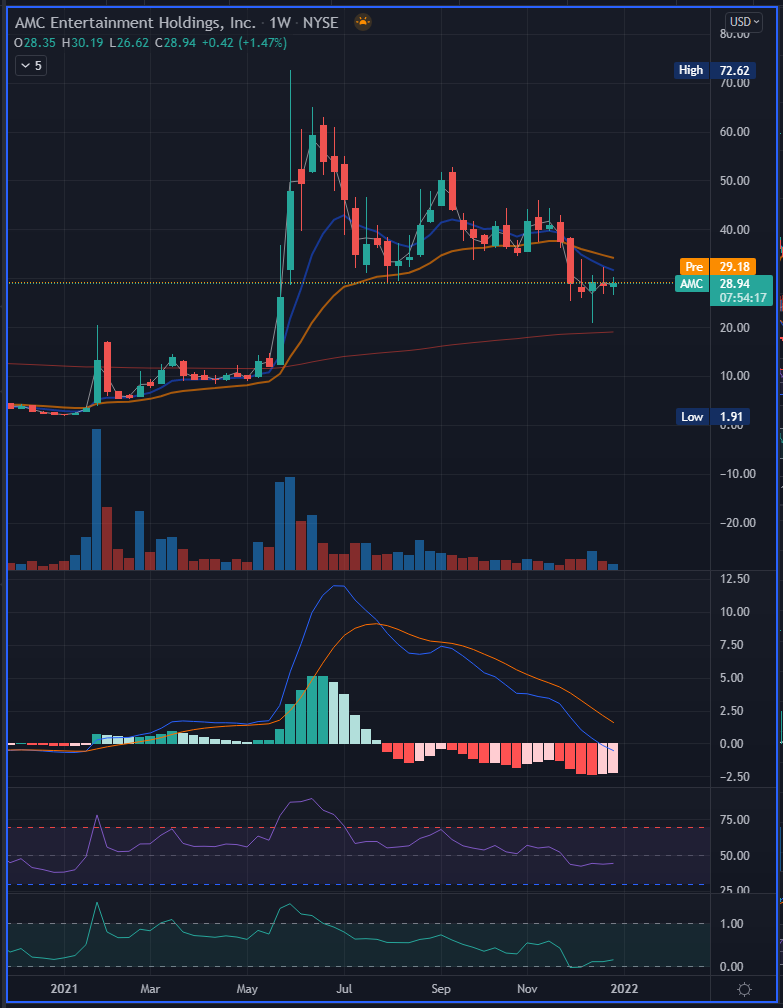
Here’s the Weekly chart…
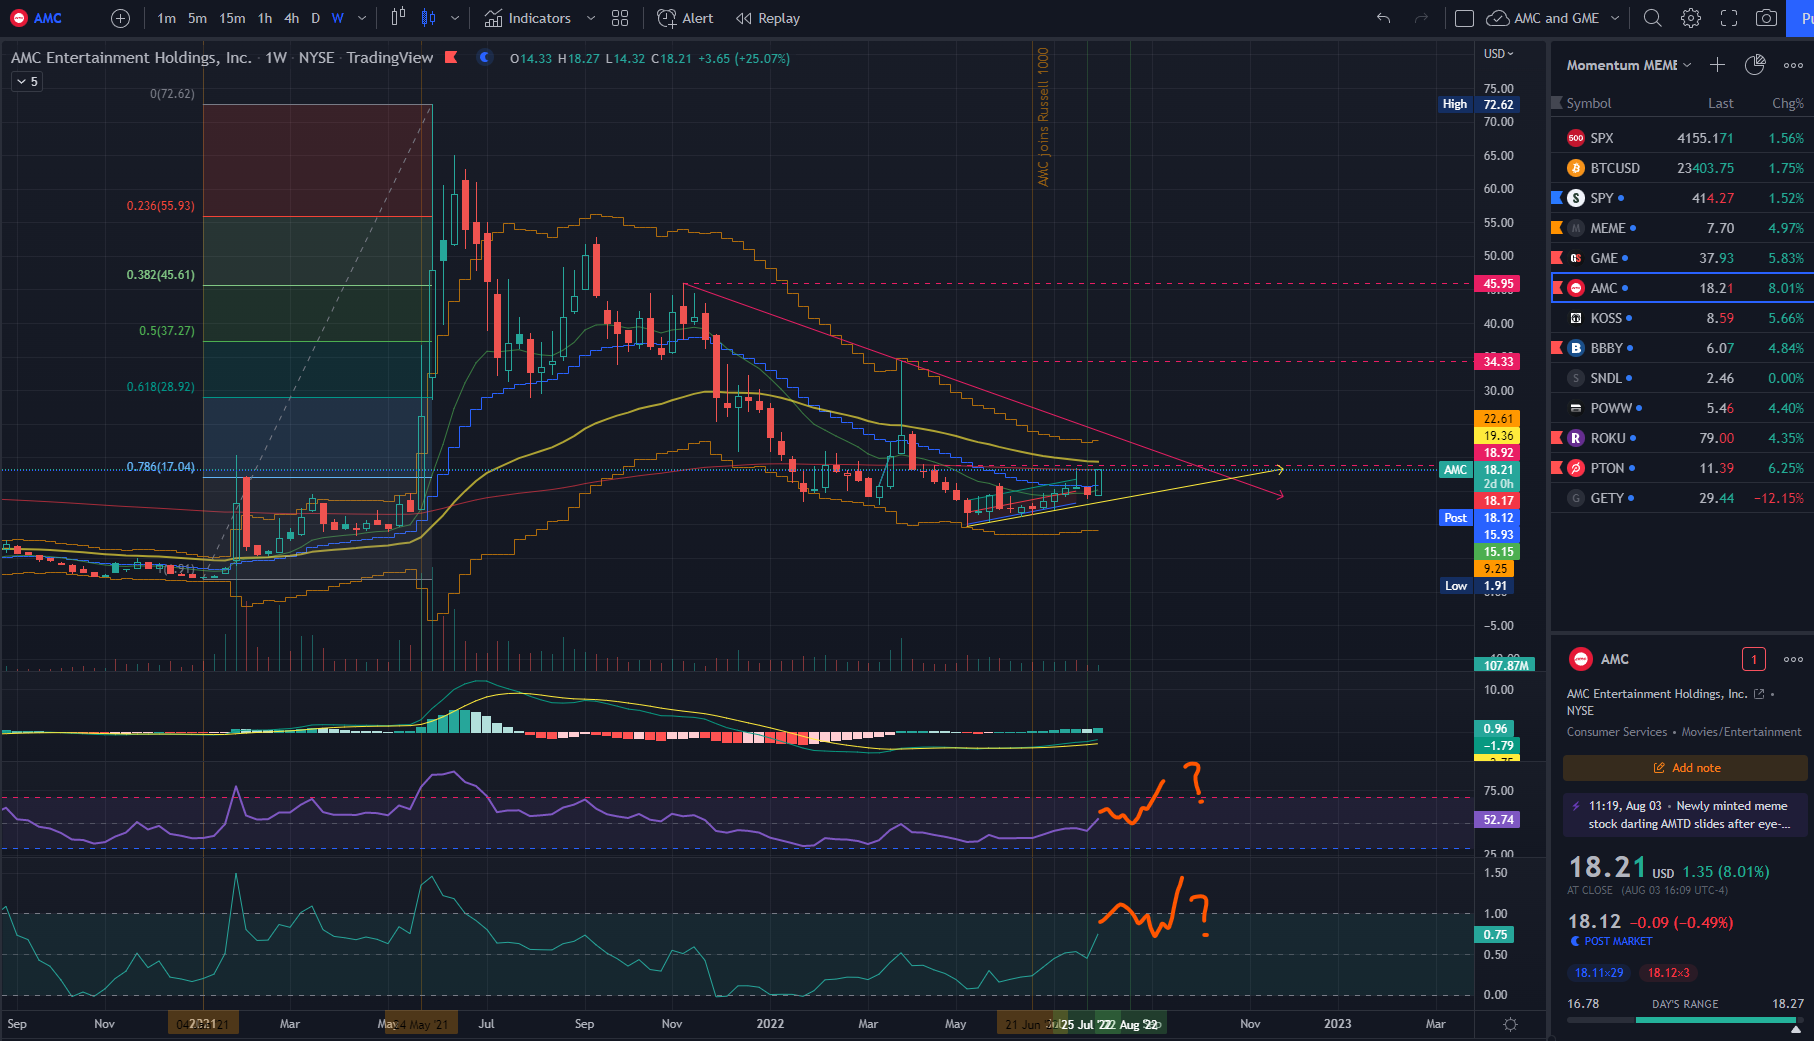
I want to see AMC break 18.92 to help confirm this bullish momentum for the next 2 weeks.
Now holding strangles to sell before ER tomorrow.
High target of 25 this August.
37 if more retards come out.
Keep it green.
xxx
Can’t wait to short this big time…
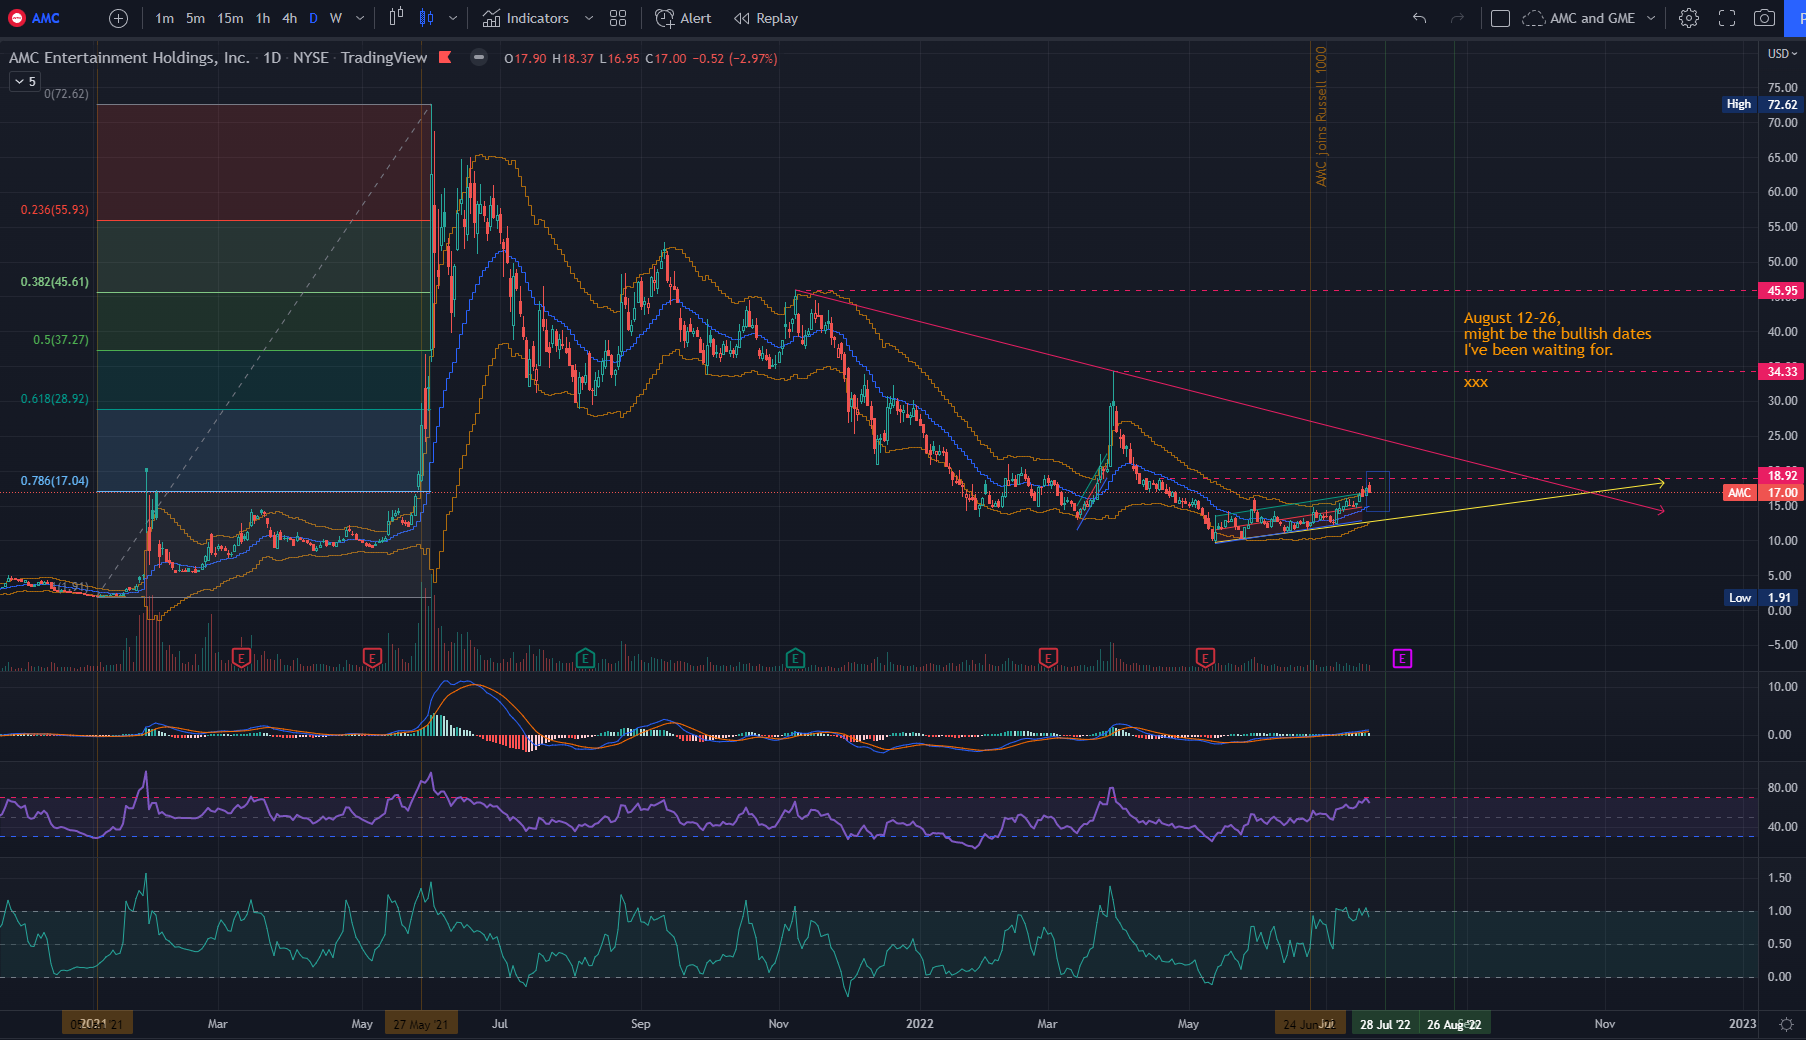
Currently have Reverse Iron Condors.
Will play the iV rush before ER, with strangles.
Then will build on Reverse Iron Condors again for Aug26 and/or September opex.
Later.
xxx
This time around, 90 will be the sweet target…
Nuff said. See you after this May ER.
I’m watching the 55 EMA line here…
Should price go over $20 once again in the next few days, AMC will have a Buy Signal for a possible short pop once again.
If you read the updates way below, I want AMC to consolidate over $15.
What needs to be consistent, is for the 55 EMA line to be under the price.
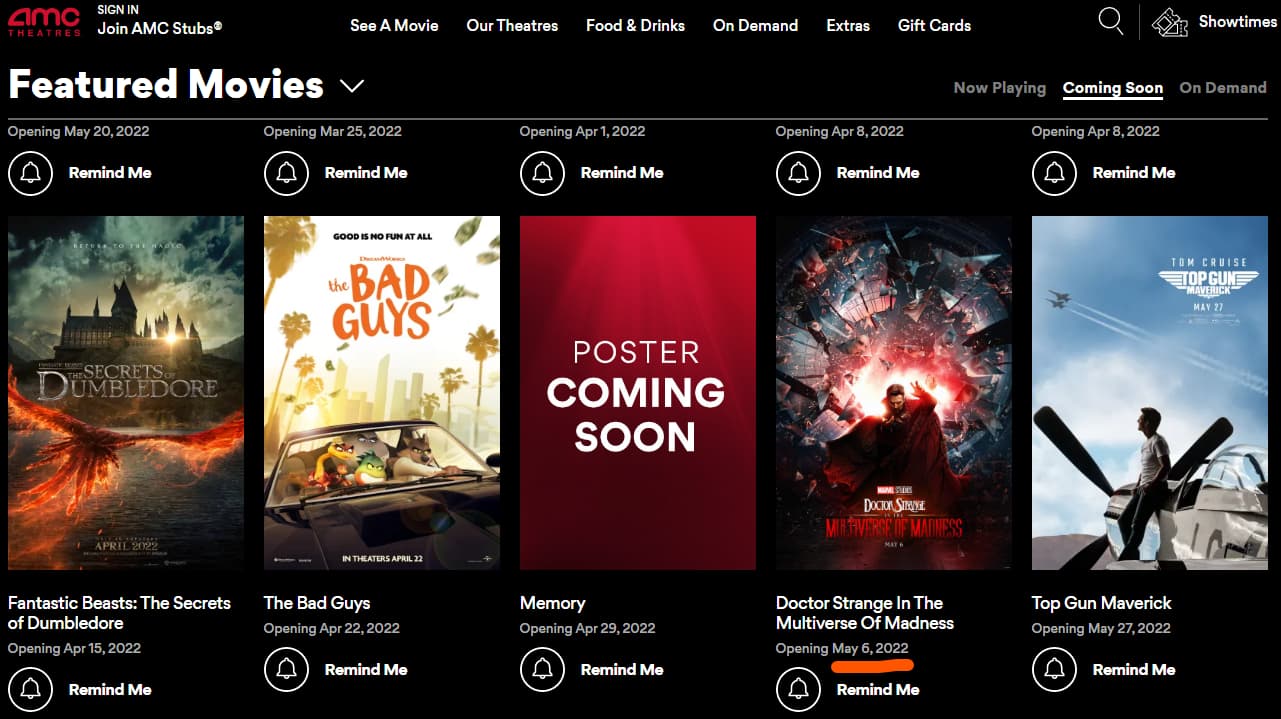
Given that Dr. Strange in The Multiverse of Madness will come out on May 6, 2022, I think AMC’s 2022 1Q ER will be scheduled the week after that.
May 9-12 is what I’m looking at. Will start a horizontal spread at least 1 week prior…

This trailer is siiiiick!!! I miss film production days. Not really.
AMC didn’t fall to 12, but instead ballooned to 20 before getting rejected.
I’m sticking to my guns this week that it will touch 16 again, before establishing its trend towards this March (4Q 2021) ER…
I think 12 will be a good line to watch…
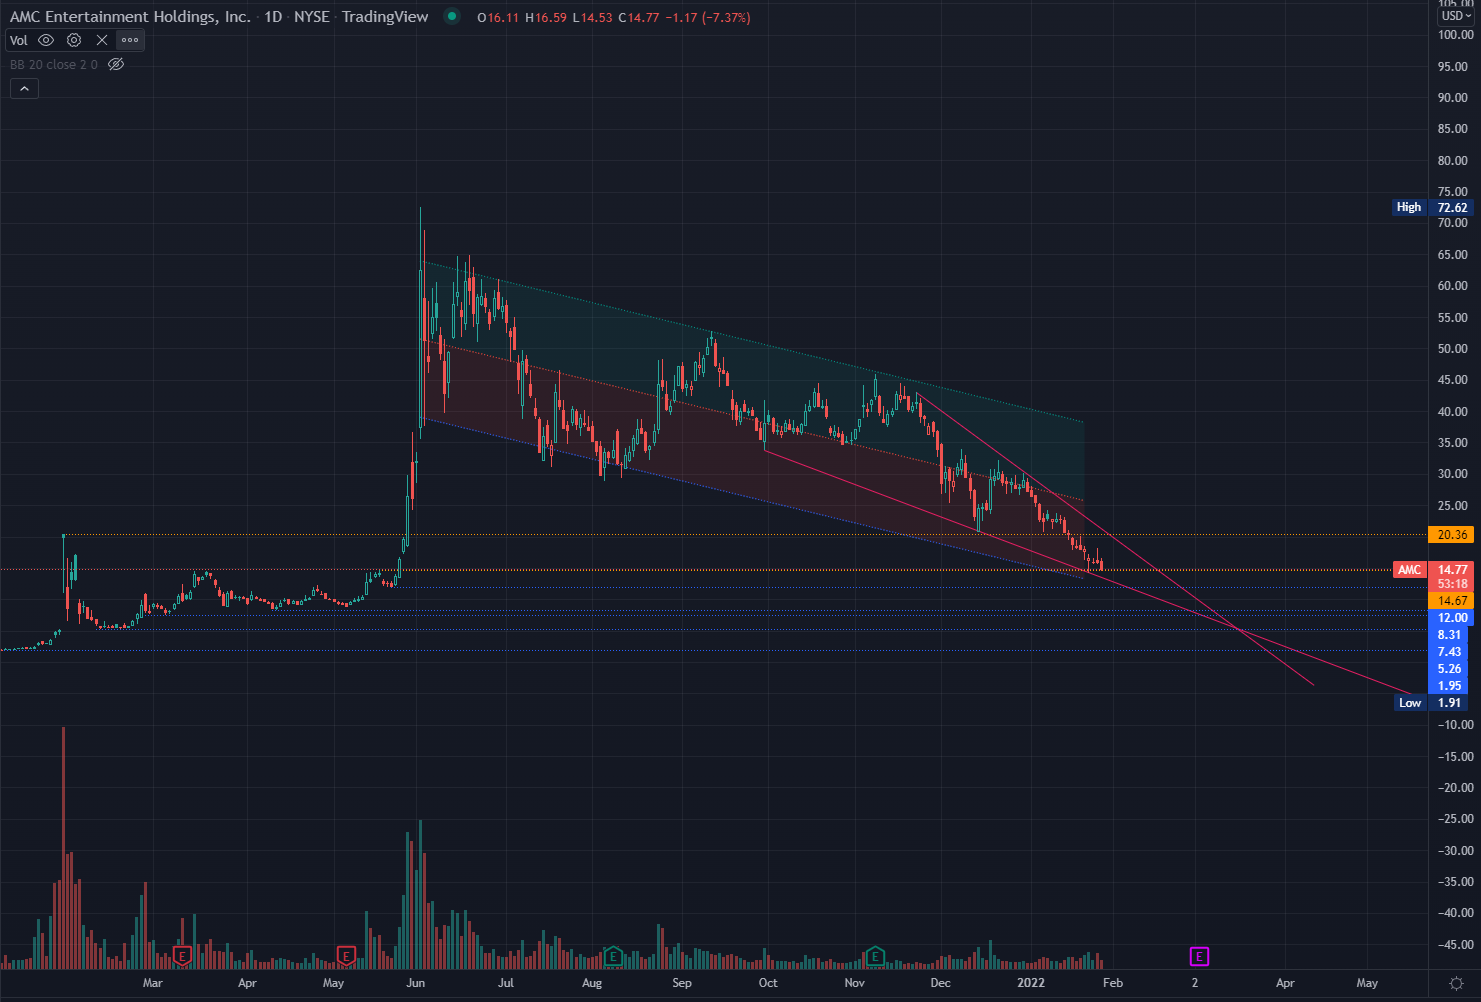
With ER getting nearer, and more MCU movies coming out soon, things may start to get interesting for the bulls again.
Based on what I’m looking at, most wannabe-apes have left the AMC jungle.
Here’s a short list of blockbusters…
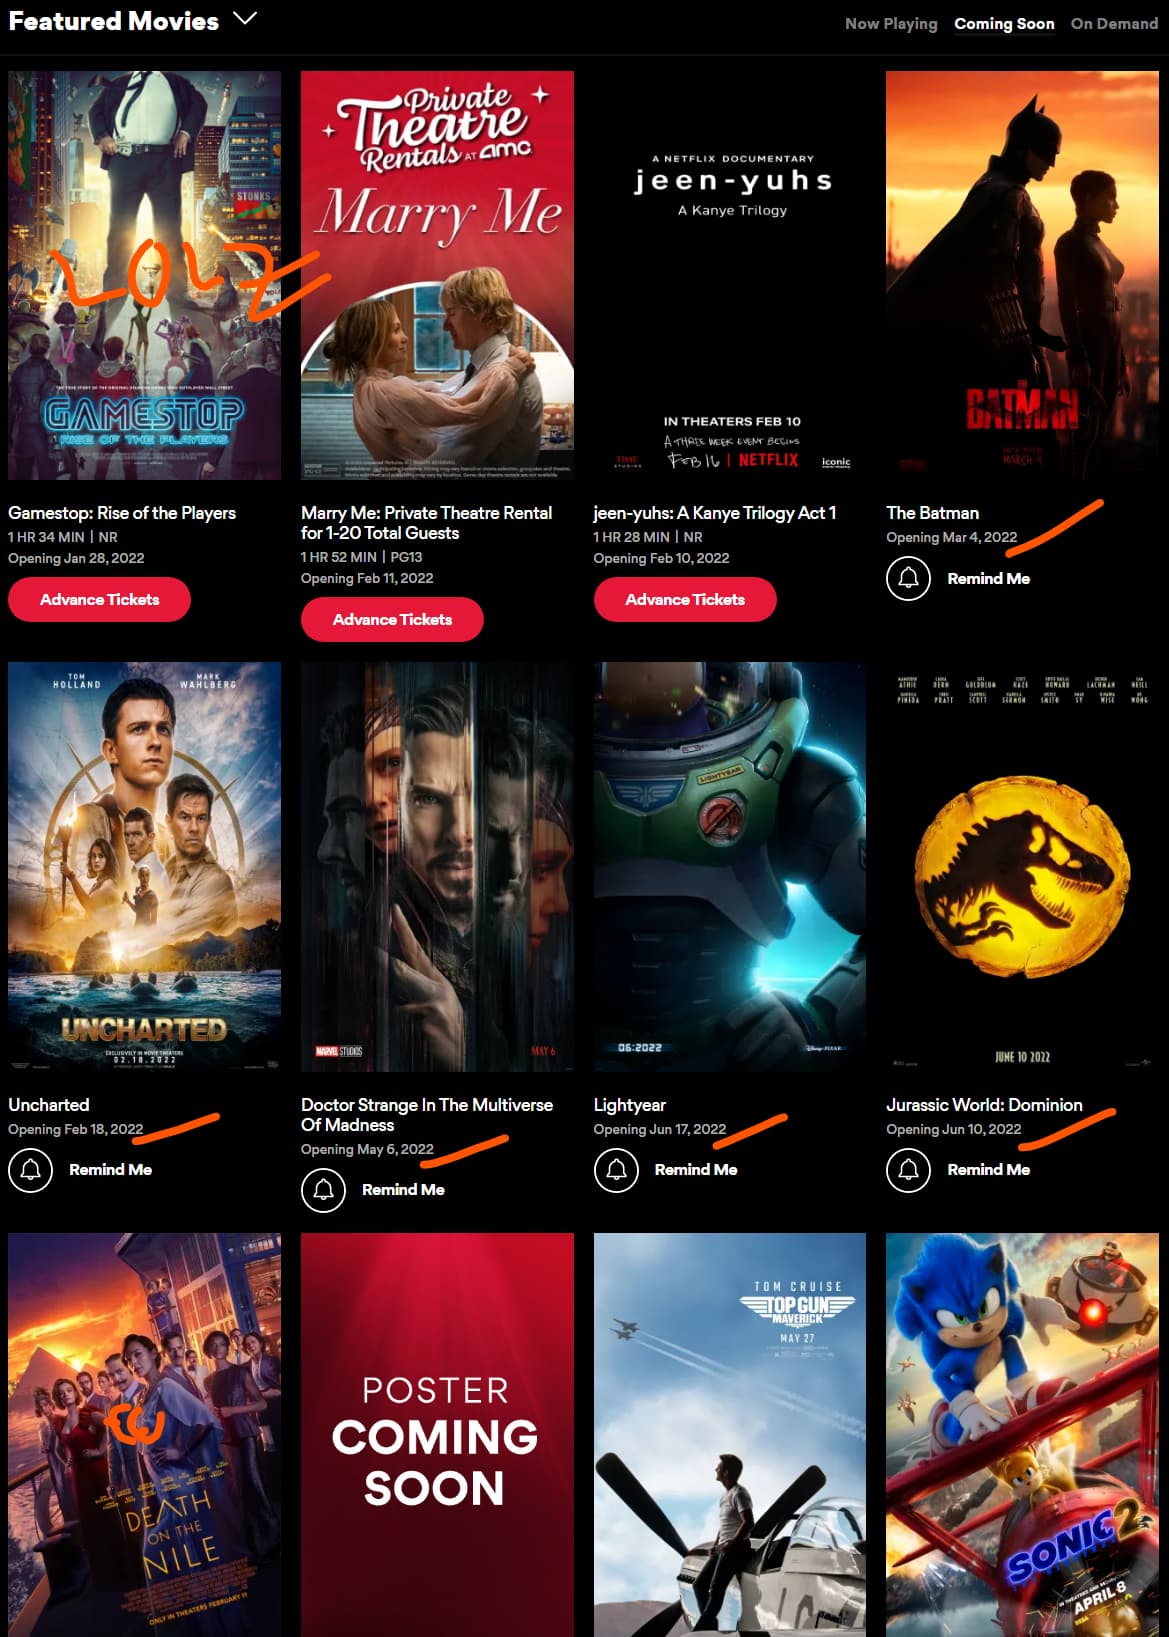
Oh no, Batman’s junk is out.
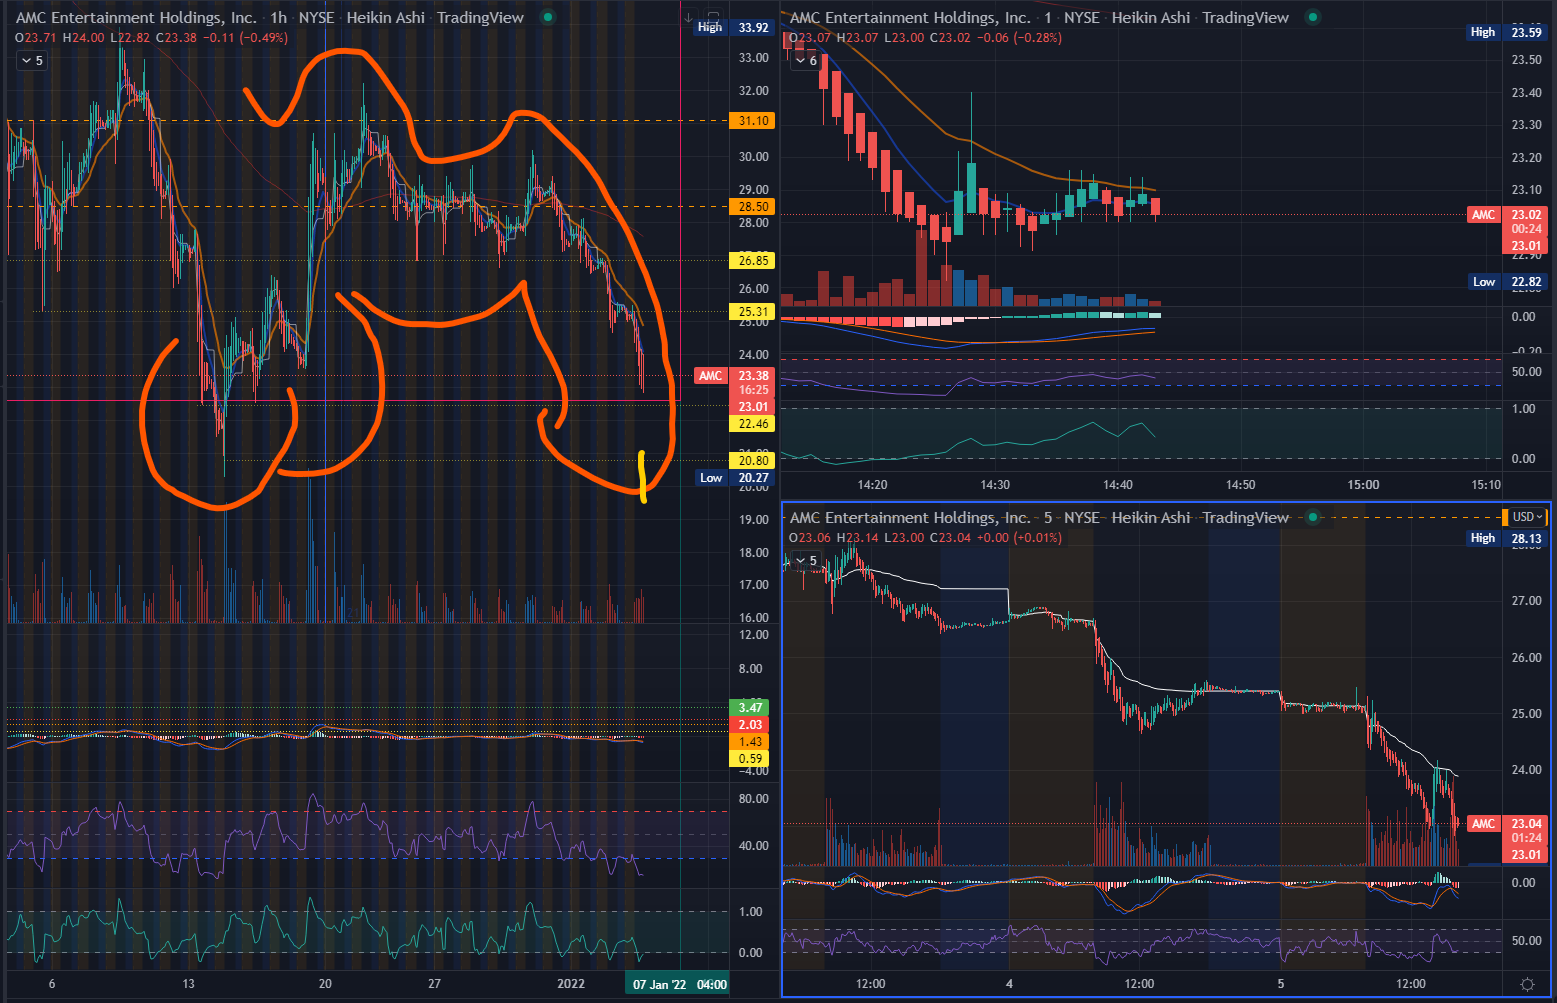
Since we’ve closed the AMC 3Q ER Play thread, yet we still see sentiment on this ticker (Trading Floor and beyond, but especially Trading Floor), I think it’s best you have a proper reference on what to look out for.
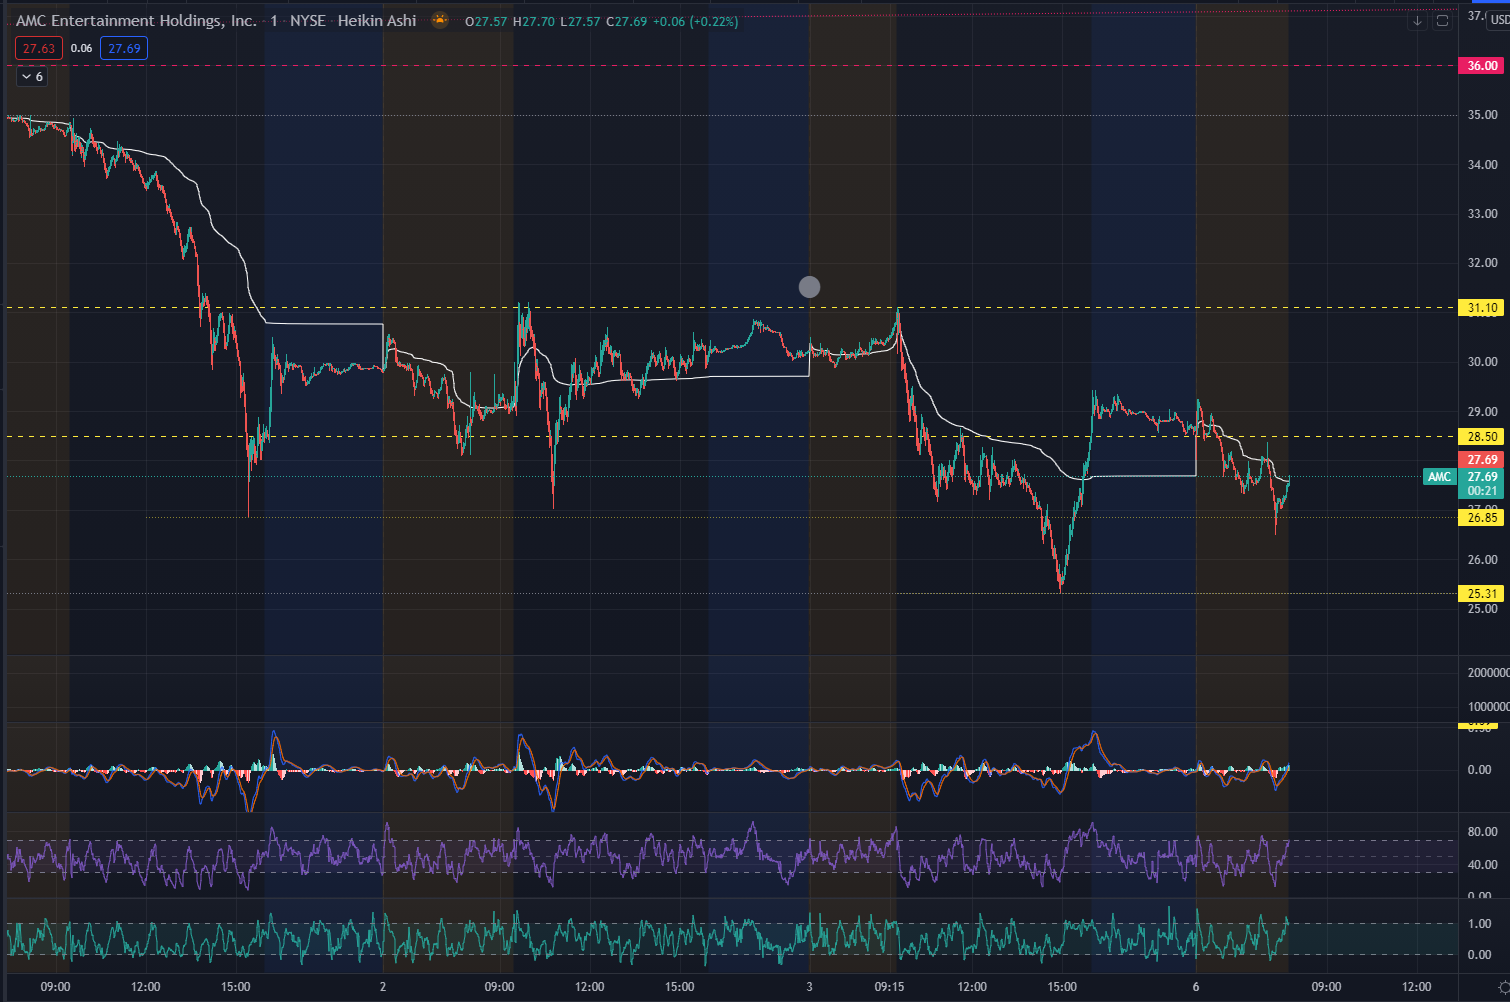
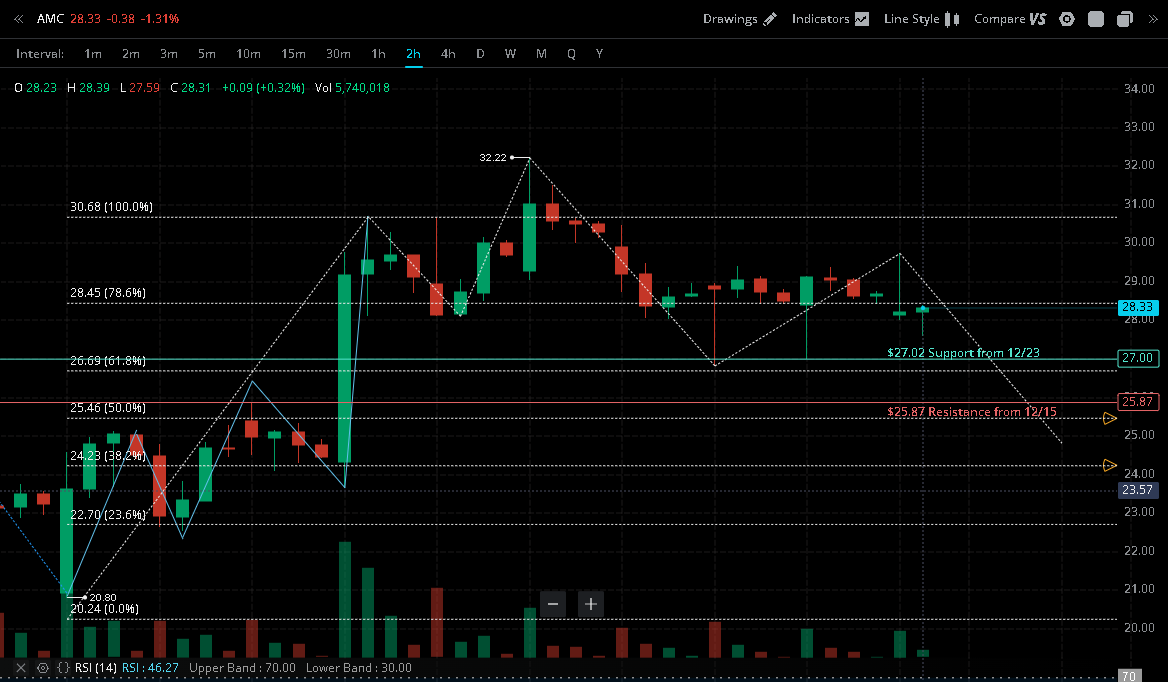
TLDR: Watch out for AMC to…
- try for 36 again,
- get rejected back down to 27 (or 25),
- before launching again to try for the moon one last time.
- When? In a few weeks or shorter.
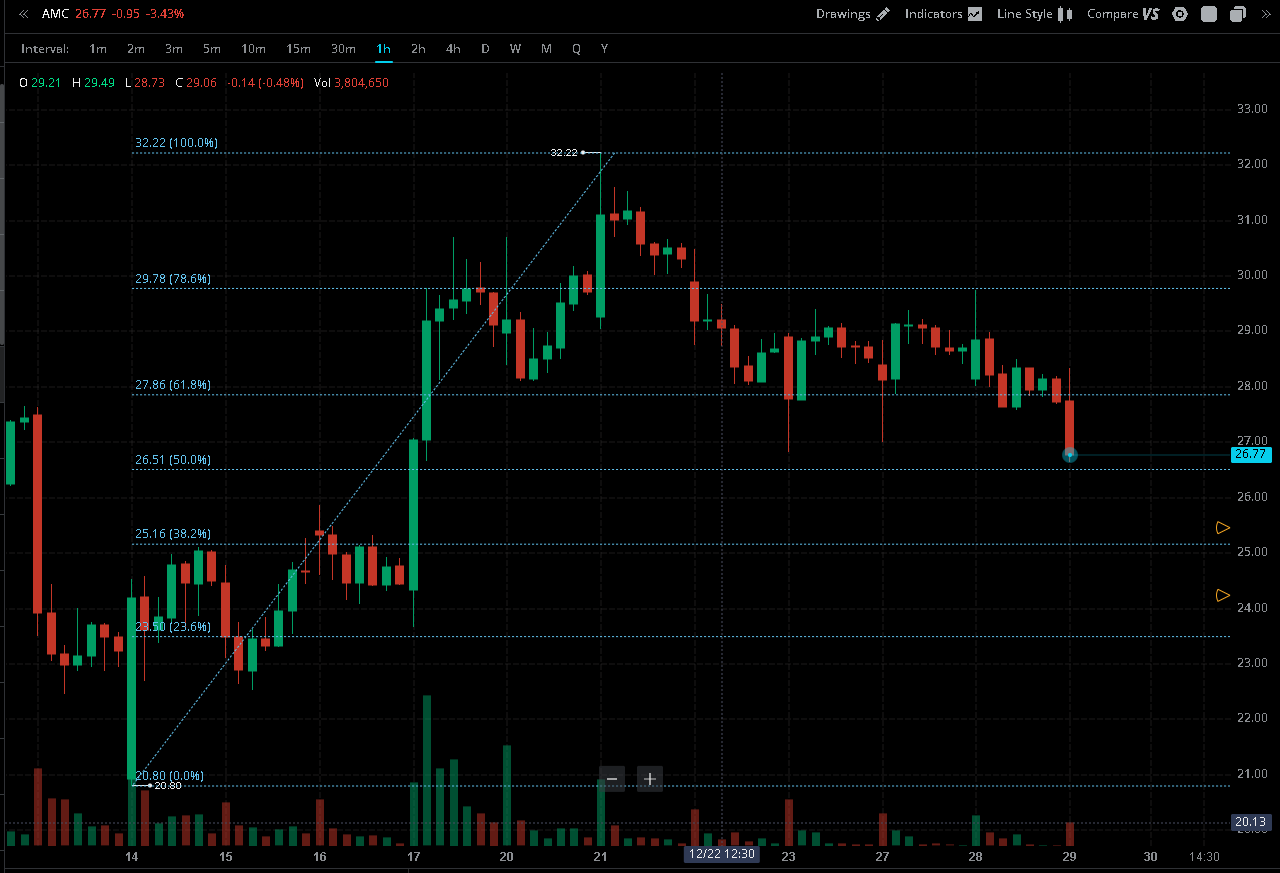
Charts…
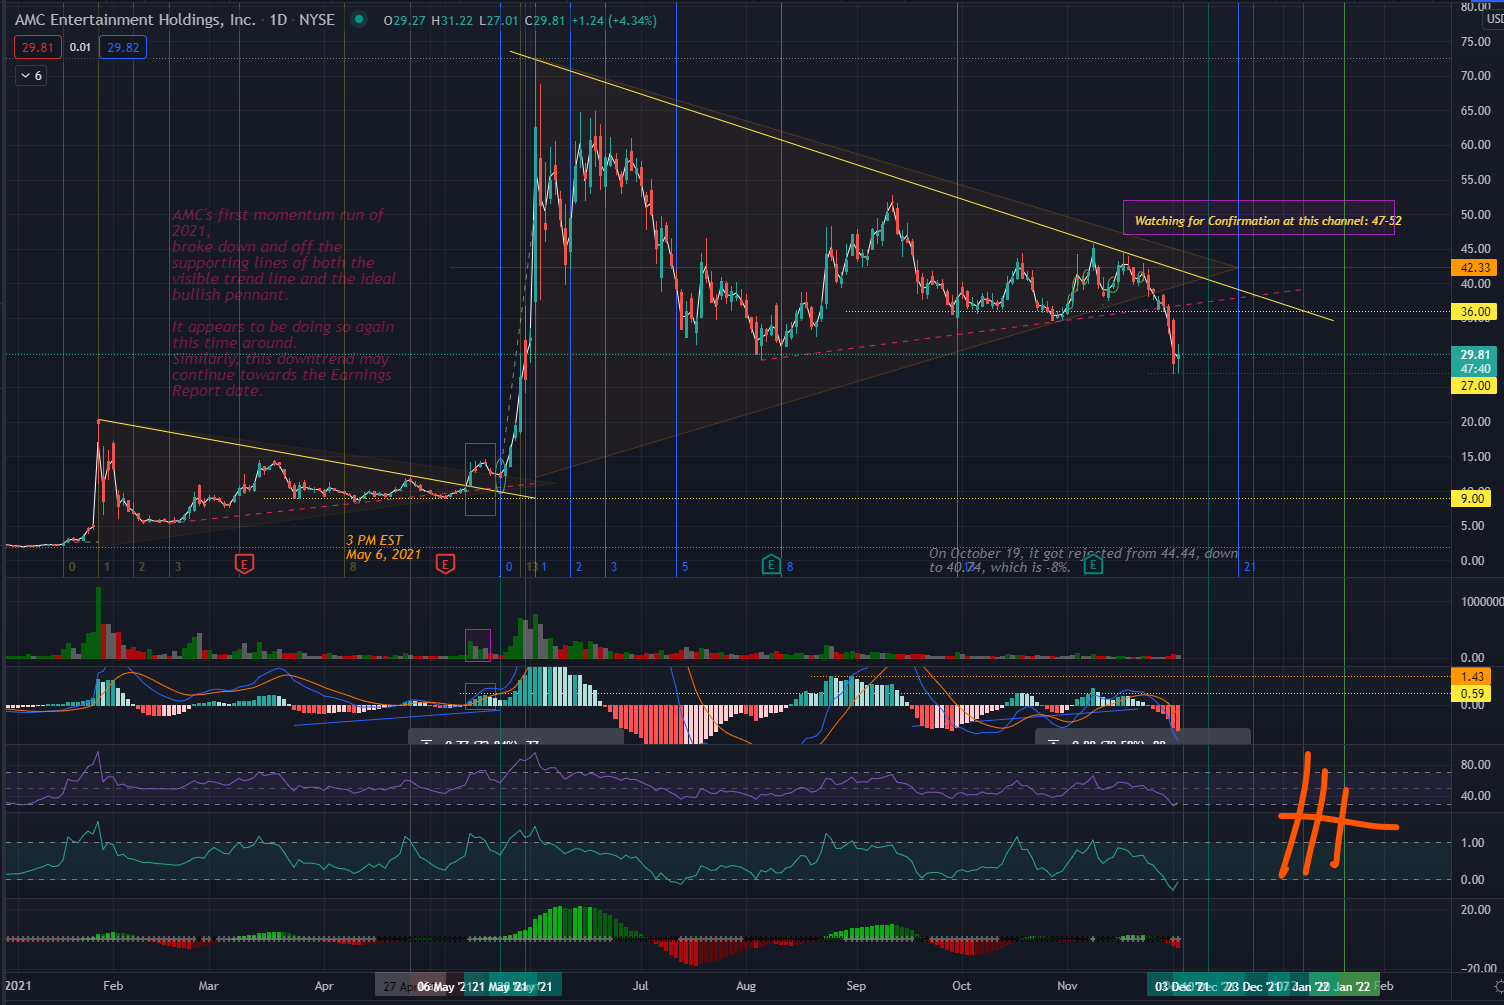
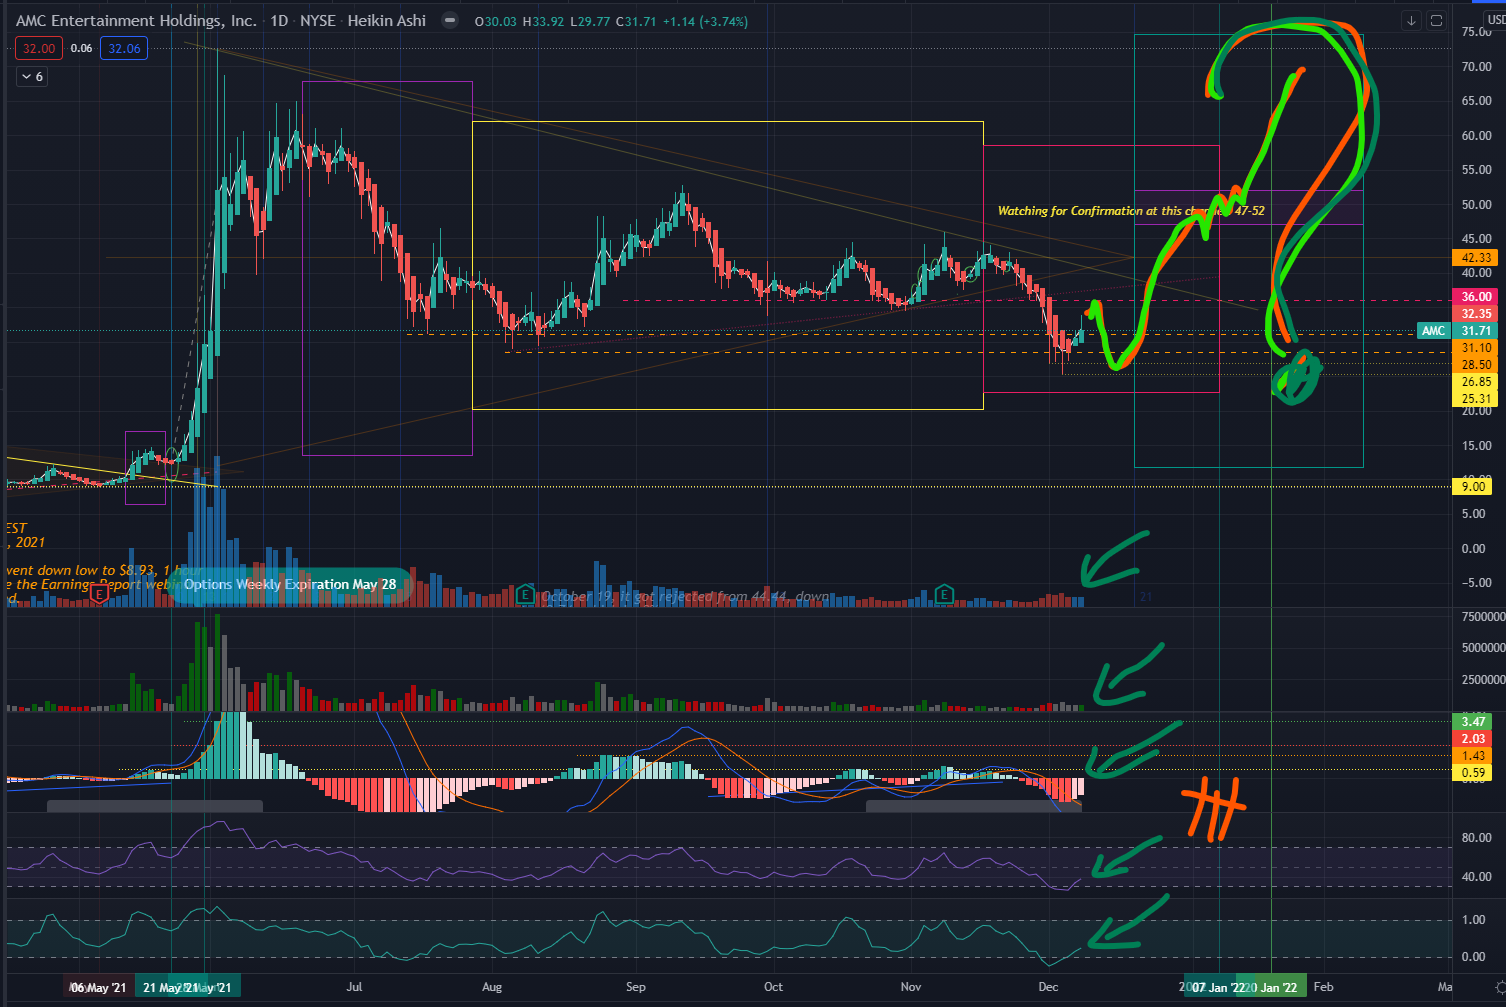
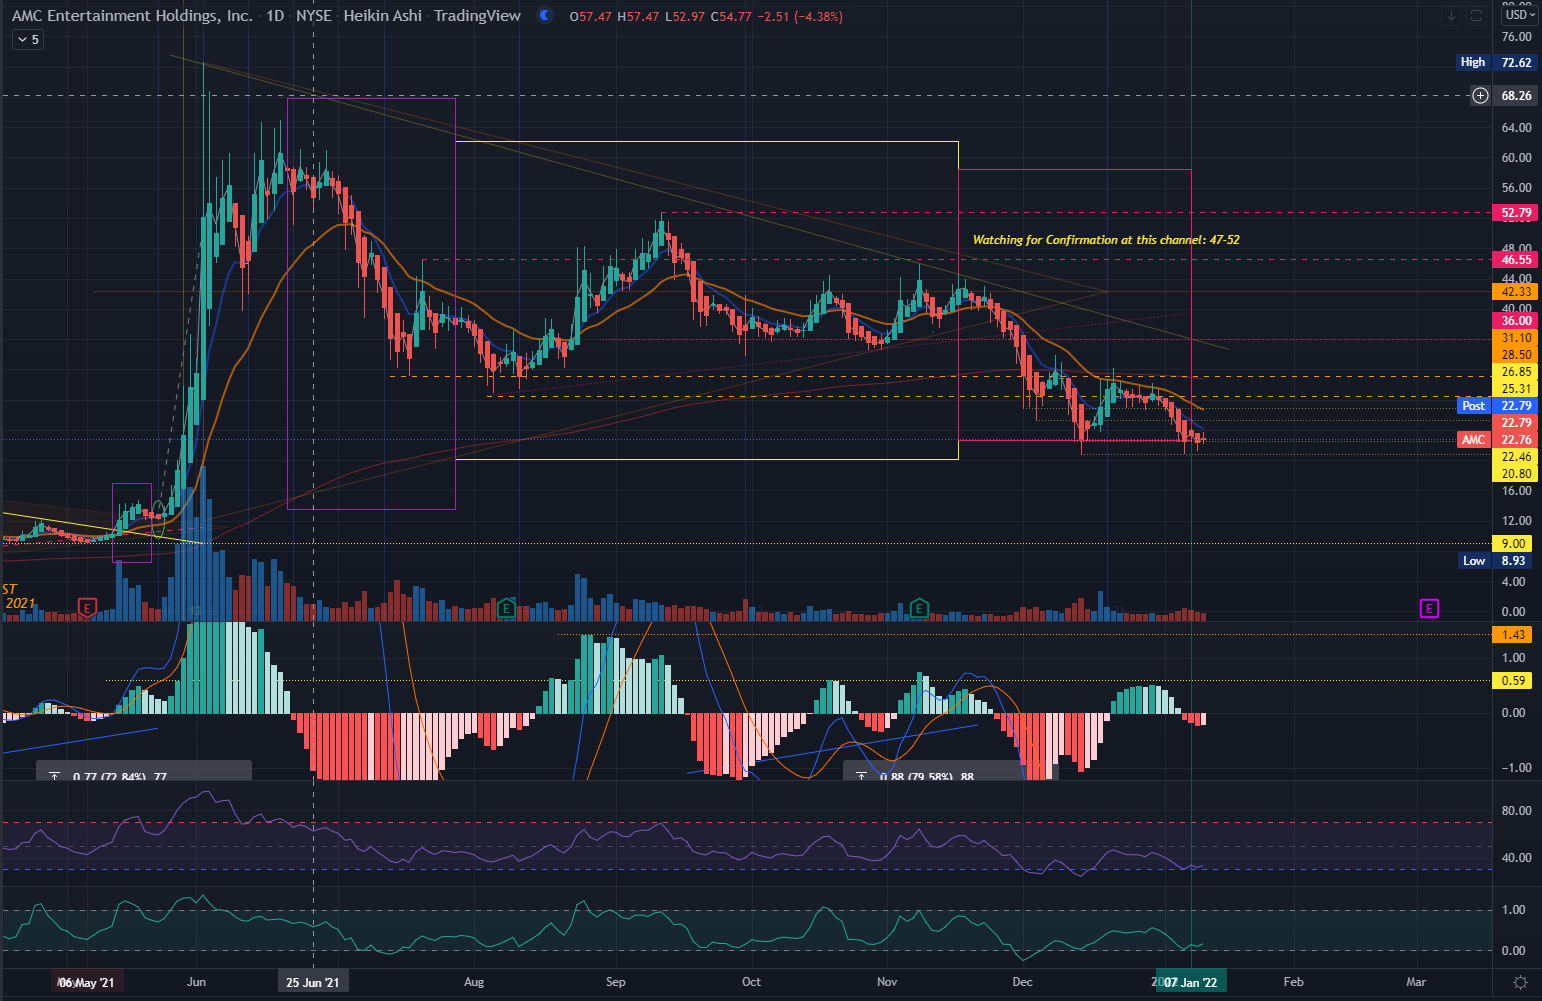
Quick review of where what I was hoping to see after 3Q ER.
Post ER most of us were hoping for the price to reach out to 52, to continue mirroring the end of May.
That failed due to lack of VOLUME–I enclosed the volume from May 12 to May 20 inside violet rectangles.
Note how that’s nowhere to be found from Nov 3 to Nov 16–despite getting to the 44-45 channel.
It was a fake-out. Why?
Buyers simply thought AMC wasn’t worth it at that price level.
Shorts were very much in profit–they only start getting squeezed at 47, 52, and 75–because those points are where they started.
Now where do we look to next? If you’re still somewhat emotionally invested in the stock, then read on.
If you are out of the stock, then congratulations! You’ve made the greatest step in keeping sane. Stay out.
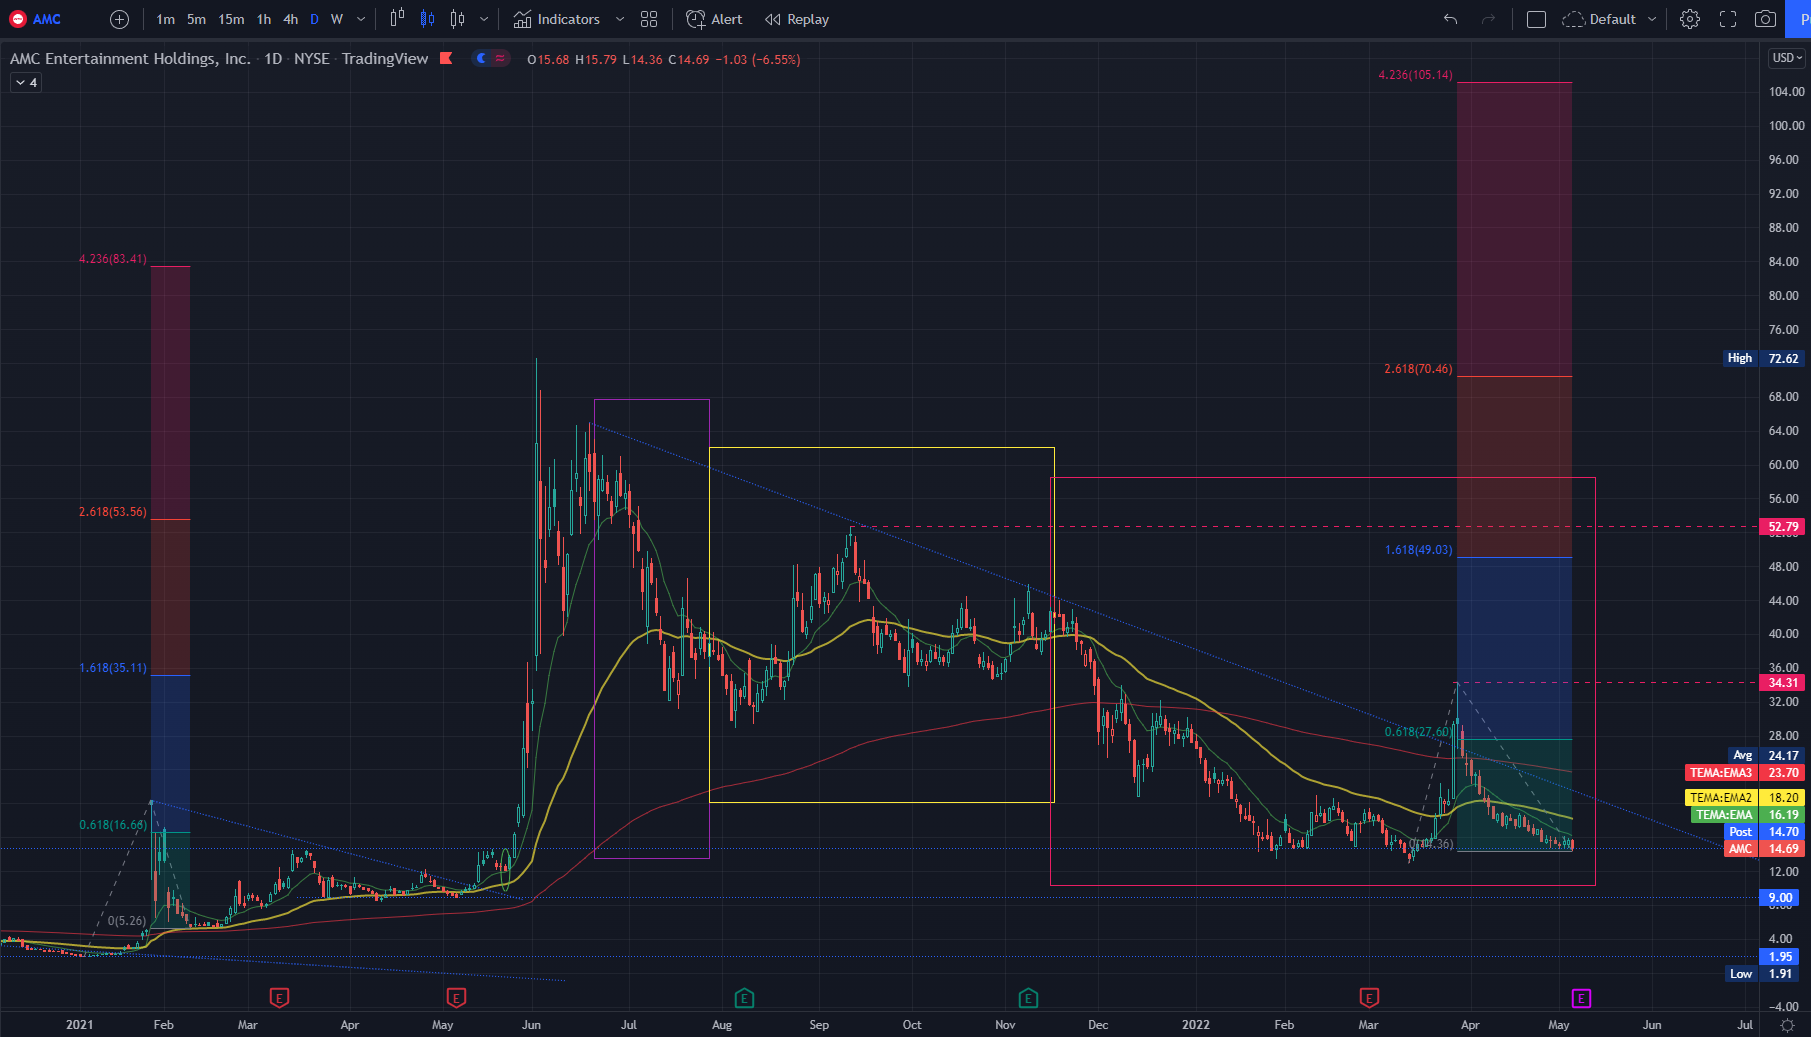
The Standard…
What you are looking at is GOLD vs AMC, both on their 2nd Runs.
This is my personal study of the Monthly GOLD chart which I then use to compare similar looking runs to.
Incidentally, there’s a much deeper theory here than I was initially aware of–always good to learn from veterans. More on that later.
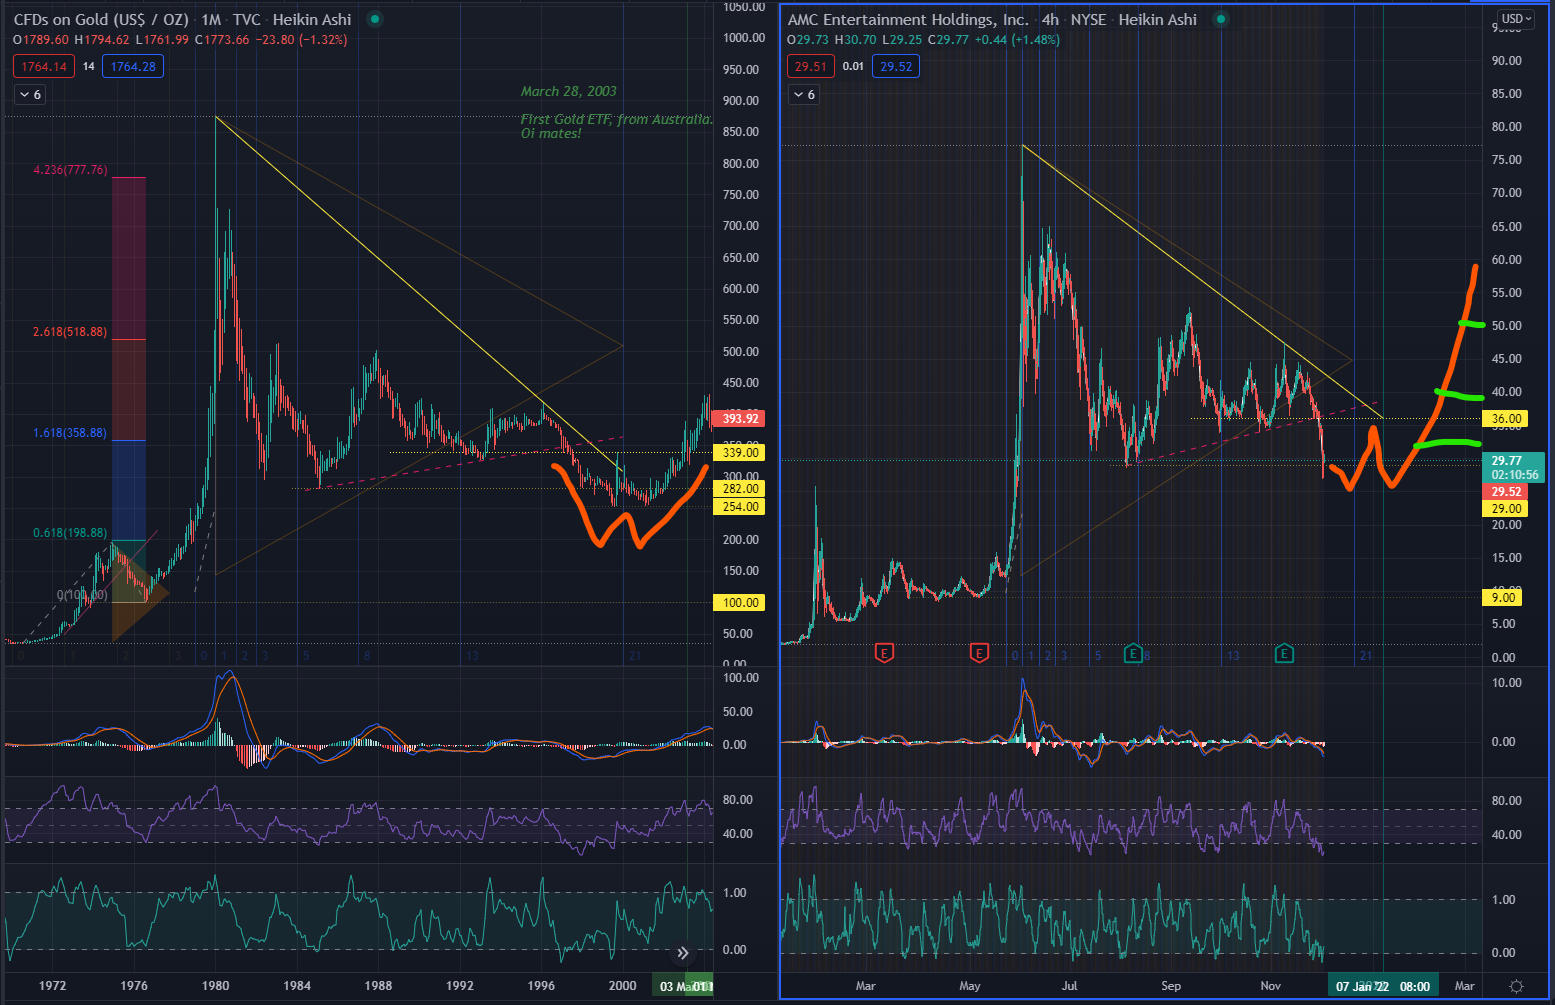
Looking at GOLD, you see it break out downward from its visible support line (pink dash line).
- It was also wedged for months on the 339 line.
- Afterwards, it kept bouncing on the 282 line, until a further breakdown to 254, where we see a spike of Buying Power.
- It tried for the 339 again and got rejected, eventually came back down to 254, to finally start flying again all the way to $1,920.00 in Sept 1, 2011.
The end of that wedge was Jan 1, 1999. Or close to that.
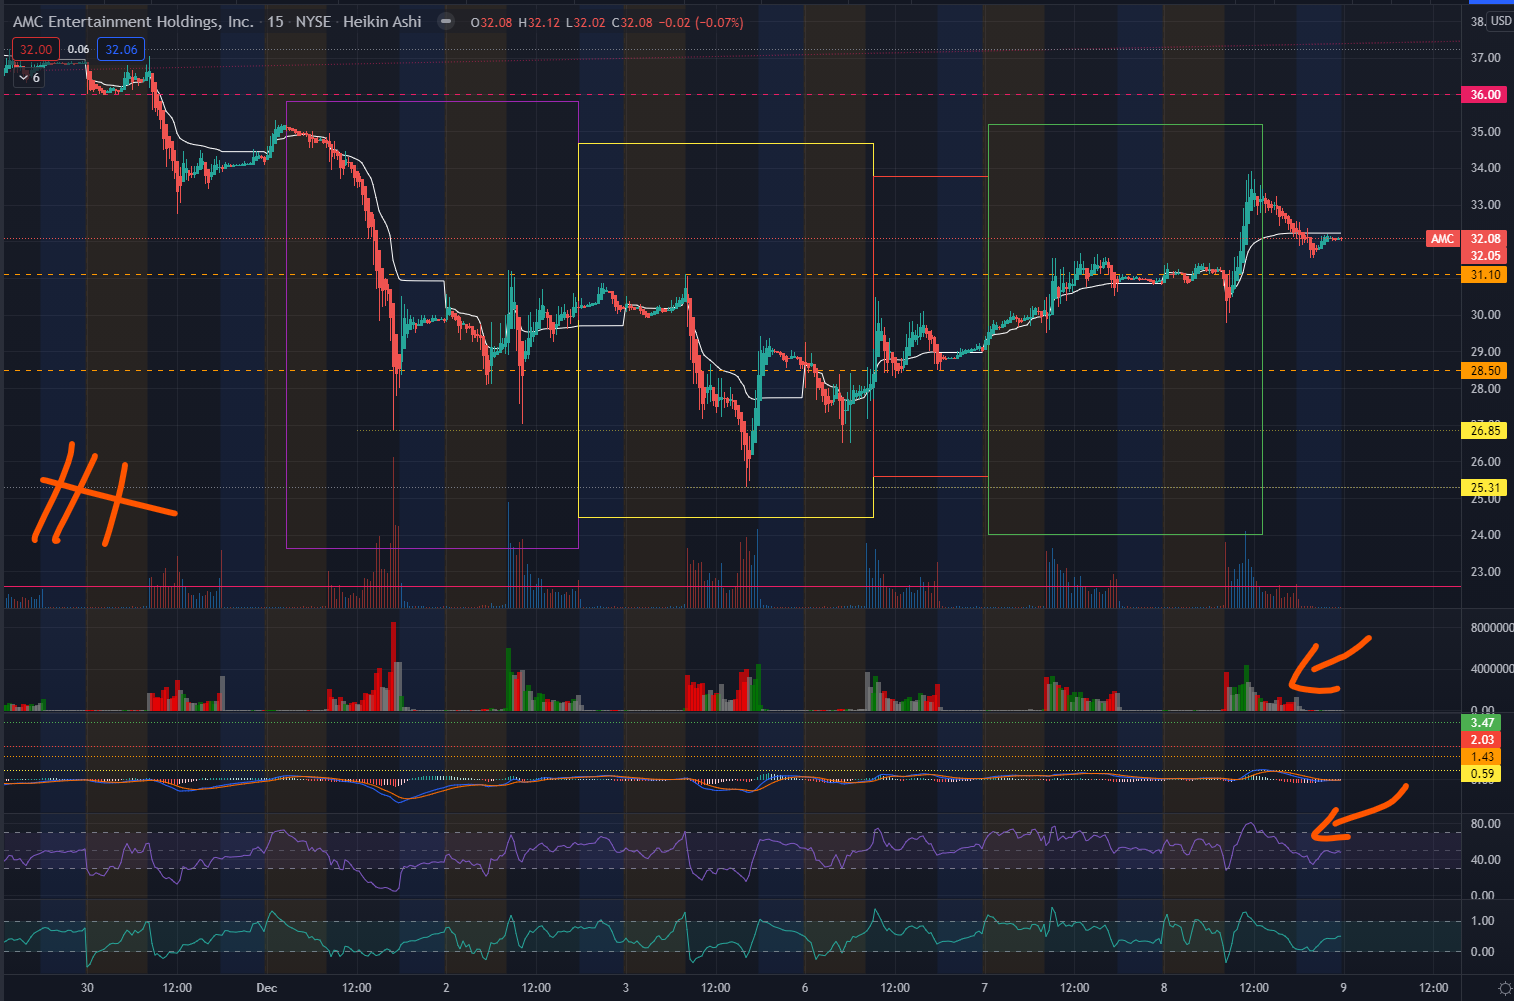
For AMC, we have to look at the same possible signs on a much compressed time frame.
- I will be looking for a Double Bottom either here at 27 or possibly 25.
- I’d like for it to try 35-36 and get rejected back to that bounce line, before continuing to break out again.
- Then I will look for entries at 30, 40, and 50.
- The end of AMC’s wedge is Jan 7, 2021.
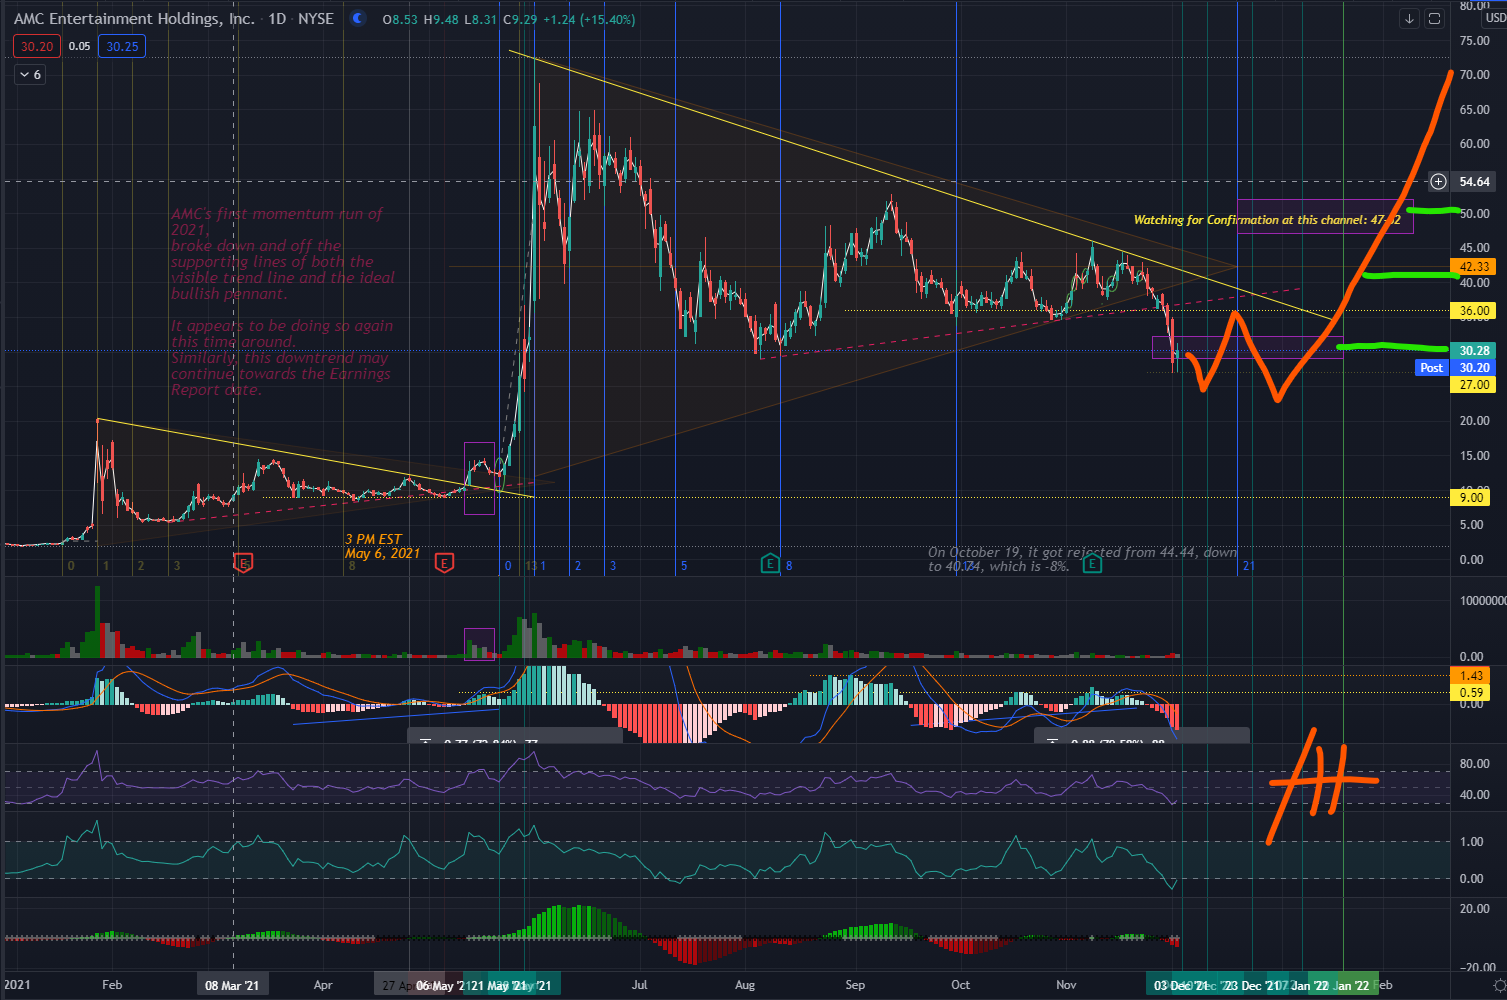
Another option will of course be for AMC to just immediately take flight from this lower channel of 25-30.
I just don’t see that happening anytime soon.
Will this ever happen? Who knows? But I’d rather you be aware of what to look out for now, rather than getting sucked in endlessly by friendly youtubers and/or the morally ethical pump and dumpers of reddit.
Regardless of all the good news coming out from and surrounding AMC–it needs Buying Volume.
To be clear: I still have positions in AMC spread across a few brokers–just because. Nothing special.
Don’t wait for nothing! There are a lot of good possible trades here in the forums.
Don’t get your capital trapped needlessly. Keep liquid and keep it green.