I figured it would be helpful to have charts of the days FOMC minutes are released. Each release I have a full day 1m chart, and a second that zooms in showing only +/- 1 hour from 2pm for people to easier identify prices and whatnot. I also will be including a table with the High / Low for each candle -2m thru +3m of the 2pm eastern release. If you want more detailed data you can do it yourself!
I’m going to do these in chronological order starting Jan 2022. Webull is not very friendly trying to go back and I literally had to keep it on the 1m and scroll back day by day. It would be nice to get 2021 data if some other platform like maybe ToS or TV lets you jump back in time more efficiently maybe someone else can grab it.
January 5, 2022 (Full Day):
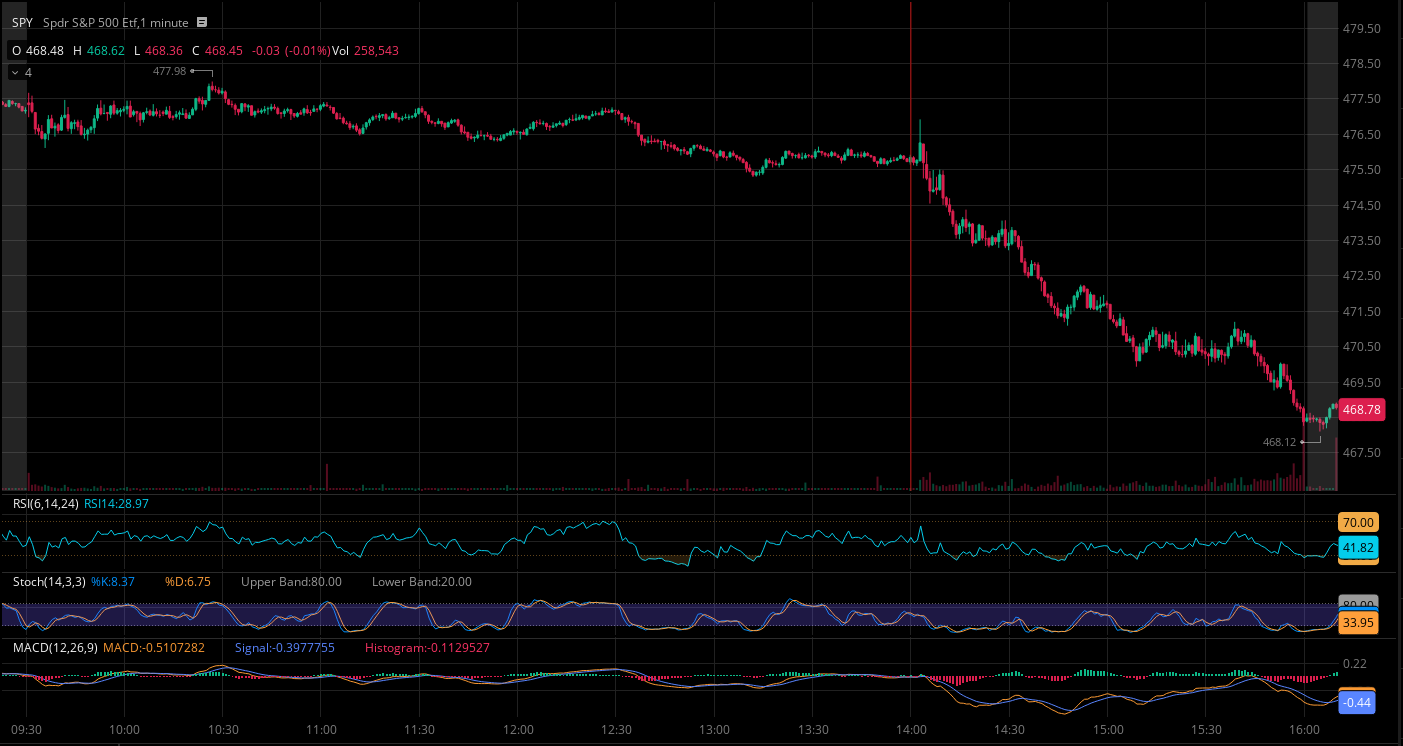
| 1:58 | 1:59 | 2:00 | 2:01 | 2:02 | 2:03 |
|---|---|---|---|---|---|
| 475.90 - 475.79 | 475.82 - 475.73 | 475.91 - 475.66 | 475.87 - 475.64 | 475.78 - 475.62 | 476.91 - 475.75 |
January 5, 2022 (Zoomed In):

February 16, 2022 (Full Day):
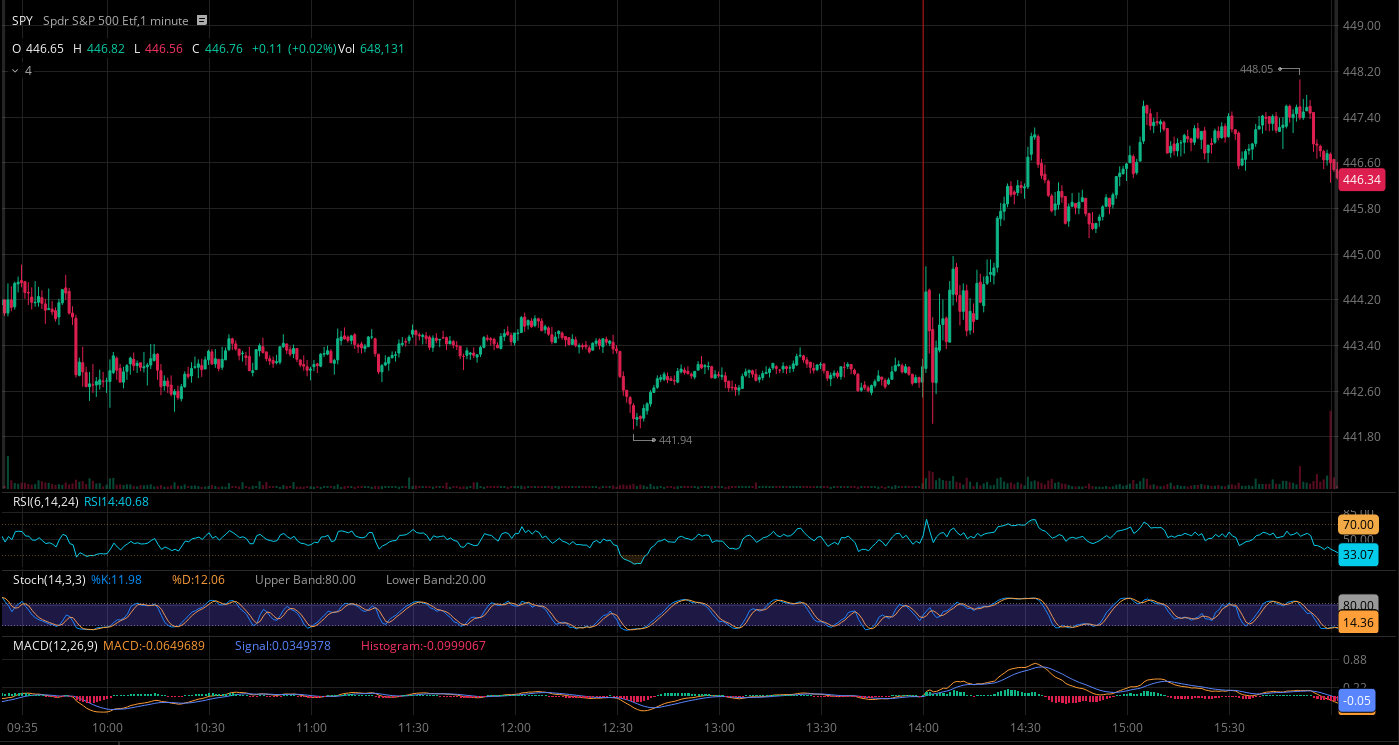
| 1:58 | 1:59 | 2:00 | 2:01 | 2:02 | 2:03 |
|---|---|---|---|---|---|
| 442.88 - 442.75 | 442.85 - 442.67 | 443.16 - 442.50 | 444.78 - 442.93 | 444.39 - 443.27 | 443.89 - 442.04 |
February 16, 2022 (Zoomed In):

April 6, 2022 (Full Day):
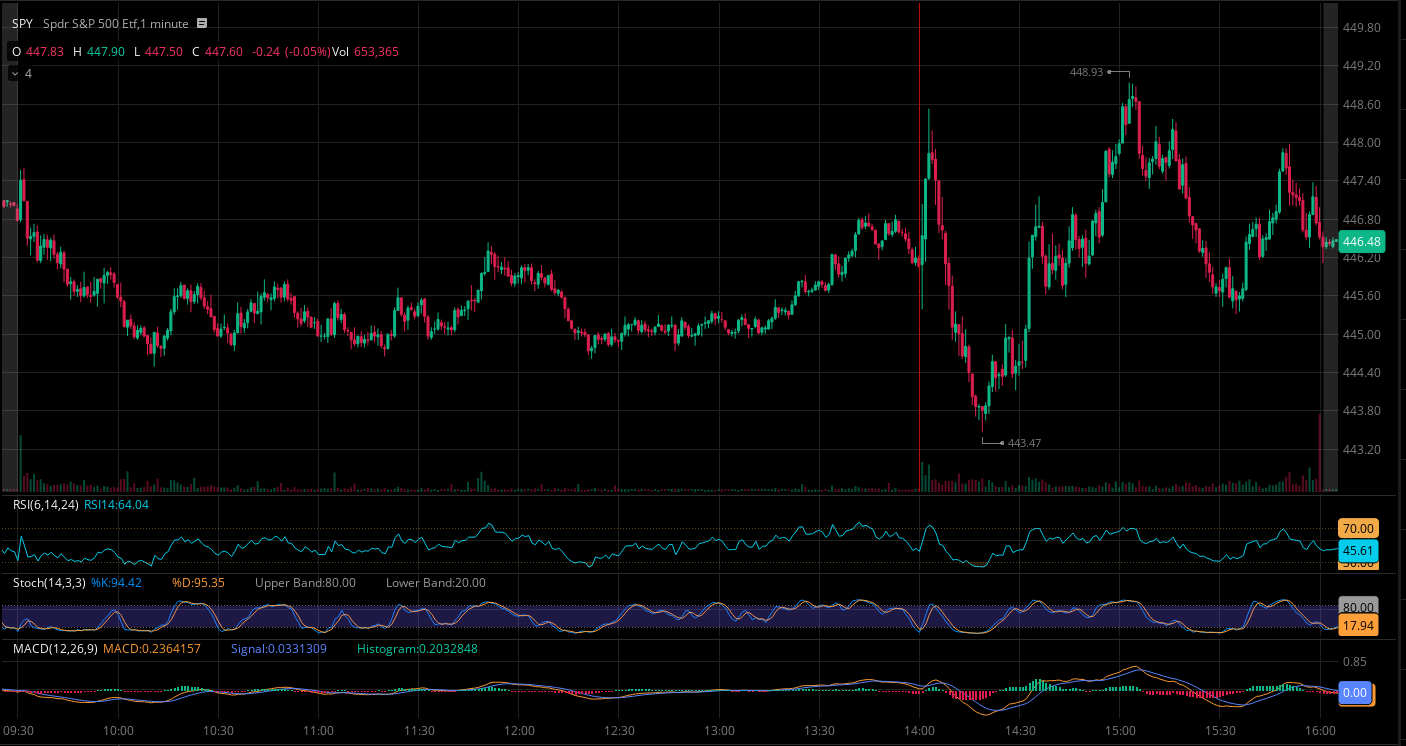
| 1:58 | 1:59 | 2:00 | 2:01 | 2:02 | 2:03 |
|---|---|---|---|---|---|
| 446.35 - 446.10 | 446.36 - 446.08 | 446.22 - 446.05 | 447.03 - 445.40 | 447.43 - 446.14 | 448.52 - 447.42 |
April 6, 2022 (Zoomed In):

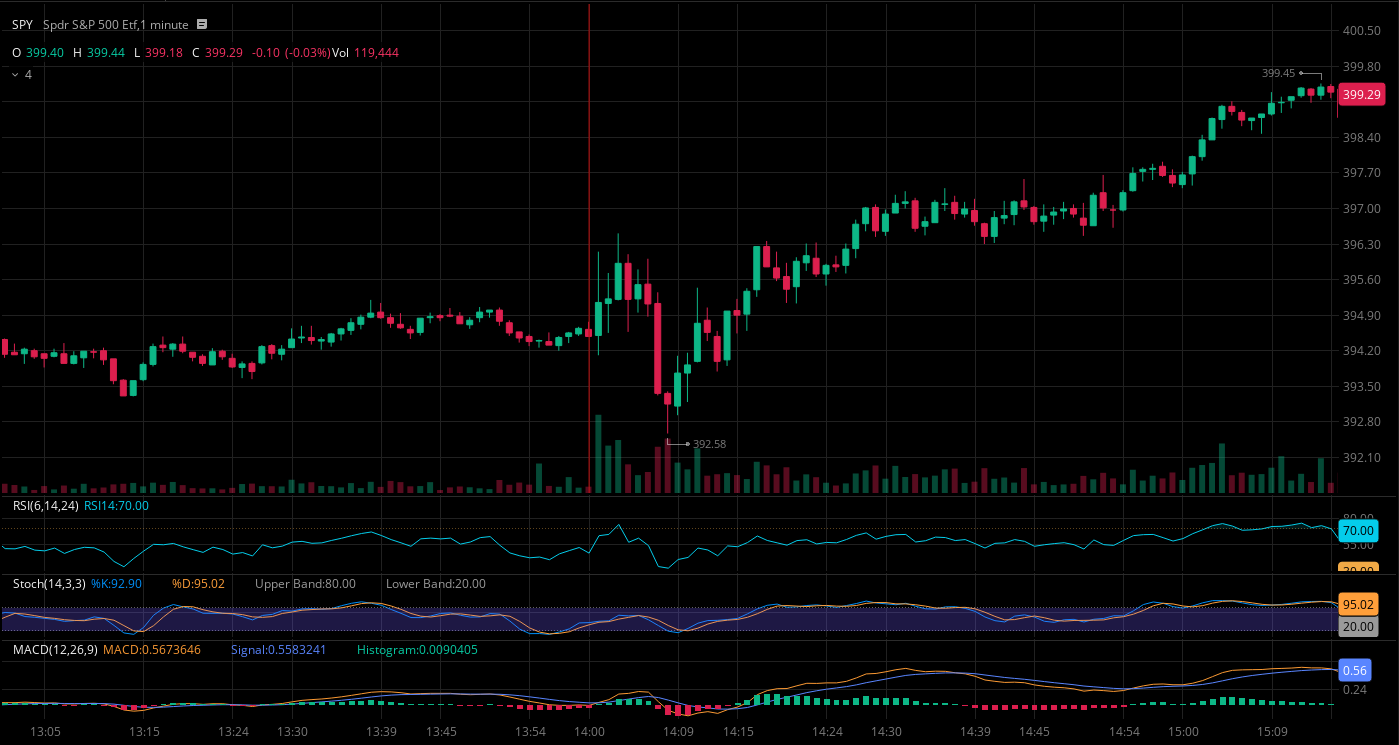
May 25, 2022 (Full Day):

| 1:58 | 1:59 | 2:00 | 2:01 | 2:02 | 2:03 |
|---|---|---|---|---|---|
| 394.56 - 394.36 | 394.66 - 394.50 | 394.76 - 394.48 | 396.14 - 394.12 | 395.72 - 394.56 | 396.50 - 395.20 |
May 25, 2022 (Zoomed In):
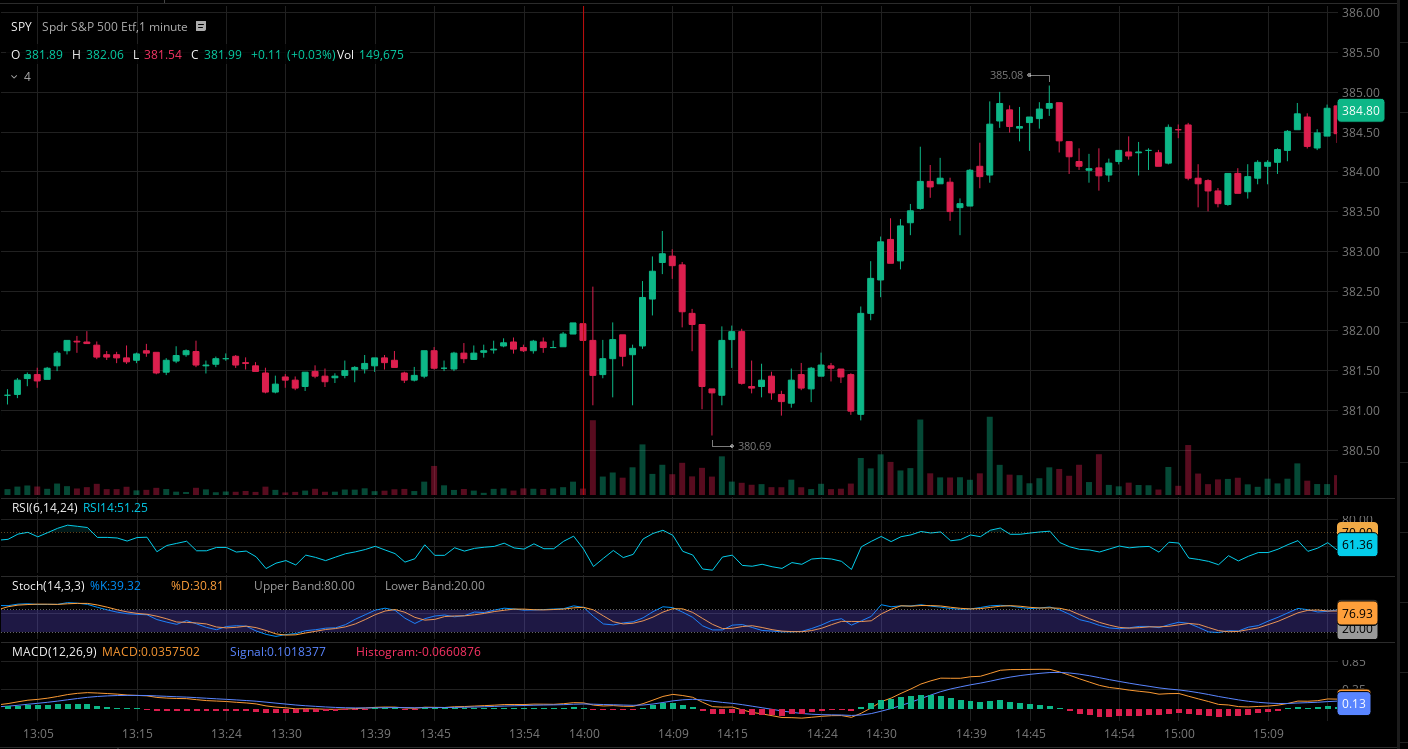
July 6, 2022 (Full Day):

| 1:58 | 1:59 | 2:00 | 2:01 | 2:02 | 2:03 |
|---|---|---|---|---|---|
| 381.98 - 381.80 | 382.10 - 381.96 | 382.09 - 381.88 | 382.55 - 381.07 | 381.88 - 381.41 | 382.10 - 381.17 |
July 6, 2022 (Zoomed In):
August 17, 2022 (Full Day):

| 1:58 | 1:59 | 2:00 | 2:01 | 2:02 | 2:03 |
|---|---|---|---|---|---|
| 426.69 - 426.59 | 426.77 - 426.61 | 426.75 - 426.66 | 427.58 - 426.34 | 427.32 - 426.52 | 427.79 - 426.80 |
August 17, 2022 (Zoomed In):
