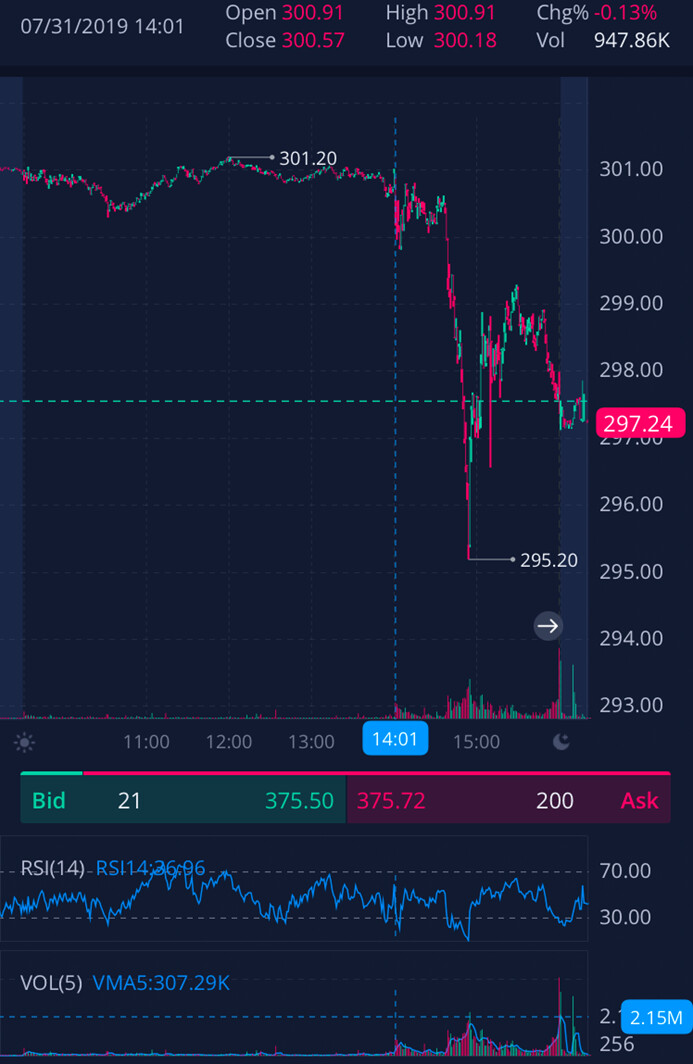
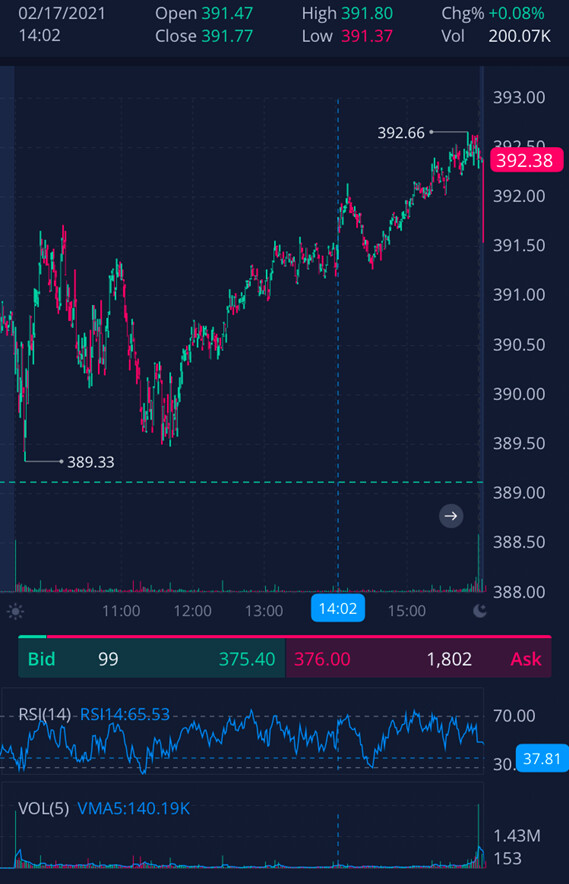
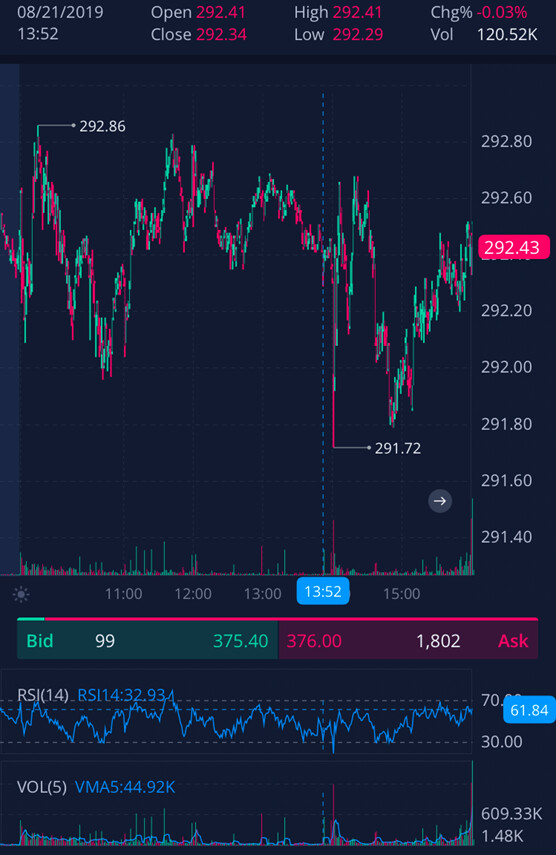
Just like with the FOMC rate decision Data I put up earlier, Ive made an Excel workbook for the FOMC mins release day. I tried to clean it up a little so it is easier to read and understand. The dates have hyperlinks to the charts that show the entire day and zoomed in to around 1:30-2:30 for those days. PLEASE REMEMBER that I only use delta for my option price calculations so if you hold to close, theta will make the option prices lower. The good news is this method was very accurate at estimating option prices on the last Rate release day, at least until 2:30. I stopped tracking real-time data after that because of work.
I use .44 for delta in this book but you can and should enter your actual delta into it when the time comes to get a better estimate. I did that last time and it made me an extra $6 per option!
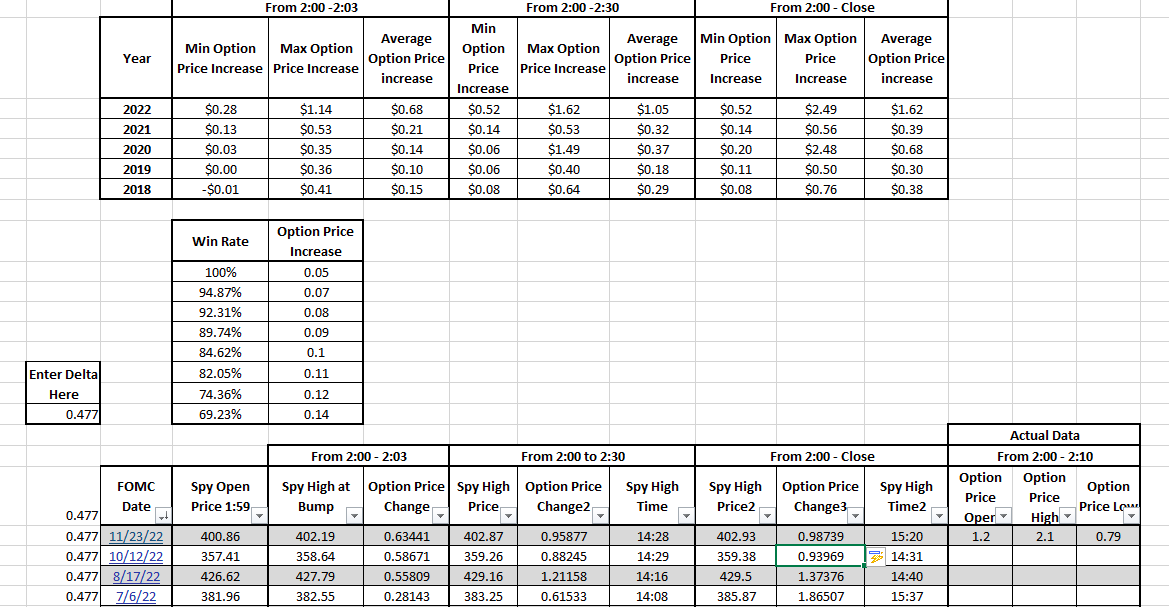
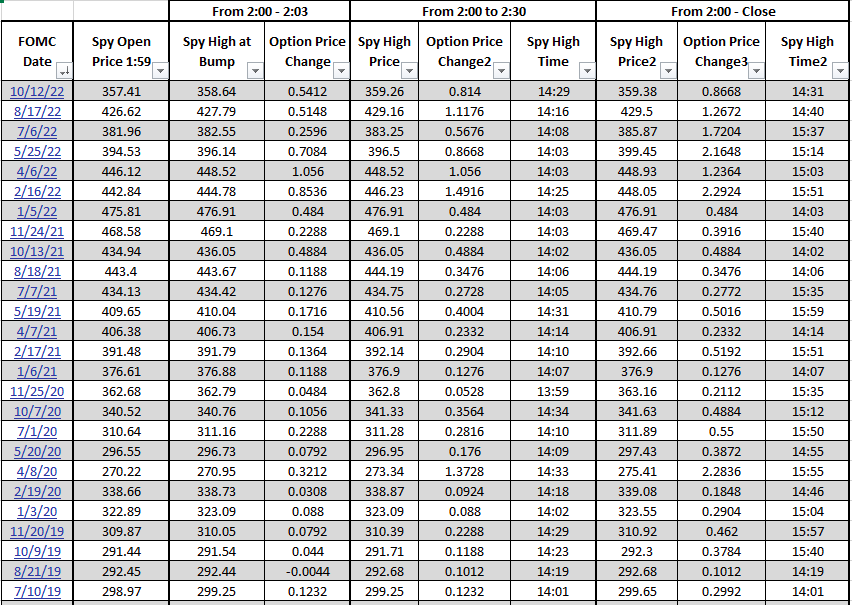
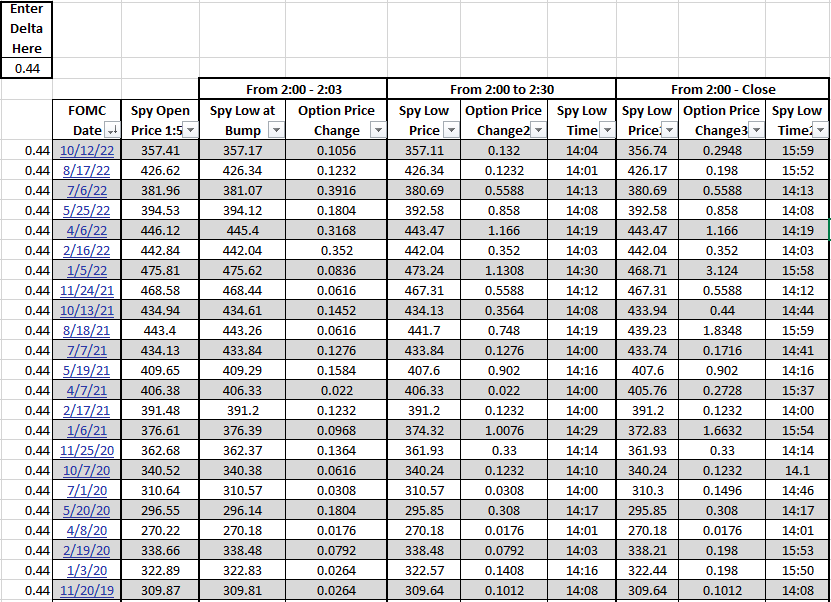
The option price increase column is estimating how much I can expect my options price to increase from the price I paid for it at 1:59. So if I pay $1 for an option at 1:59 and are expecting a min option price increase of .25 based on .44 delta, then I set my sell limit for $1.25.
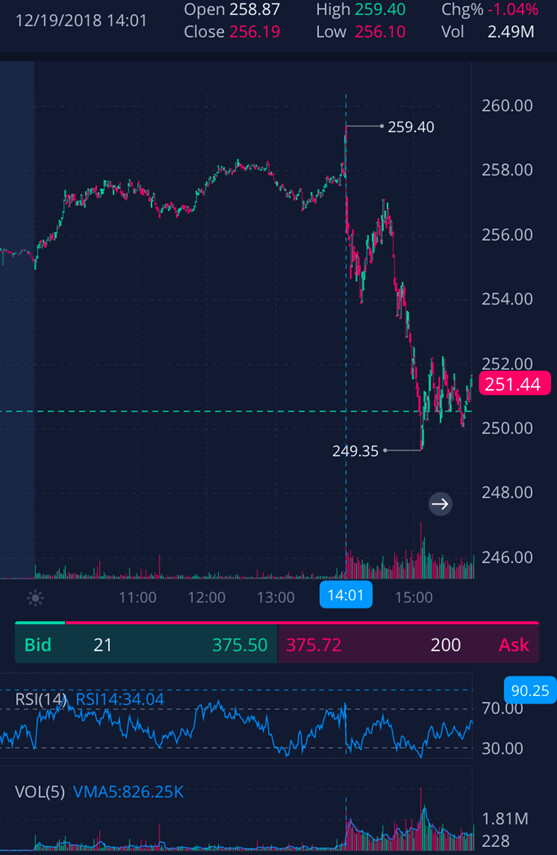
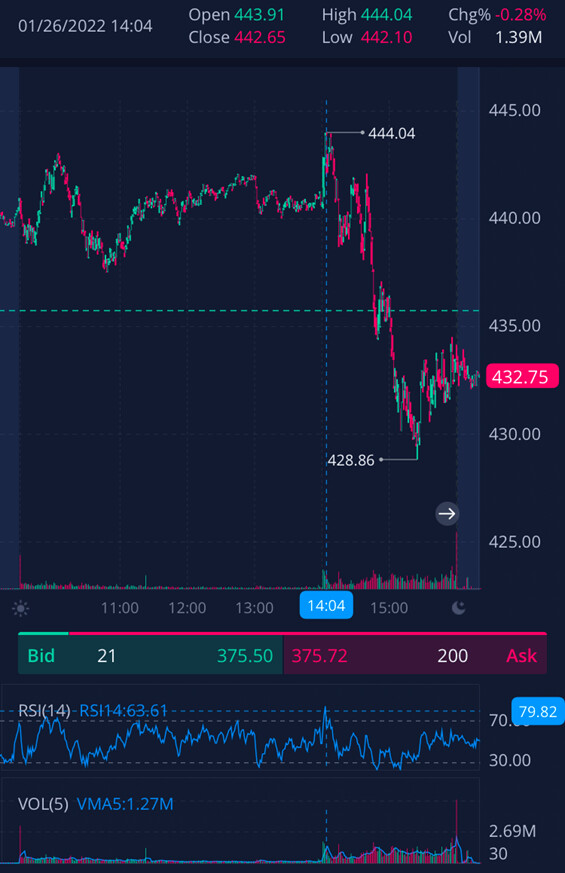
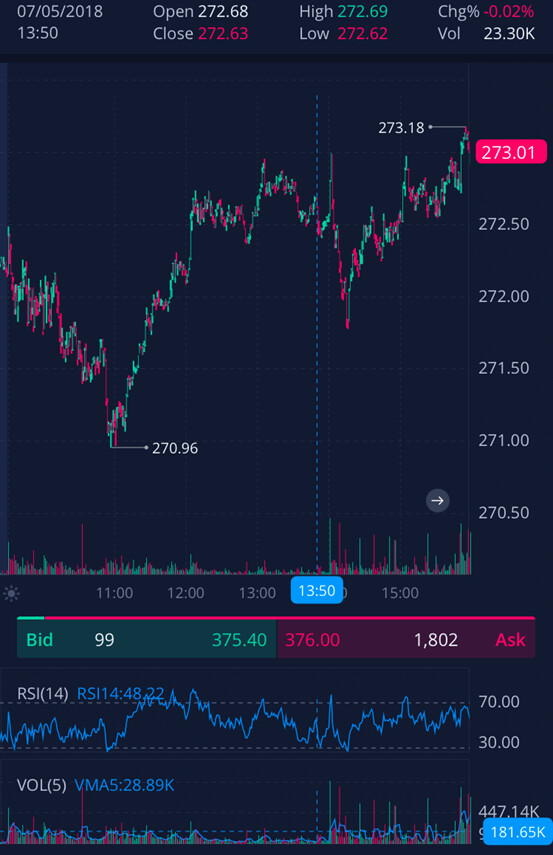
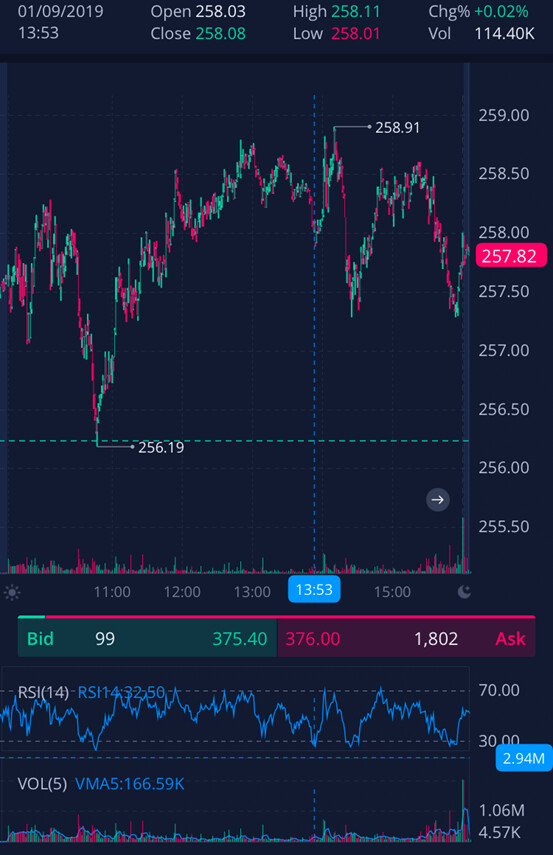
I defined the FOMC bump as from 2:00 - 2:03 but Ive also included columns for prices from 2:00 - 2:30 and for 2:00 - close.
Some things I have observed from putting this workbook together
The FOMC mins release historically speaking, has a less reliable “bump” than FOMC Rate decision day. This was surprising to me.
2022 has had a more dramatic “bump” than any other year I’ve looked at. The Bump starts to fade in aug 2021 and is fairly inconsistent and unreliable from jan 2018 till aug 2021. I feel like it is probably due to Rate hike expectations starting to build in mid 2021 and the Mins release has been given heavier weight in algorithms since then. This is something I plan on looking more into later so I can adjust my strategy when that time comes. I do think we will continue to see these big bumps until inflation is under control so I’m basing my strategy off of 2022 and late 2021 data.
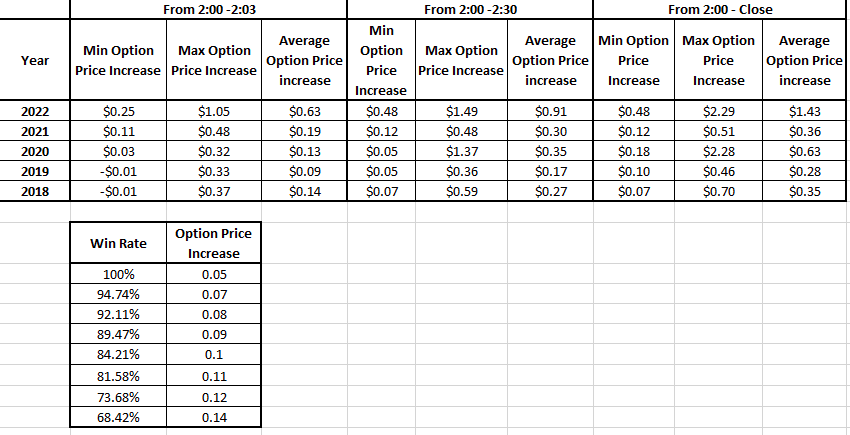
Calls worked better than puts and are more profitable than puts. I intend to only play calls this go around and based on the data will set my sell limit for anywhere from + .24c -.48c depending on my actual delta and my testicular fortitude.
Unlike the FOMC Rate day, I could not find a set time to buy that worked better for all dates so Im sticking with buying calls at 1:59.
I will post the actual excel file if anyone wants it but I will have to remove some of the charts because the file is too large. Just let me know. If you decide to play around with the data and find something interesting or have any insight to the days where virtually no bump happens, please let me know. Also let me know if you have any questions. Ill screw around with this more next weekend and post anything I come up with.
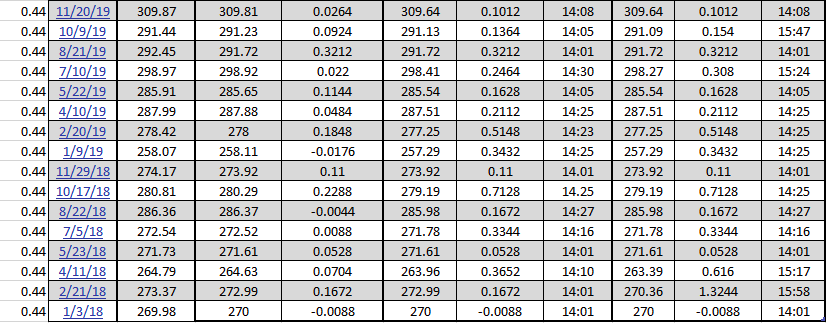
DATA FOR CALLS
YEARLY SUMMARY AND WIN RATES FOR CALLS
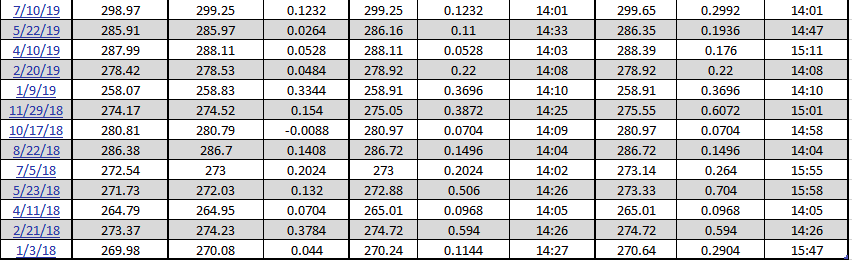
DATA FOR PUTS
YEARLY SUMMARY AND WIN RATES FOR PUTS