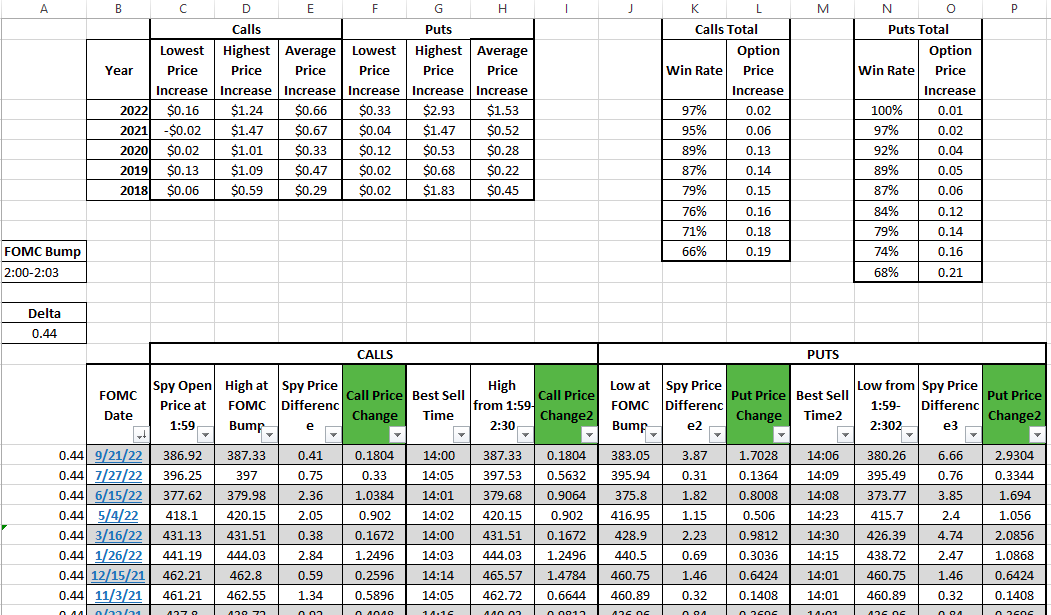
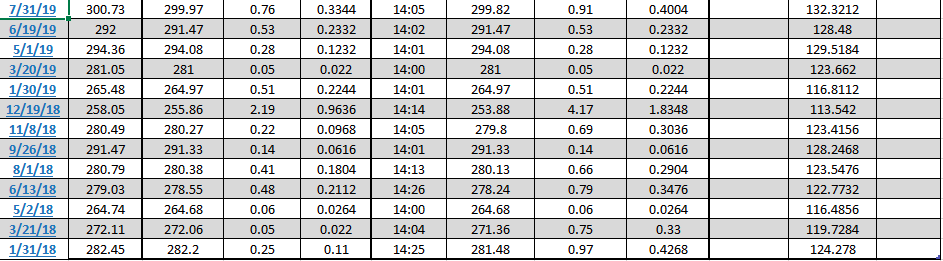
With FOMC Rate decision being released soon (nov. 2) I decided to go back through all the past rate decision release dates since jan. 2018 to see what happens on those days. I’m hoping this will give more insight into the most profitable way to play those days. I decided to focus on spy price at 1:59 pm and then what happens between 2:00pm and 2:30 pm. I didn’t look past 2:30 because I really start to sweat holding 0DTE options past then and know my psychology probable wouldn’t let me hold longer than that no matter what the data said. Using those numbers I tried to get a rough estimate of how options prices would move with spy. To calculate the options price I just took the difference in spy prices and multiplied it by .44 which was about the delta of the ATM 0dte calls I bought the last mins release day. I’m sure there is more accurate ways to do this but I don’t know how. If anyone does know a better way, please let me know. I put all this in an excel workbook along with charts for those days that I’ll post here but the full file with all the charts is to large for Discord so the charts only go back to may of 2021. The charts show full day and zoom in at the around 1:30-2:30. The dates on the data page have hyperlinks to take to the charts of that day. I haven’t played around with this much yet since it took a good bit of time to construct but I thought I would post it now anyway just in case other data nerds wanted to play around with it. Some things I have noticed during my brief look over are…
Puts have been most profitable so far in 2022 as well as more reliable for the total data set. There actually was not 1 day that I found were a put wouldn’t have been at least a tiny bit profitable.
Both puts and calls have been very profitable since 7/28/21 with the min increase in put prices being .13 c and min increase in call prices being .18 c since that day.
I will post more as I play around with the data and try to find the most reliable and profitable way to play this day. I also am making one for FOMC mins release day but it’s still under construction. Here are screen shots of what I have so far. Not gonna post all the charts cause that would take too long so download the excel file if you want those or look them up yourself. Let me know if you have any suggestions or questions.
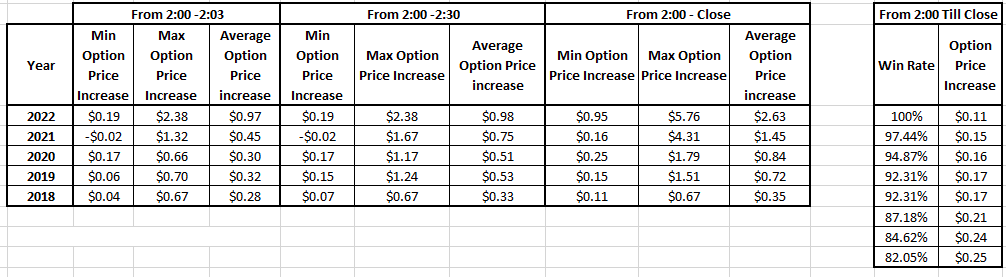
After playing around with it for the past hour, I couldn’t help but look at what happens after 2:30. Turns out that since 7/28/21, If you bought an ATM call at 1:59 and then set an .84 c above sell limit and walked away, it would have hit each time. Remember my option prices are estimates so I’m probably not correct. Data under the green highlighted columns.
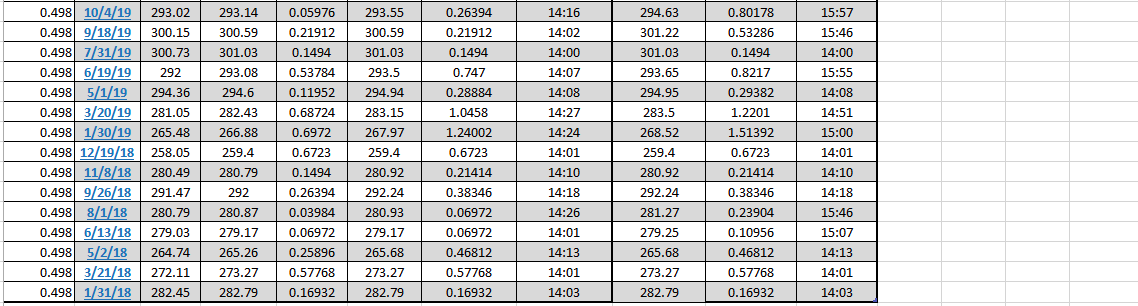
After getting to play around with it more this weekend, the best play I could come up with based on the every FOMC rate day since jan 2018 is to buy at 1:55 pm and set a sell limit anywhere from .06 to .39 c. The .06 limit sell had a 100% win rate if bought at 1:55 pm and held until it hit, which happened within in mins 97% of the time. On 6/13/18 you would have to wait it out till 3:07 pm. I tried a few different buy times based on eyeballing the charts and this time had the highest success rate by far. I’ve listed win percentages of other sell limits in the pics below along with the data. If you want the excel sheet let me know. Personally Im going with the 16c sell limit with the 97% win rate which only missed once which was again 6/13/18. Maybe the .20 c sell limit with 92% win rate if I feel like gambling.
Might be a stupid question but i’m a tad confused on your numbers for the options when you say 16c sell limit and .20c sell limit. .06 to .39c etc. Are these just whatever is ATM at 1:55? So basically the value increasing how much from what original price? This was still a nice write up though. Probably not enough time now but might be interesting in the future to analyze after 2:30 for each since that is jpows speech. I know it can go either way based on what he says but if i’m not mistaken thats when it starts to really move (would make sense to get friday expiry to your point of not wanting fd’s past 2:30)
You are right sir! My second spreadsheet has the the spy price high after fomc till close, far right columns. Still working on the low spy price. What I meant by the .16 c sell limit is that whatever price I get my calls at around 1:55, I’m going to set a sell limit for .16 cents higher than that. I know it’s a confusing spread shit and worded poorly. Hope that clears it up. I’m actually planning on going a little heavier into puts based on jobs and pmi data released but still getting calls also. Gonna try get the puts data posted tonight or early tomorrow.
That’s how the data looks, but please remember, I’m only using delta to calculate the options price so theta could really skew this the longer you hold especially for the atm fds I’m buying. Also I’m assuming .44 delta for all calculations. I plan on recording actual high and low option prices tomorrow and adding into this from now on.
Here is the puts data. I’ve only made it back to jan 2020 so far. Ill try to finish it up by open tomorrow. Just gonna throw it up now for other folks to think on. Also I think the 2021-2022 data is most relevant to todays market anyway. Good luck tomorrow.
While I took an L in hindsight following all this to the end still would have worked out. Good data at least for today. Now i’m curious about if you buy either calls or puts before would either be profitable up to a certain point in the day. Obviously today went down during and after the speech but was pretty damn high for his beginning statement.
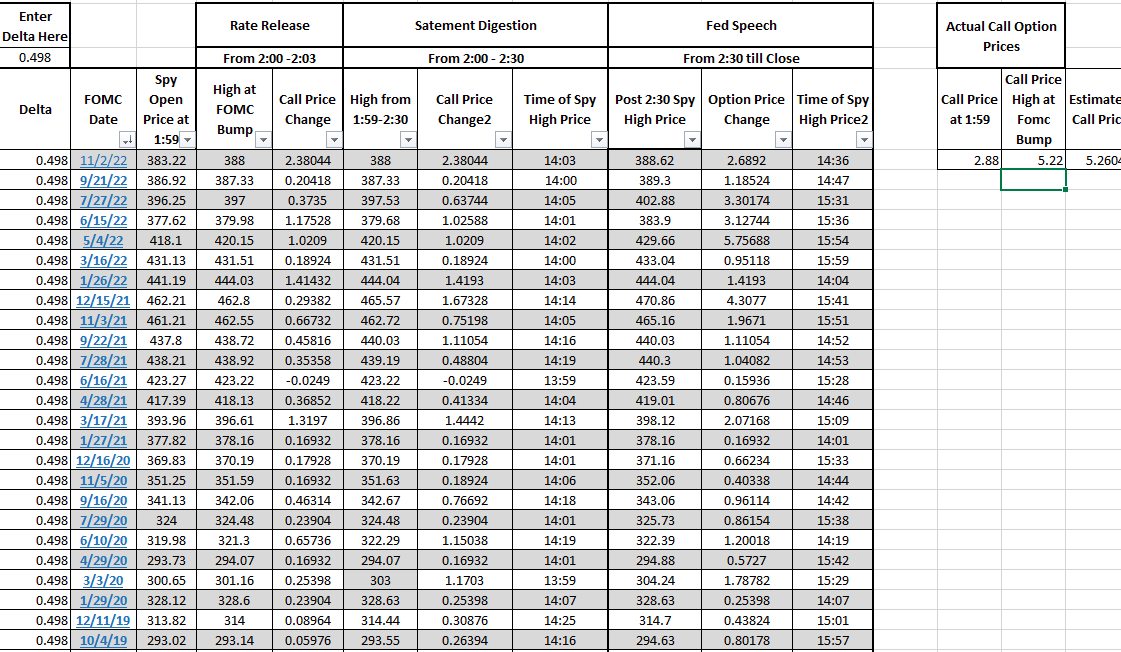
So today went really well and the spreed sheet turns out to pretty damn accurate at estimating option prices. Delta was higher today for atm options than at min release last time so I changed .44 to .49 at around 1:50 today which helped me raise my sell limit slightly. Both my puts and calls hit by 2:01 with solid profit. When I got home I entered in the actual option prices from 1:59 and the high/low from the bump today just to see how accurate it was estimating option prices. The spreadsheet said my calls would be worth 5.22 at the high and puts would be worth 3.14 at the low. The actual prices I recorded today were calls at 5.18 at the high and puts at 3.14 at the low. Not to shabby. Now that I know it’s estimating option prices well, I’m going to clean it all up to make it more user friendly and post it here. First I have to finish the mins release day data and will post it separate from here to avoid confusion
Sorry to here the L. Psychology is a tough mf to account for. My gains were a modest 8%. The good news is we have the mins coming up in 3 weeks to get your money back
Actually yes, both puts and calls would have been profitable at 2:01-2:03. The low for spy was 382.09 which would be a .55 cent increase in put price at 1:59 and spy high price was 388 which would be a massive 2.88 increase in call price at 1:59
yeah what I didn’t mention was my UI didn’t update when I bought then froze up so I saw my account balance go up but couldn’t do anything, then deep red lol. Still I think my cut was appropriate cause no way of knowing what he would say. This was a great writeup on your end though so thanks for this. WIll definitely be referencing it next time.
Damn, That is one of my biggest fears since Im usually trading on my phone with no back up If my phone acts up or looses signal. Im gonna make sure to have a back up from now on. Here is the updated sheet for Calls and I tried to clean it up a little. Let me know if you have any other suggestions.
Since I had a good bit of free time today, I decided to finish off the puts Data for the Rates day and clean it up to look more like the Mins spreadsheet because I found it more useful in that format. Here is the new and improved sheet with completed puts data. Im also putting up the data for buying calls at 1:55 since that was the most reliable and profitable time I could find to start buying calls.
After looking over all the economic data from @rollover thread (which is a great source) I feel like we may just get a 50 basis points but I also think we will get a hawkish tone from j p like Jackson hole style. My plan is be cautious and evenly split my calls and puts. I plan on setting my sell limits at .02 c lower than the yearly mins for 2022, whatever they may be with my updated delta at the time. Gl all and would love to hear others thoughts
Agreed, 50bp seems baked in at this point. This will also tell us more about which recession scenario is more likely to unfold. I am betting on a relative bull market for treasuries whilst the stock market turns broadly bearish after this counter-trend rally.
I personally expect a lot of green on the algo action when the rate drops confirming 50 bps. I expect JPows speech to be more dovish as well and hopefully we don’t dive $12 again like last time, but it’s important to be listening to his conference afterwards to hopefully clue in on the direction early.
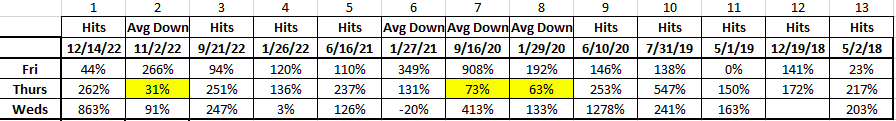
Ive been trying to get into the feds heads with what to expect on this upcoming rate day and how the market will react and honestly, I have no clue. It looks as if the rate hikes are acheiving their purpose but I doubt jp and crew are going to be popping champagne at the news conference. The tone from the current speeches and press releases has remained hawkish imo. Because I don’t know what to expect, I started looking into what happens in the week after rate day and how that day may start a short term trend. I looked at each rate day and classified it as bearish, neutral or bullish based on if that day ended up from open, down from open or just a little higher or lower. I defined bearish as a .54% drop or more from open, bullish as a .5% or more increase from open. Anything else is in-between up or down. Here is how that looked
Part of the green days have been cut off but they are not relevant to this post. What caught my eye is the Red days. Before I go further, please understand this is based off only 13 days going back to only jan 2018. That said, there may be a strong correlation to spy dropping .54% or more on those days and what happens the rest of the week. I mean really strong! I looked at what happens if you were to buy puts exp fri for a strike 2% less than what spys price at open was weds. I looked at buying them weds just before close, thurs at open and fri at open. Here is the returns if you let them run till the highest price.
Those are my type of big ass gains. I identified buying puts thurs morning as the safest most profitable way to play this if and/or when we get a .54% drop or more on rate day. And while getting at least 31% is nice and all, I wanted to find the most profitable way. The answer was to buy at open thurs morning, set sell limit to 130%. If the option price is lower than cost basis on fri, average down at open at 1-1 (buy 1 put put for each contract you have). If you have to average down, change your sell limit to 60% above cost basis and walk away. That would give you 130% gains 9 out of 13 times and 60% gains the other 4 out 13 times. Again just something interesting that immediately jumped out at me. Unfortunately I did not see as strong of a correlation with green days and the in-between days are a crap shoot. Ill post the data if anyone wants it and not suggesting this rock solid. Just was blown away at the potential and thought Id post. Ill update as I cont to play around with it and am going to look through 2017 also but that’s as far back as my access to historical option prices goes.
After the employment cost numbers came out I started to lean towards more calls than puts tomorrow. Then the consumer confidence numbers signal possible recession in the next year which also make me lean towards more calls because I think the fed will be glad to see inflation data moving in the right direction but be concerned with a much harder landing or recession if they don’t ease up. .25 bp surely and is already priced in. The press conference is the question. Will they be hawkish or hint at a time frame for pausing? Even the slightest hint at pausing at next fed meeting will have a bullish reaction I think. Any other thoughts are welcome but I may be doing more calls than puts tomorrow but I’m not sure just yet