Not sure if we should be playing some of the REITS…. This Company Now Owns Enough Single-Family Homes To House The Entire Country Of Iceland
Will look more tomorrow
2 Likes
That is a good perspective too. If reits start dumping and more people are buying shit online, HD properties leased by reits could see store closures if it comes to that. Not likely in near future but a thought
1 Like
Adding a couple points fwiw:
- not just out of necessity but there are still tons of middle class families working more remotely now. The more you stare at that “old bathroom” each day coupled with material prices going down again, you have a lot of families still parsing out their next home improvement project
- don’t forget about equipment sales like tractors, bbqs, drills, saws. A lot of companies need to keep inventory moving so they will do whatever they need to keep this “moving”. Not that this would move the needle on its own but for instance generator sales and other seasonal “needs” help keep revenue less reliant on overall market. Have you seen any blowout sales or markdowns to move this stuff? I have not yet by me.
- every time I go to a HD in Ny or Ct they are always packed (not costco packed but very busy)
I guess I’m a perma bull on HD but there can definitely be a short term bearish play here. I just don’t believe it would last long before getting bought up again as this is a desirable long term hold for many folks.
2 Likes
Well after a lot of back and forth with @Machetephil , @Iloveyou and @SuckyMayor . I’m a less positive on HD being the correct target for the housing data drop next week.
Just wanted to bring a few things up to hopefully help navigate the conversation:
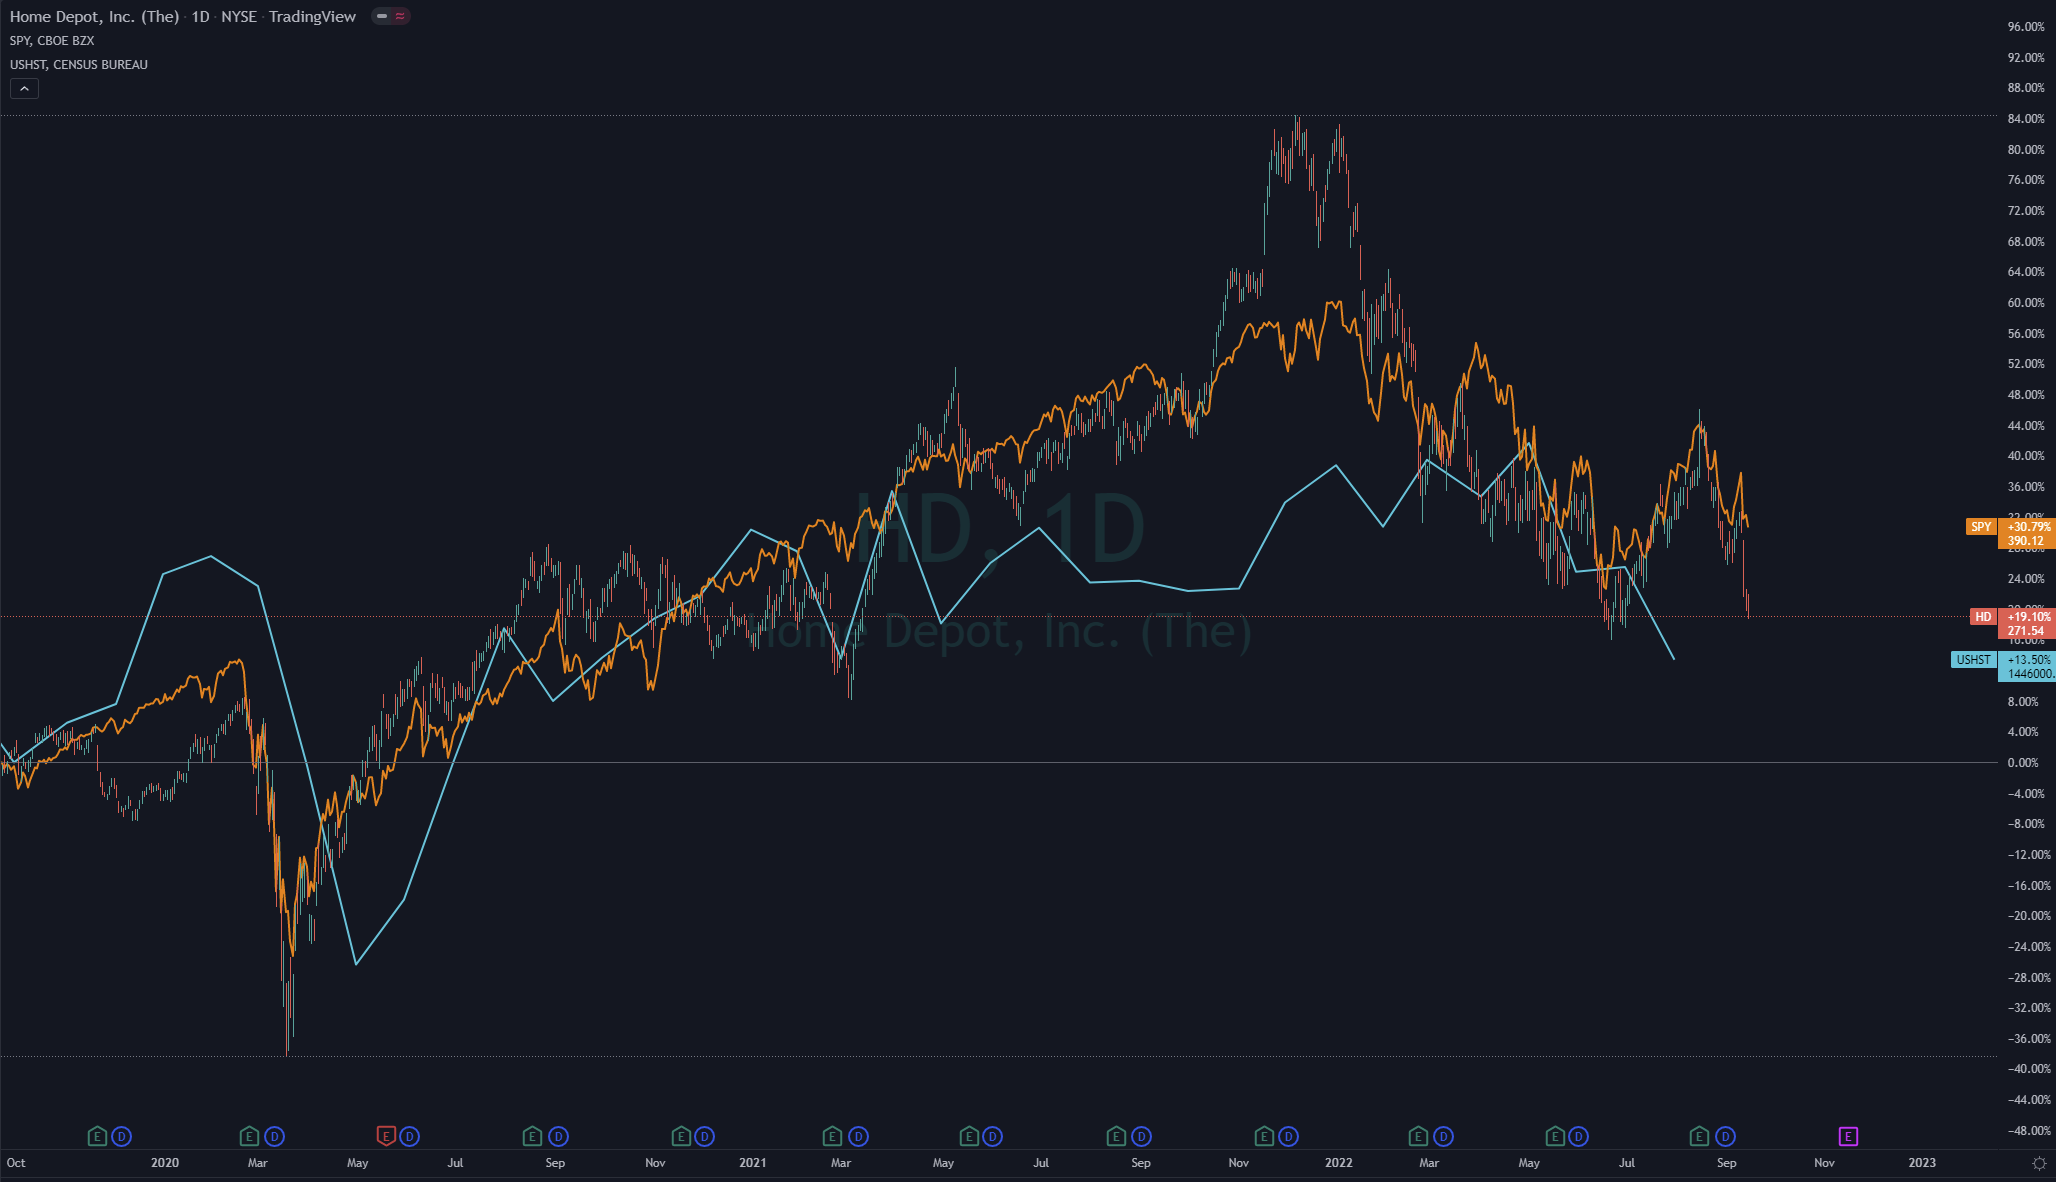
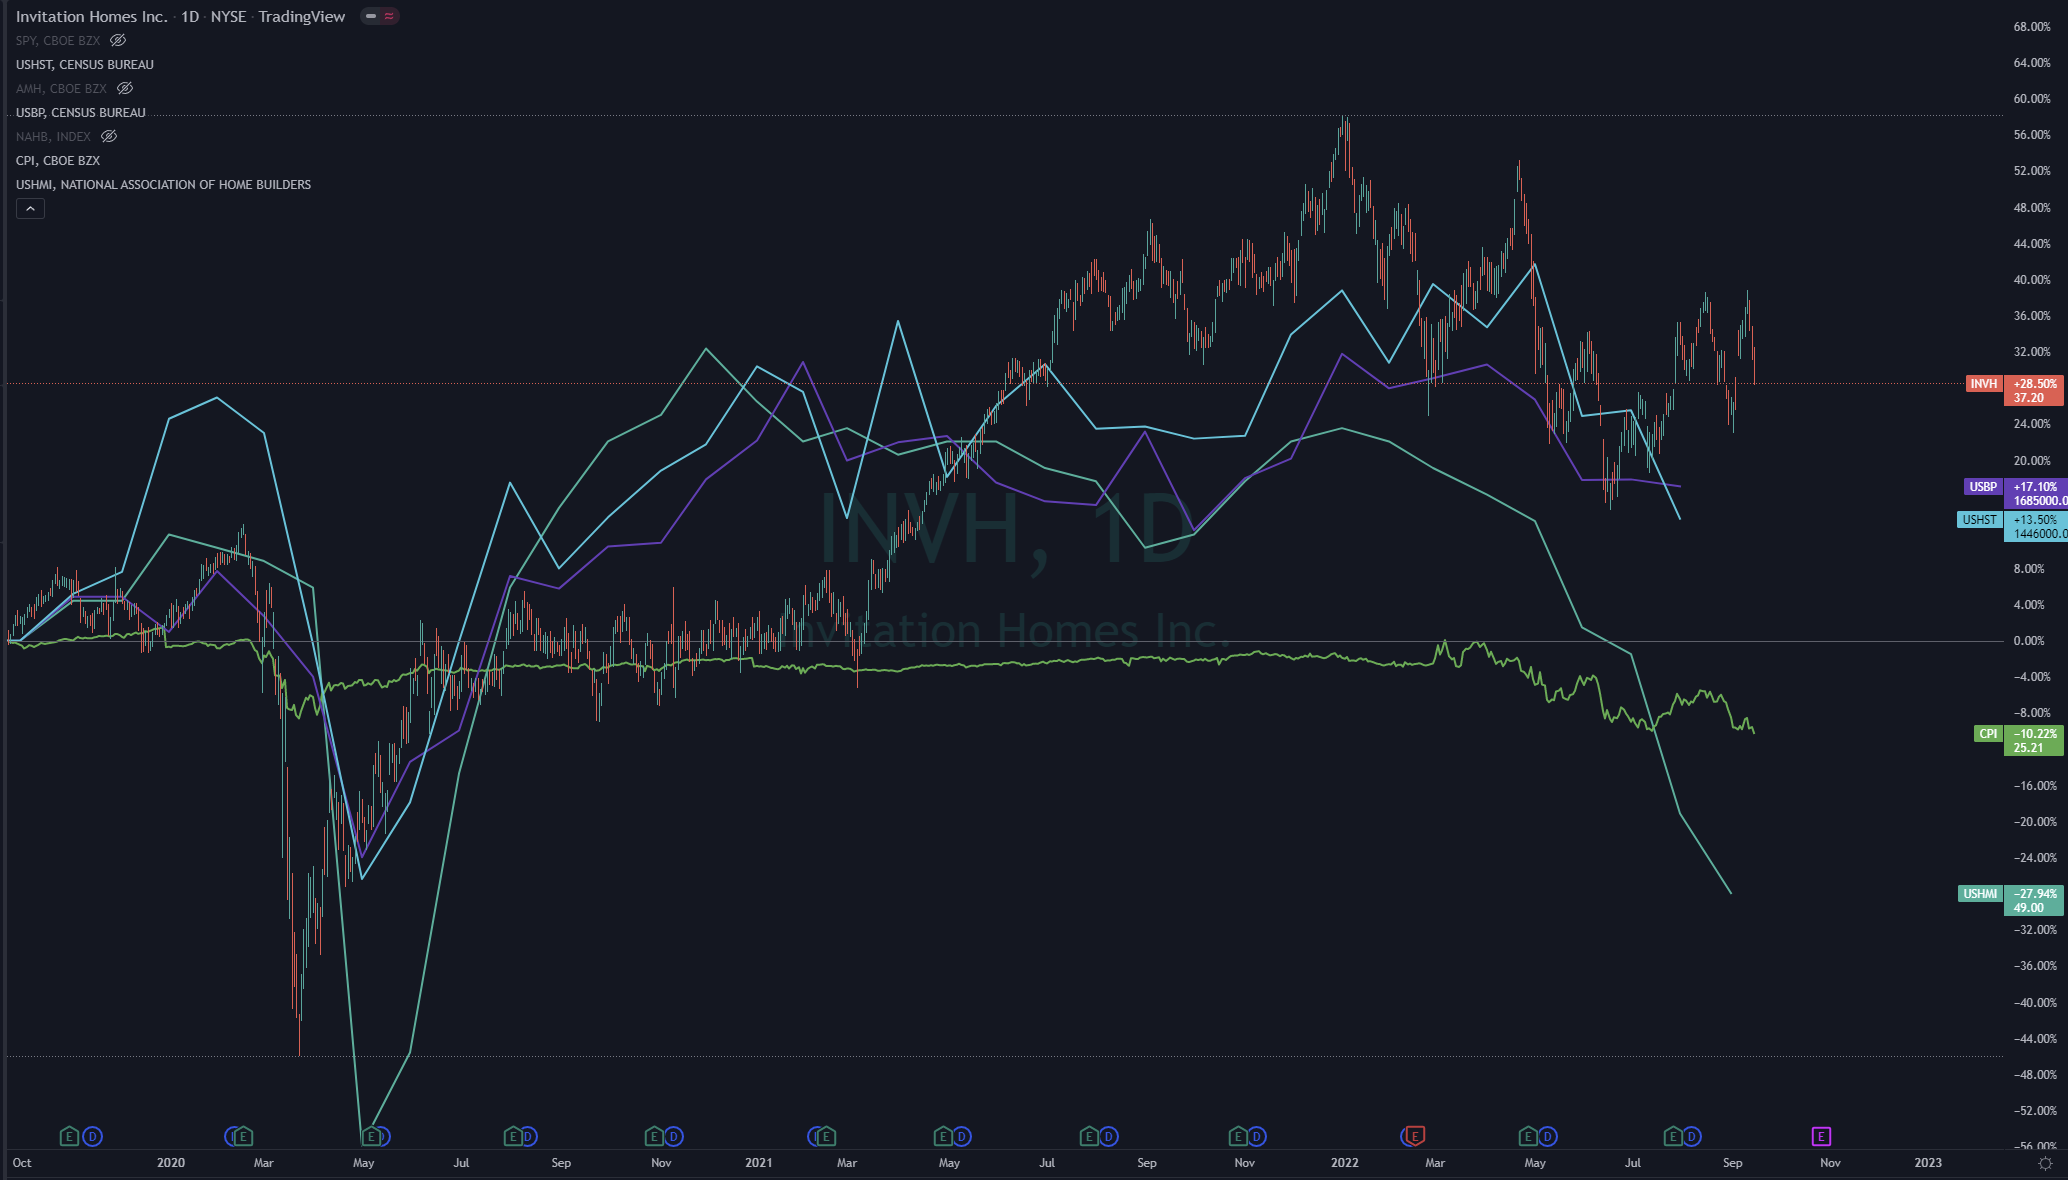
This funky little chart shows the correlation between US Housing Start data overlapped with SPY and HD. There is definitely some correlation here as housing is 15-18% of the US’s GDP (Gross Domestic Product, or how much money we as a country make internally focused. GNP is looking at the value of all finished products whether they were built here or not.).
So the overall stock market (including Home Depot) would likely see some ties to the housing market at large. There is some interesting behaviors of how the Housing Starts has been impacted as rates have gone up as well:
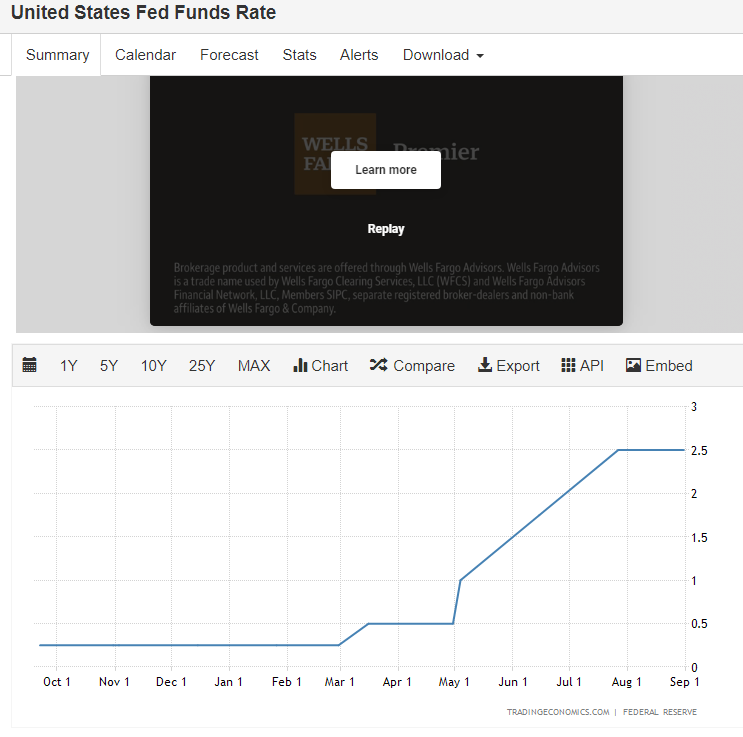
We can see the March 2022 data point coming in for Housing Starts likely after the first rate hike so there wouldn’t have been much of any impact for housing starts but we see that housing starts had already began to sort of level out after Spy capitulated in January. But they were leveling off for a variety of reason namely supply chain issues being the first and foremost as the housing market was red hot and with the Dodd Frank Act repealed it allowed a whole other type of buyer to enter the real estate market on the same level as everyday people.
But This chart does do a good job of showing how the housing starts have lessened since the rate hikes began (and in pretty quick fashion as well).
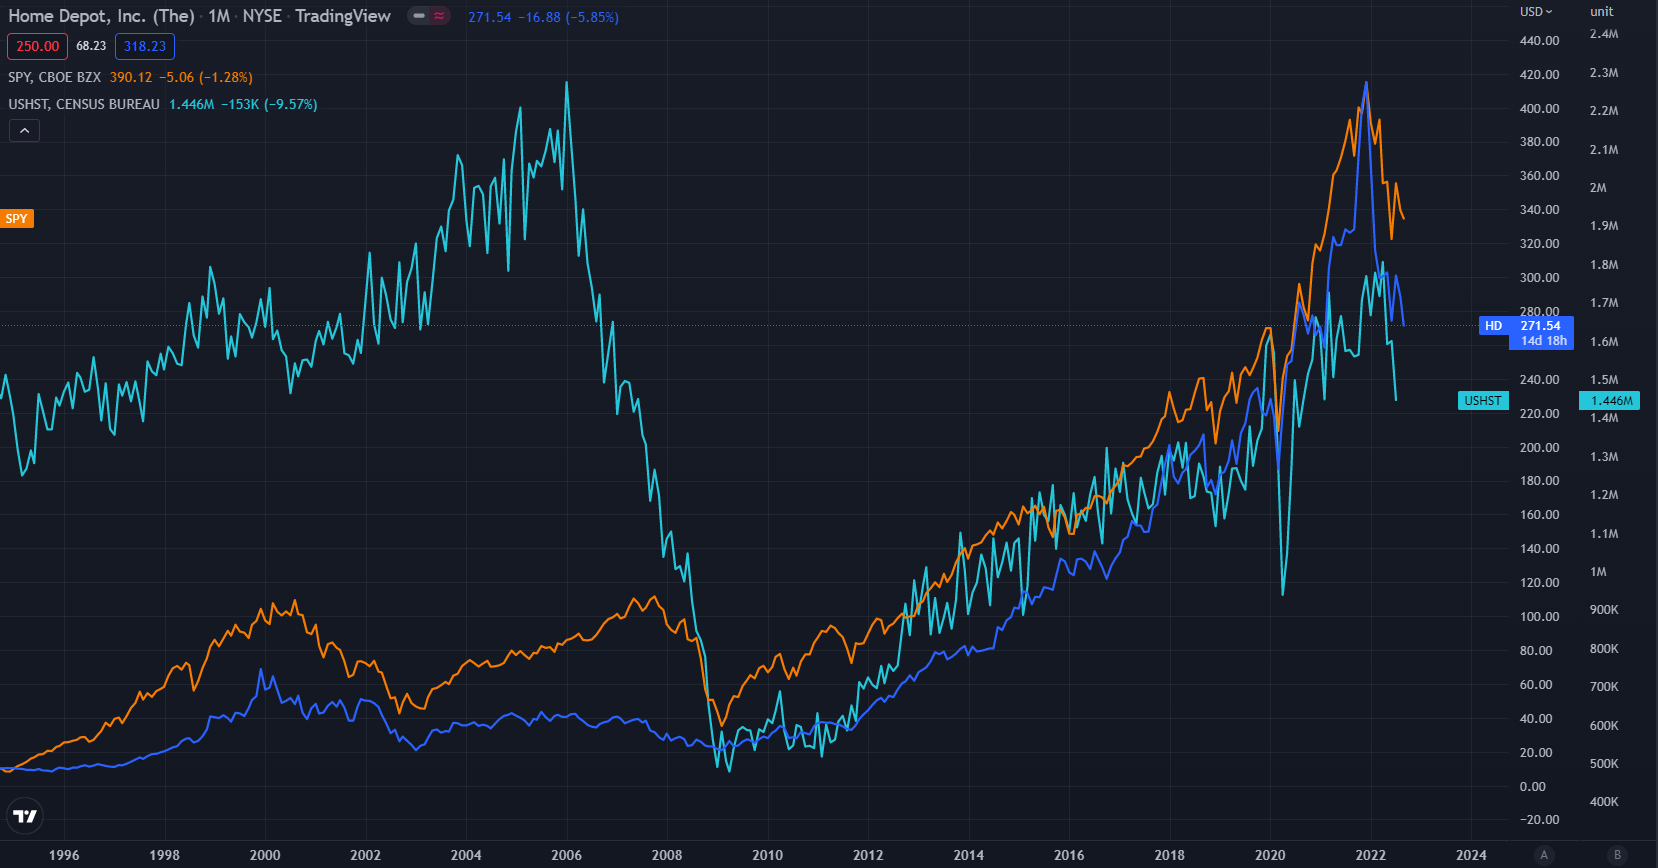
Here’s a longer timeframe to bring what happened in 2008 into perspective as well:
So here is a fun chart I found after wondering if I had proposed the right target.
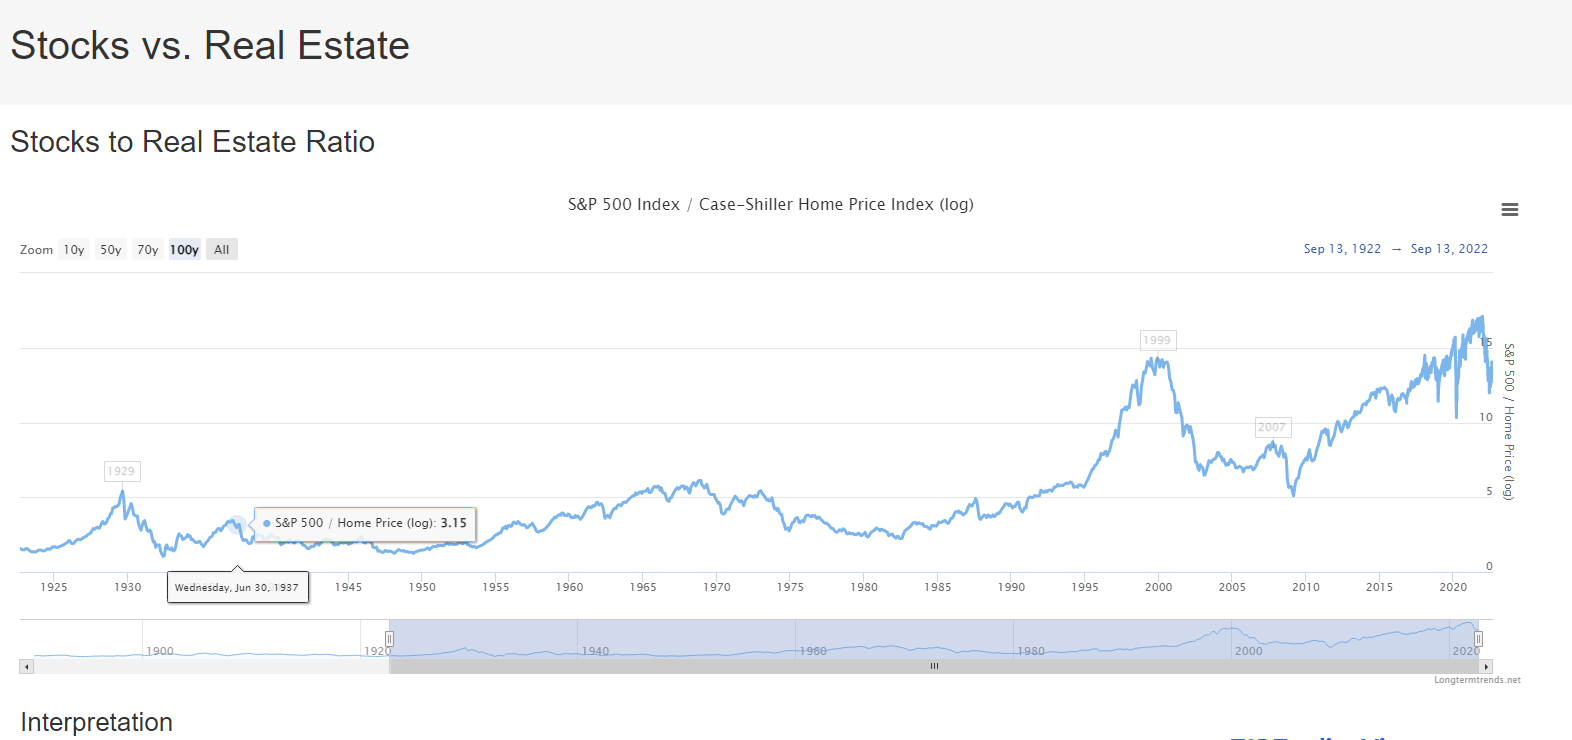
Fairly decent little chart showing the ratio of the Case-Shiller Price Index being used as the divisor and the S&P 500 used as the dividend in the ratio.
For you Buffet Fans I would feel I did you a disservice if I didn’t also drop the “The Buffet Indicator”
Nonetheless, it is fairly plain to see that the stock market is well above the dotcom bubble and the 2008 bubble. Was most of the growth literal and can be accounted for in the economy growing? Absolutely, but we’re also all (as in all the countries) sudo-propped up from how we all had to handle Covid to ensure people like Navi didn’t decide it was finally time to eat the rich and politicians. I mean I was cooped up in a room for god knows how long and didn’t have alcohol anymore. Human flesh sounded alright some days not gonna lie.
So unless Home Depot magically started acquiring single family homes I think we’re kinda SOL friends. Is there some correlation between the housing market and HD? Absolutely. But theres correlation between the housing market and the entire stock market as well (Money is money doesn’t matter how you bend it, what you trade it for, or burn in your pile of faggy degenism rituals known as OPEX).
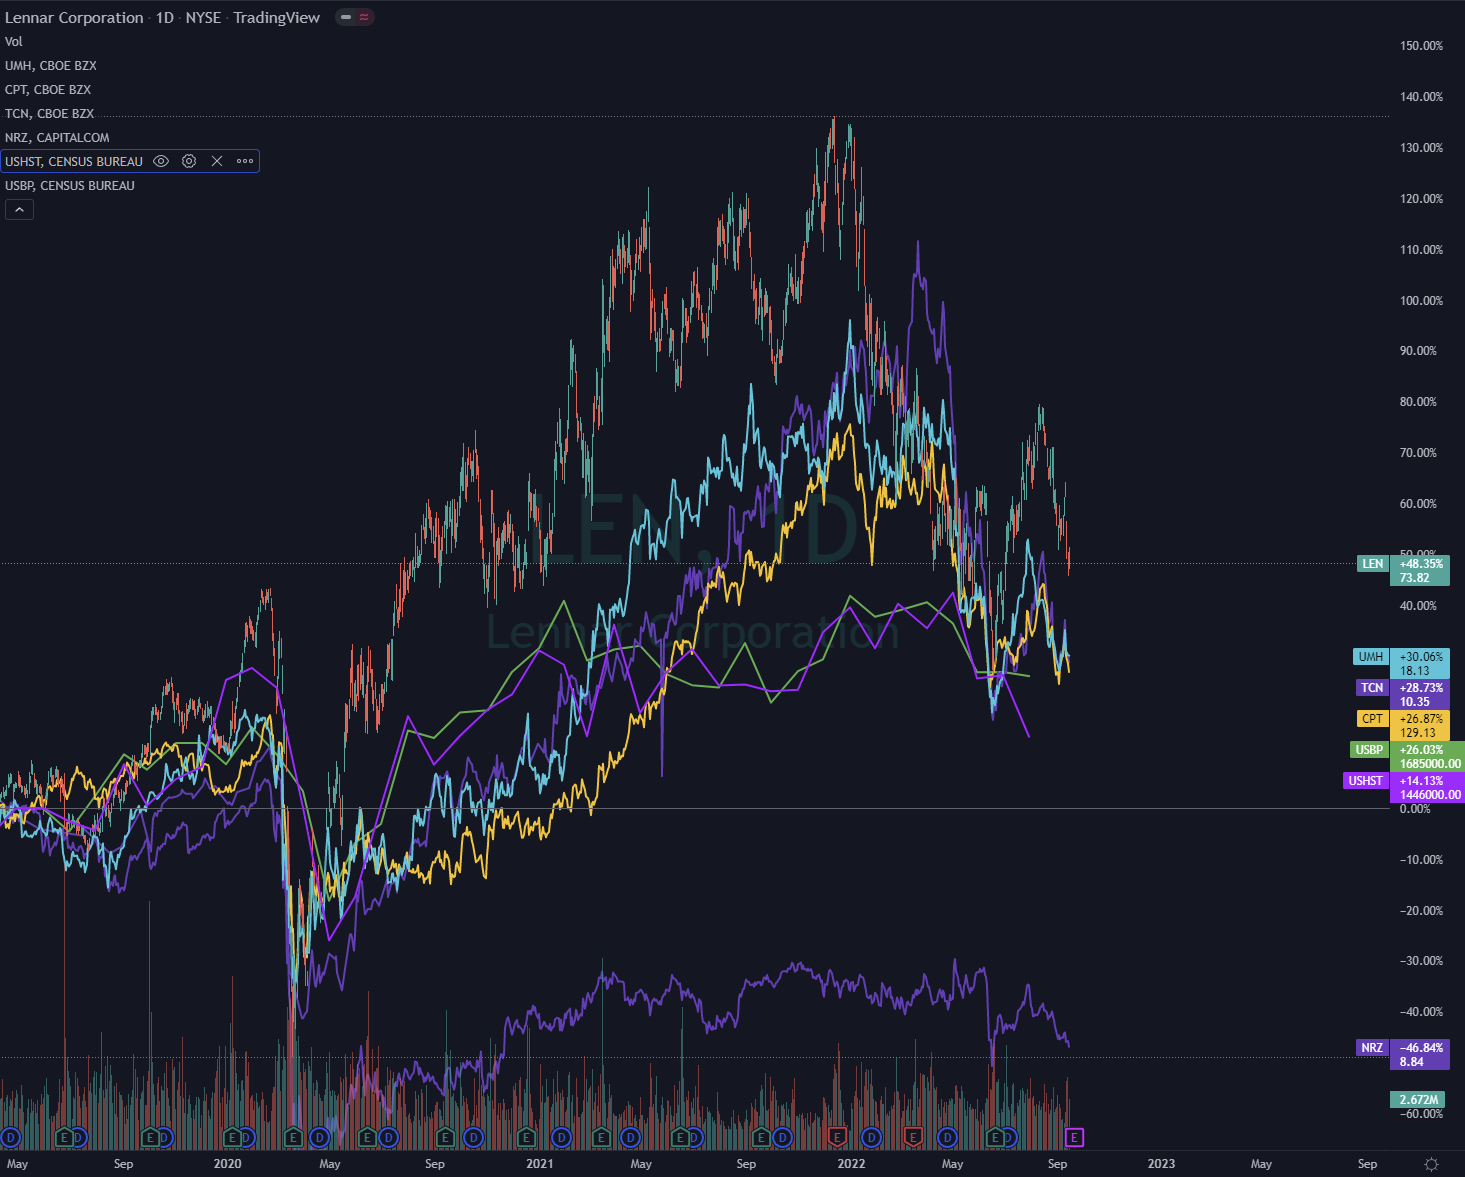
But, I decided to look at some other charts to see if some other tickers may better coincide with the upcoming data drops coming on housing next week.
Thank you @Iloveyou and @SuckyMayor for being my Trading View style parents by loaning me their Netflix password (when in reality I just kept yelling at tickers I’d like to see on a chart cause I’m a cheap fuck).
Here’s the list (and I’m not evens sure these are good ideas but I wanted to keep things flowing as we only have until Monday really to figure out possible targets):
INVH - Here’s a decent write up to brush up on them. Basically single family home focused REIT
AMH - They own an absolute fuck ton of rental properties

And this one was a hodgepodge:
I’m definitely not extremely certain on any of these as being “the play” here as its very hard to say how everything will play out next week with so many events on housing back to back to back to back. It will ultimately end up around how the data comes out. So before next week I welcome you to read this.
I may try some of these strategies but we’ll see. After some consideration I’m feeling a bit clueless as to direction of anything but felt it was important to share this nonetheless
*For the record this article is from the June Hikes so its still relatively applicable and can be used as a data point to see how some of these stocks (or other tickers if you feel so inclined) reacted to the housing numbers in June
https://seekingalpha.com/article/4518340-housing-data-overlooked-as-fed-takes-center-stage
2 Likes
Did you happen to see that there was volume on the DRV options expiring today?
1 Like
I was definitely noting it moving up but didnt check the options actually
1 Like
Adjusted the forum title to hopefully allow more conversation about potential impact on other stocks. Please see update above. Have no open positions for anything cause data can come in good and bad and no reason having a position with a 50-50 chance when you can enter when you know 100% of the data. Good luck on OPEX stepping away for the rest of day.
Just saw this article on CNBC for @Navi :
Yeah I listened to actual call. They also didn’t report the actual numbers on their ER call for the pro segment. The sales they reported would have been in line with their average customers (non-pro) but nonetheless I changed the name of the DD and the most recent post to reflect this should be a broader discussion and we should examine different tickers.
Interesting ideas here. Will look more into these tomorrow.
$TOL Ishares etf and a couple others.
1 Like
More good ideas and HD was directly called out lmao. Seems builders are the main ones coming up from the Housing Start data (makes sense, less starts mean less money for the builders.) I’m also interested to see if I can find some Brokers as well (less home starts, higher interest rates, already limited inventory all points to less sales for them as well)
Watched this and they talked about which housing stocks could be a play actually for the feds interest rates raise:
DRV, SRS, XHB, REC, lmao and Lowes and HD. also said a lot of these are already priced in to the single digit P/E’s.
1 Like
DRV…. Mad sus. Read the prospectus. All of their stuff is unaudited and I really don’t like that at all
1 Like
Waking up. Two of the bigger names on my housing watchlist got PT downgrades from Evercore ISI this morning. Seems somewhat telling
1 Like
NAHB Numbers:
Total 46
Ninth straight loss
Current sales conditions dropped 3 points to 54, sales expectations in the next 6 months decline one point to 46, and traffic of prospective buyers fell on point to 31.
1 Like
Pre Post to Existing House Sales data drop:
I’m just gonna be watching TOL for this one. But the data is when homes are CLOSED which occurs 30-60 days after the sales contract. So the data coming in likely won’t have all the 6.2% interest rates we’ve been seeing in the headlines. Consensus is lower than last report so doubt their will be a big surprise here.
Existing House sales came in at 4.8m over the 4.7m consensus. So not a massive surprise but these numbers are for closed homes only again which means a inherent 30-60 day lag on when the home went into contract. More nothing burgers
Haven’t read it all yet but here an article I was just sent by Redfin. Seems to have a lot of good information in it about the current state of the housing market. Seemed relevant to share considering recent posts showing rates could go as high as 5% now.
1 Like
This is beginning to catch my attention as well, I have friends and family who are realtors so I’ll see if there’s any data they may have access to earlier than regular news. If anyone has any ideas/requests on what to ask about, let me know. Probably won’t amount to too much, but worth a try…reading through that article led me to two places so far that I think could maybe help us in choosing where, when, and how to play all of this-
First thing I saw was this list (that I think could amount to a nice source on brokerages to look further into) on Real Estate Almanac; it seems to bring together and rank the Top 100-1000 Brokerages by different metrics. For example, Top 100 Brokerages by Transaction Sides:
https://www.realestatealmanac.com/brokerage/top-100-brokerages-by-transaction-sides/
Now this is all mostly out of date and going off EoY 2021 numbers, but I figured seeing data on individual brokerages couldn’t hurt. Question here is, ‘How do we trade this?’ Are any of these brokerages actually listed, or are they all bundled up in various funds? If so, where? Do the various brokerages even matter very much as far as the end question of ‘Should we buy contracts on _______’ goes, or is this just chaff?
Second place I found myself clicking through source links, and probably more useful, is this site that was directly linked/sourced in that article.
This one updates data on Fixed Rate Mortgages (FRMs) weekly, they call it the ‘Primary Mortgage Market Survey’ and it seems to track the 30yr FRM, 15yr FRM, as well as the 5yr/1yr ARM (Adjustable Rate Mortgage). Nice fancy charting and everything lol, but hey, I thought it would be worth bookmarking/preserving here.
Now, where to begin with actually trading all of this? Could REITs be relevant at all here? Need to go back over everything, that’s an actual question coming from someone who’s just starting to look at the housing data and it’s implications for the next quarter or four.
I don’t know where to begin myself yet, but looking through all this there’s no denying that something is definitely brewing with housing and real estate, good thread right here…the previously mentioned lagging numbers on these data drops in particular are making me think, things like ‘Is this not actionable, prior knowledge?’, y’know?
2 Likes
It’s interesting because @Navi had really only considered this thread to carry through to last week, but I’ve been living in some of our other threads today and yesterday and I think it’s important we carry this on. Specifically I’ve been reading through our collaborations on the Stagflation and Think Tank threads and I keep coming back to a graphic posted by @The_Ni in the Stagflation thread about the HOPE aggregate:
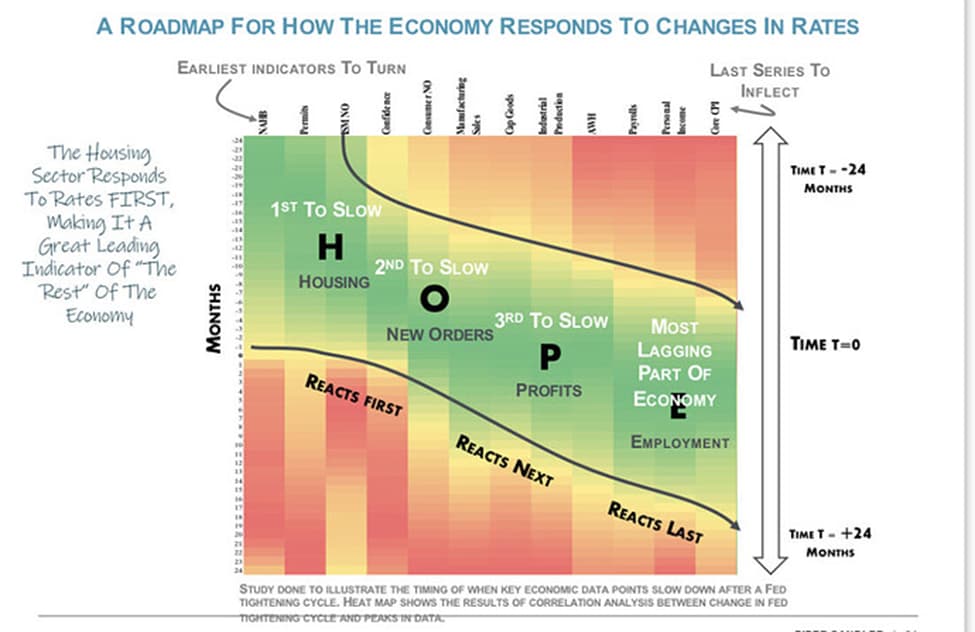
We have not seen the level of housing slowdown to confirm that the recessionary fears have manifested into something material. As the weeks and months progress I believe it is of utmost importance from a macroeconomic perspective that we pay close attention to all of the housing numbers that come out starting with our NAHB numbers:
First and foremost it’s important to note that what we’re heading into is not the same as 2008, but as our most recent major recession it’s easy to look back there to look for similarities because its what we have the most numbers around. While this is more likely related to inflation in the 70s, access to data in that range is very limited.
One thing that we can note of interest is that the NAHB housing index was WELL in decline before any of our 2008 downtrends. However we’re starting to see similar shapes in the trends here that could give us an idea of what to look for heading into in the coming months. Note that what we saw then was a steep drop, a small recovery, and then a plunge that took the market with it. In this situation, however, NAHB was, in fact, a leading indicator of the recessionary impacts of the 2008 crisis. It plunged well before the market did.
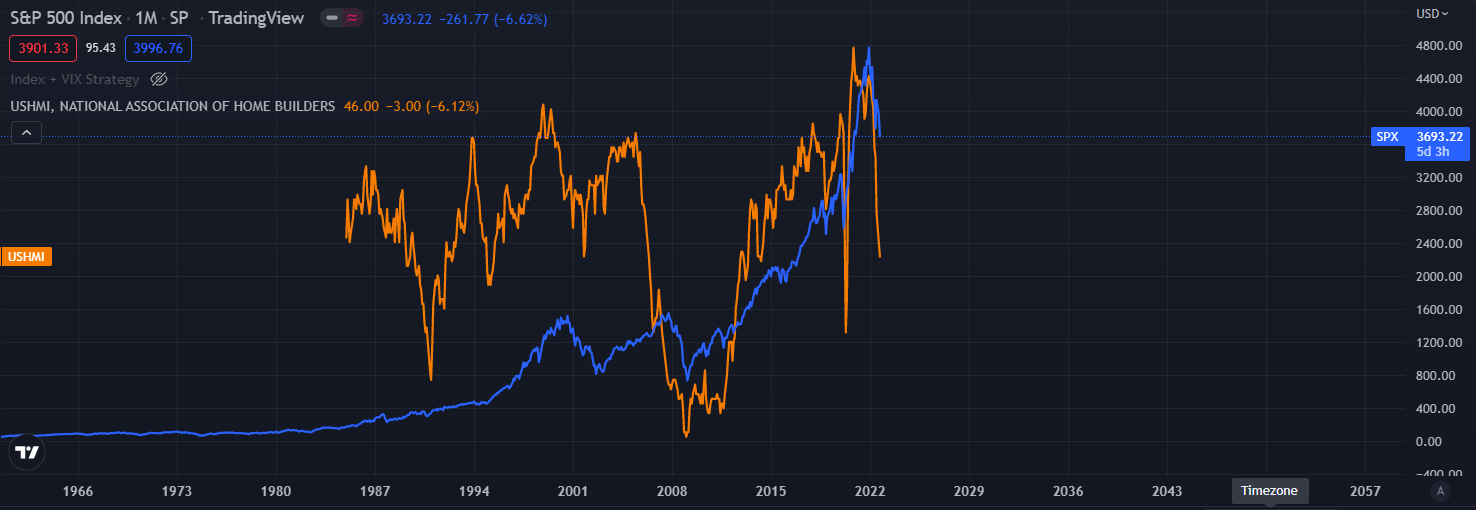
This is not an immediate call to action as this chart is a Monthly interval. But it does show that we should be paying much closer attention to these home numbers in service of staying ahead of a potential crash in the markets as more earnings come out and guidance is revised.
Hoping to use this as a launch point for conversation so please feel free to contribute!
3 Likes