REITs responded heavily last week. XLRE (real estate sector of SPY) and DRV also were great tickers to watch over last week!
2 Likes
This thread was definitely designed to be longer than a week hence the threads name change. Just kept the HD part to make it easy to reference in its transition.
So there’s a really interesting point I’d like to raise and I’ve been try to find some data on it and haven’t come up well on it. But with the Dodd-Frank act now repealed. I would love to see how the concentration of real estate has transitioned from small investors and “retail” into the publicly traded investment firms etc. I think with that transition and the overly inflated prices of a lot of real estate where those firms bought a large amount of property in coupled with factors that a lot of those areas are places that I believe have higher outflows of populations than inflows (Seattle being a great example and also California if I’m not mistaken). But with those above points more real estate value is now actually going to be tied to actual publicly traded companies and could cause this upcoming recession for especially the stock market to be more violent than 2008. Granted we don’t have a system of worthless junk securities… instead we have a global economy of bonds quickly looking to lose a ton of value long term, that seem to be losing value due to the effects of stimulus practices and also the inability for a lot of countries to match the ability to fight inflation like the US is capable of.
2 Likes
Interesting WSJ article that just came out going over the correlation of rising home prices and the land they sit upon.
https://www.wsj.com/articles/the-u-s-is-running-short-of-land-for-housing-11664125841
1 Like
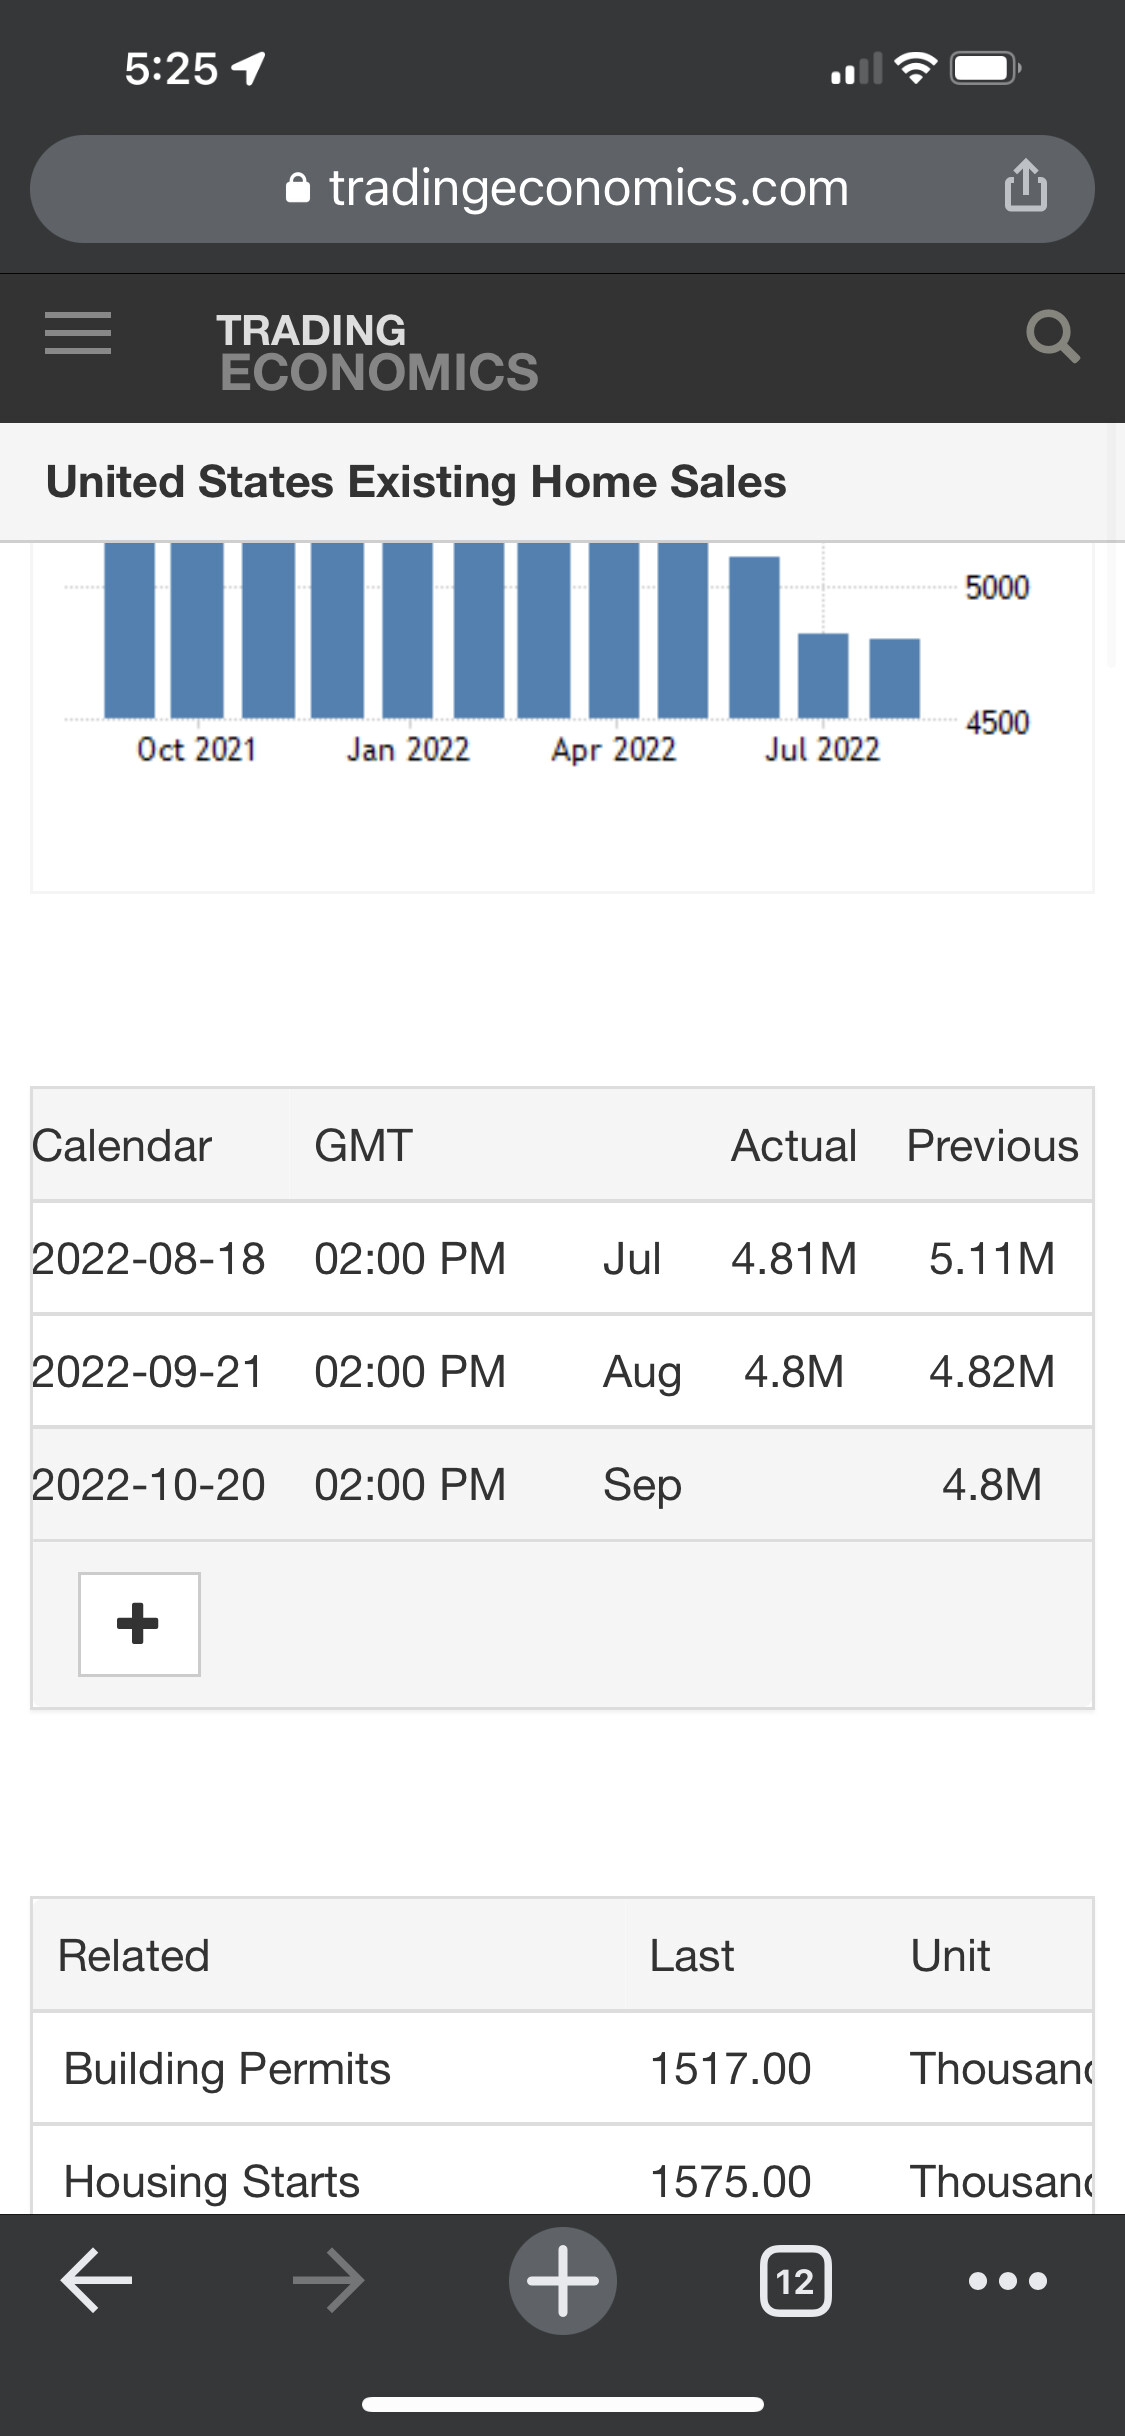
Looking to the week ahead, we have New Home Sales numbers being released on Tuesday at 10AM. The forecast is expecting this to come in lower than last month, and it has certainly been cooling off over the past couple of months.
Last month’s numbers for July came in at just over a half a million sales recorded, and this month we’re expecting to see just under a half a million. Based on the information shared here related to land shortages, diminishing demand, I don’t think that’s it’s unrealistic to think that this will come in near forecast. This presents an interesting opportunity to further explore DRV as posted by @Navi above, which has been in an uptrend since some of the housing numbers were released last month.
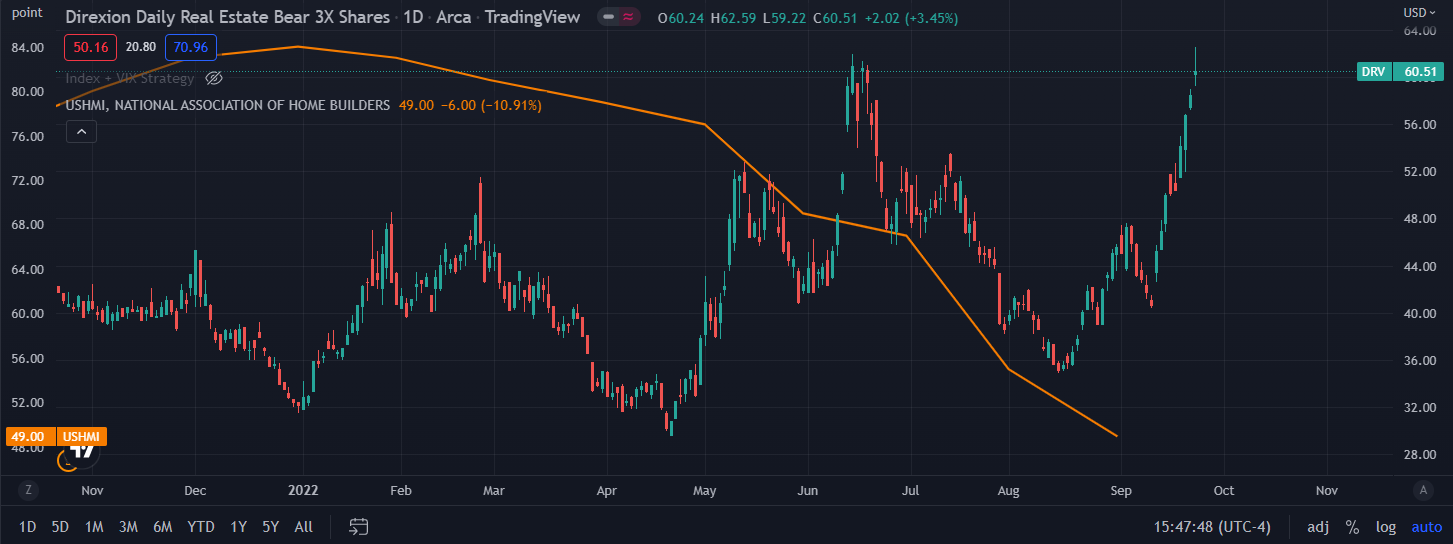
Looking at my chart above and the supplemental notes provided by Navi about how this could have more in common with 2008 than we realize, I wouldn’t be surprised if we start seeing this false rebound that preceded market turmoil during that timeframe. The NAHB index has been plummeting for the past few months and one must ask if that’s sustainable/justified in our current environment (current being the key word, not the foreboding sense of doom that we all have).
A tinfoil hat theory could be that the Fed is privy to preliminary numbers (which I sure as hell hope they are), and we could be looking at a reversal in the immediate. This would put us in Puts territory on DRV in anticipation of a small reversal. You can’t really take this at face value with broad market tickers like the above, but we would be near some level of a “double top” that we can monitor heading into Tuesday morning trading.
However now is not the time for tinfoil hat theories - with the information we have we shouldn’t expect a big time beat. There’s a strategy opportunity for us here with DRV and broad market catalysts. Referencing The Ni’s HOPE aggregate, if Orders show signs of slowing at the 8:30AM Print on Tuesday we can use that as an early indicator of the Housing numbers released on Tuesday morning and position in something like DRV accordingly. My perspective right now is:
- If orders show signs of slowing, we may have moved passed the H and onto the O. If so, we can expect more downward pressure on housing numbers and we can take this as a foreboding to position in calls on DRV
- If orders do not show signs of slowing, I’d be looking for a potential short term relief on the NAHB index as shown in my graph above. It could be taken as a view to take near the money puts on DRV
- Special note on the above - if you’d rather play SPY or SPX with this data, just keep in mind that bad news is still bullish for the broad markets. Slow orders and bad housing = bullish for SPY/SPX, strong orders and good housing = bearish for SPY/SPX
Again I can’t stress enough that I haven’t dived into the intricacies of analyzing the housing market data as much as some of you, so if anyone has any contrary opinions or different ways to play this (looking at you Navi) please chime in.
2 Likes
Interesting take from Walter by Credit Suisse in housing and personal income as well as consumer confidence
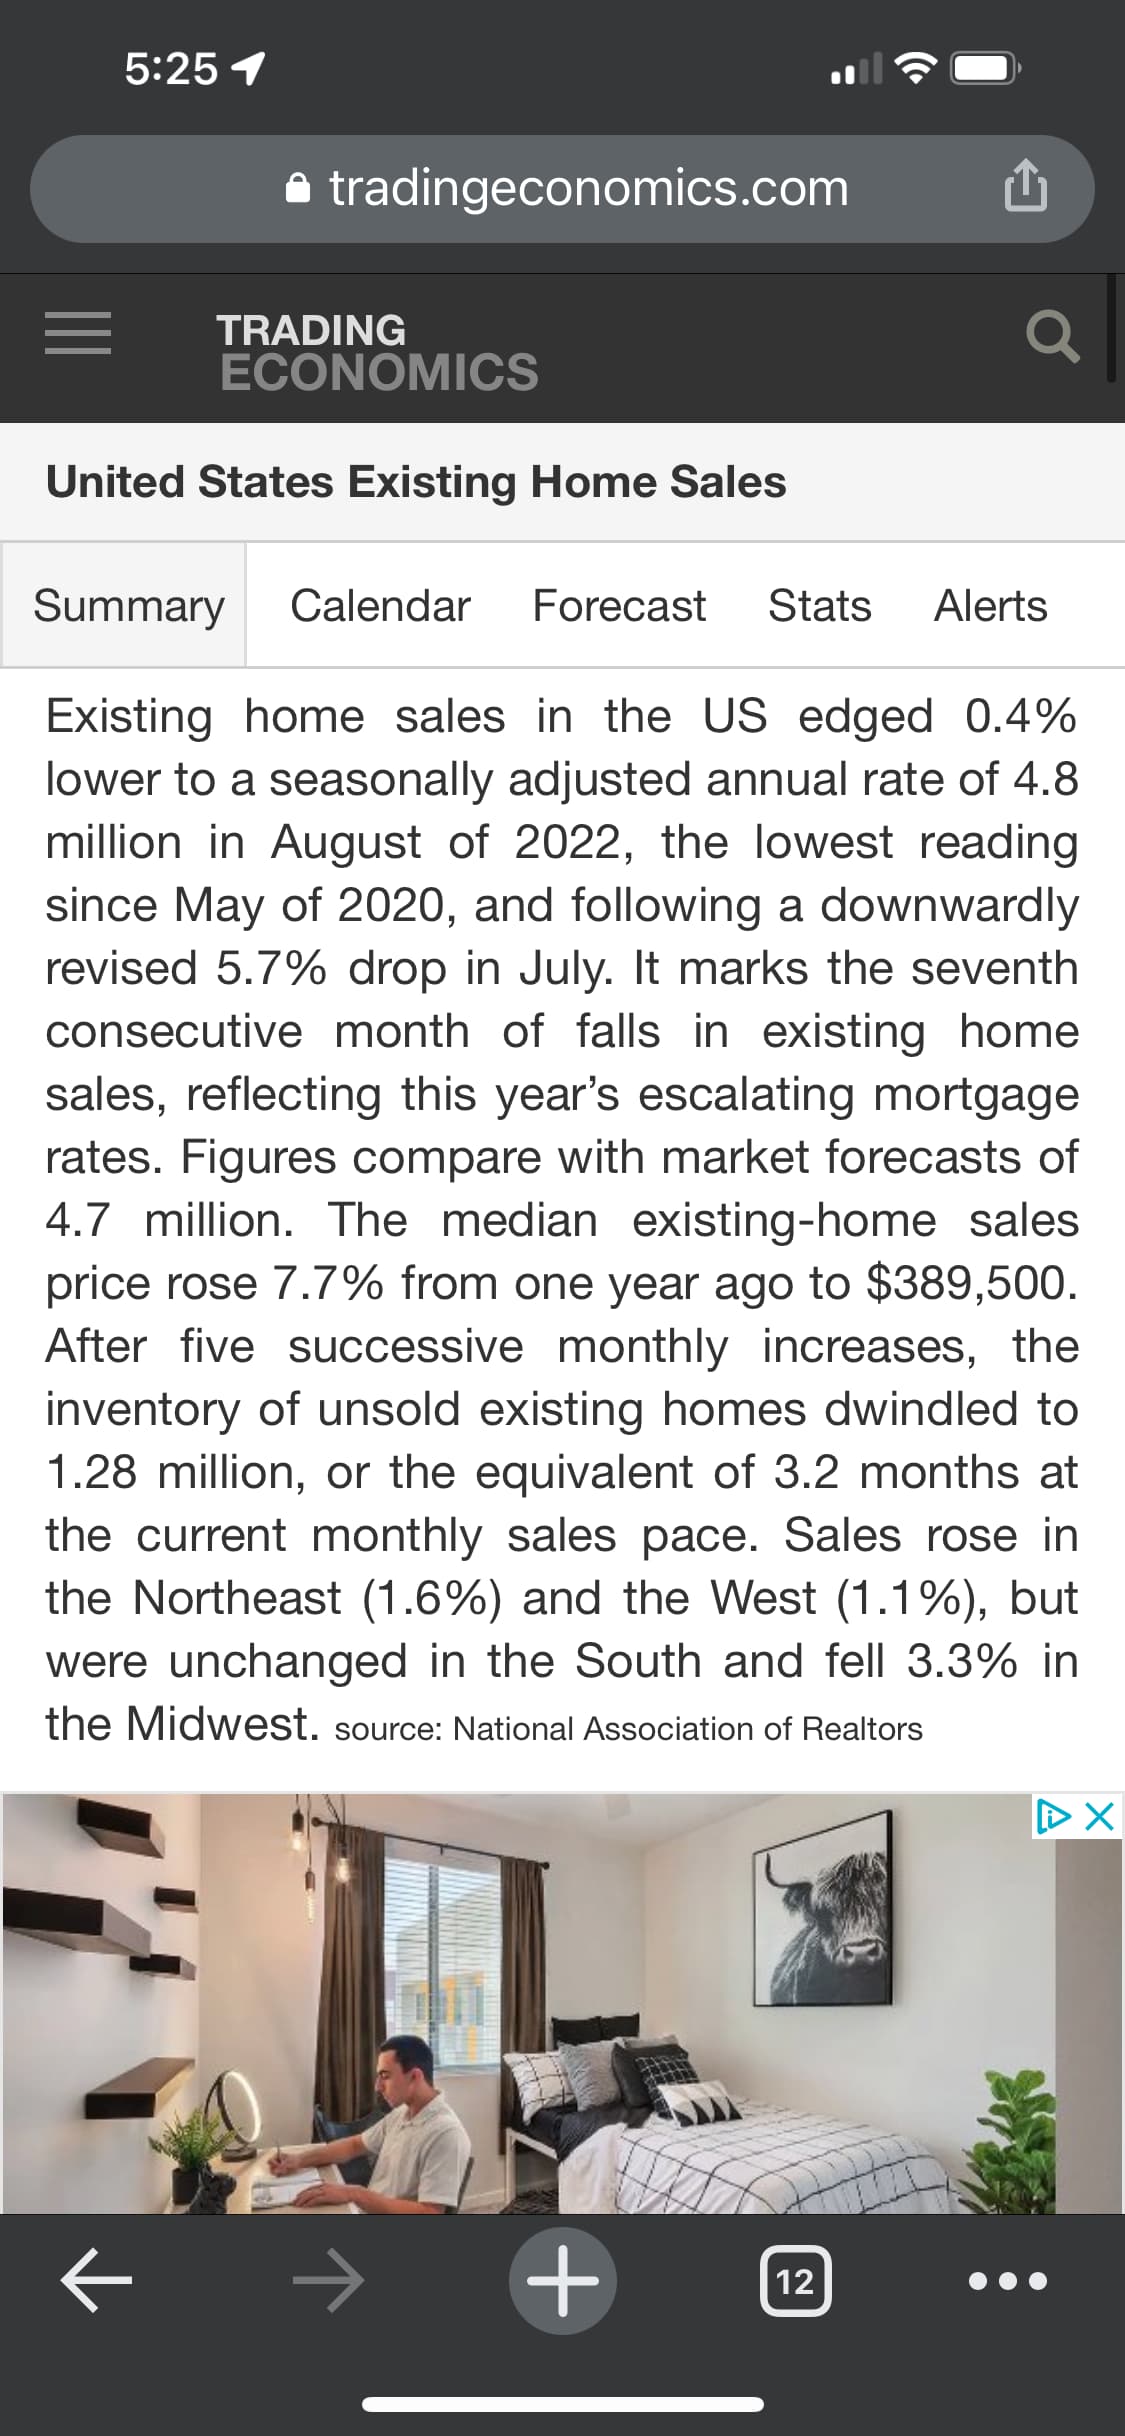
I doubt it’ll be a big surprise as existing home sales came in like this. Granted new homes and existing homes have some difference but not much. Nonetheless DRV is possible for out territory absolutely if housing recovers. We need the KB and LEN results in here
2 Likes
Also as mentioned in this document housing demand hasn’t taken a huge yet with the current rates. But with rates at 6.2 and another .75 hike on the way to be factored in… next months housing numbers (or November’s) will be the big tellers I think.
2 Likes
Redfin is pretty handy, thank you for posting it @SuckyMayor…I’m trying to find basically the page/data I’m linking below but fully up to date, this only goes through August (but could still be useful, cause the drop on Tuesday is up through August too, right?).
I’m curious because of some anecdotal stuff, I did ask around about seeing data on current home sales, best I got was someone who has local data only, which I don’t think would be too much help. But, the one thing that was said by almost all of them was to look towards New York’s Housing/Real Estate data, that the state is a ‘leading indicator’ on overall housing trends…again, purely and super anecdotal, and still needs to be back tested a little, but it’s something interesting that I thought could be useful.
Redfin’s data on the New York area…some pretty nifty charts here, the Trends chart could be pointing towards relatively flat numbers, and that Migration one is just downright interesting (fyi, the charts are not completely mobile friendly, looks/works best on PC)
https://www.redfin.com/city/30749/NY/New-York/housing-market
Saw this somewhere and just parking here
https://www.bloomberg.com/news/articles/2022-09-26/remote-work-drove-over-60-of-house-price-surge-fed-study-finds
3 Likes
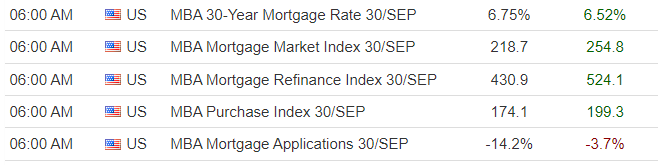
MBA mortgage data just came out this morning.
MBA Mortgage Applications 23/SEP = -3.7% (prev 3.8%)
MBA 30-Year Mortgage Rate 23/SEP = 6.52% (prev 6.25%)
4 Likes
@Navi have you happened to notice that DRV has gone up a nice $30 since I mentioned it a few weeks ago?
1 Like
Weekly mortgage came out this morning… Interest rate up to 6.75%, applications down -14.2%.
This topic was automatically closed 14 days after the last reply. New replies are no longer allowed.
There seems to be two competing viewpoints on where the housing/shelter related component of CPI will go.
On one hand, we have the Zillow Observed Rent Index suggesting rents will be coming down soon (HT @macromicrodick)

On the other hand, there’s research from Goldman that says, “not so fast!” This thread from the Fed Whisperer summarizes the arguments well. Reproducing prose and images below.
A lot of people are pointing to declines in new apartment rents as a reason to expect relief on inflation beyond the next few months.
A new note from Goldman Sachs offers some reasons to greet such optimism with skepticism.
Indeed, annualized growth for new residential leases decelerated notably to 3% last quarter, according to Goldman Sachs.
Rent growth for new leases could continue to run around 3% next year after declining somewhat in the months ahead, they say.

But overall shelter inflation could continue to run higher because rents on renewed leases could continue to outpace rents on new leases due to “catch-up” effects.
Goldman: “Our estimate of the speed of catch-up suggests that continuing lease rents will rise 6% in 2023.”

Goldman: The net of the two—deceleration in new leases but acceleration for renewals—suggests overall shelter inflation will increase to 7.5% next spring from 6.8% currently before gradually decelerating to 5.9% at the end of next year, up from a prior forecast of 4.9%.

Goldman says this “ongoing firmness” in shelter inflation measures could make the Fed more likely to raise rates beyond the current terminal rate projection of 4.6%.
“For that reason … we see the risks to our peak funds rate forecasts as tilted to the upside.”
@Kryptek and @RefirgerateMyESSCash , please chime in as I wouldn’t do justice to what you shared no the TF.
2 Likes

Excellent video looking at the big picture. I’m on the road right now explains the interactions between interest rates, orders, manufacturing and construction and employment.
1 Like
Hello money making family…with the crazy volatility we are seeing, I am looking towards the future with HD as a play. In my opinion think we have a week or two or bullishness, but longer term bearishness. With ER set for November 15 (after FOMC- Nov 1-2, mid terms-Nov 8, CPI-Nov 10, and Veterans Day-Nov 11), there will be catalysts that will impact the stock price of HD as well as others.
Here is the OI for Nov 18, Dec 16 and Jan 20


Would like to see a little be of a pull back before calls and above 290 for puts in Dec and Jan. Just my opinion on those.
1 Like
Good morning! Given the current CPI release for October, I will dig in to see how I am playing HD for earnings next week. Considering housing data but this is HD quarterly so may have some guidance impacts etc. more to add, feel free to add as well! Cheers
1 Like
Since I have a position in HD from 2005, I wanted to share that I scaled out some more of my shares today partly because of the looming recession fears for 2023, but also for some tax loss harvesting I was planning to offset before year-end. Sold about 13% of my current position in HD.
3 Likes
^^ This is from 7 months ago. Yet, looks like we’ve pretty much stuck to the same script. Median home prices have only gone higher, while sales of both new and existing homes are down and supply of both are up (though there does seem to be a slight downtick in Dec).
This is quite surprising, no? What is the missing link that explains apparent contradiction? Where supply seems to be abundant, while prices still go up and homebuilders are doing quite ok?


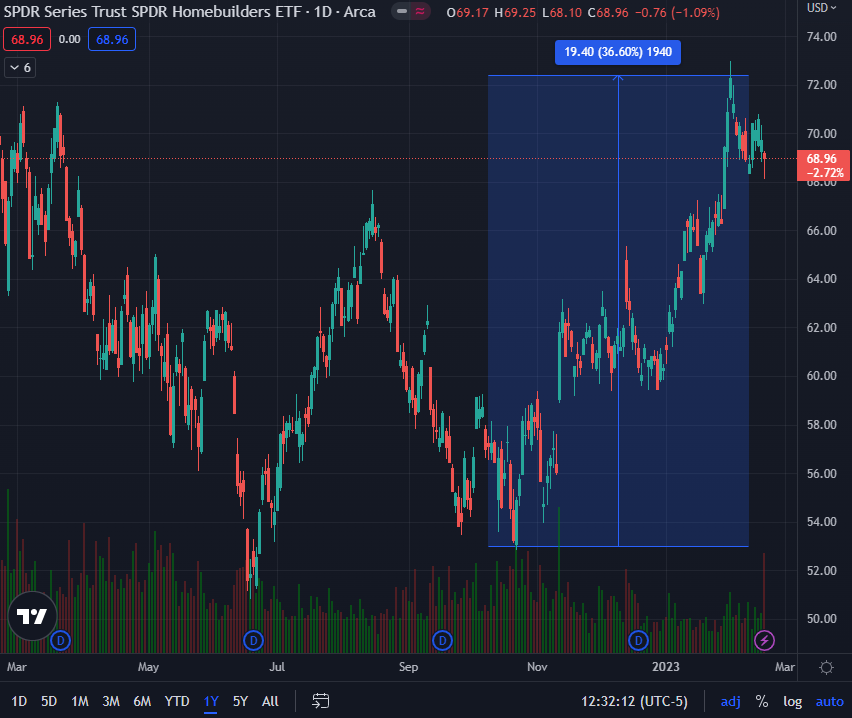
XHB, the homebuilder ETF, went up 33% in the last 3 months. There was a bit of a reprieve as 30Y mortgage rates fell from 7% to 6.3%, but with yields going up, this could go the other way again. And the spread is historically high, suggesting originators are pricing in additional risk.

3 Likes