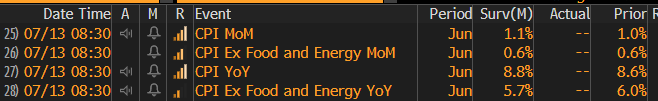
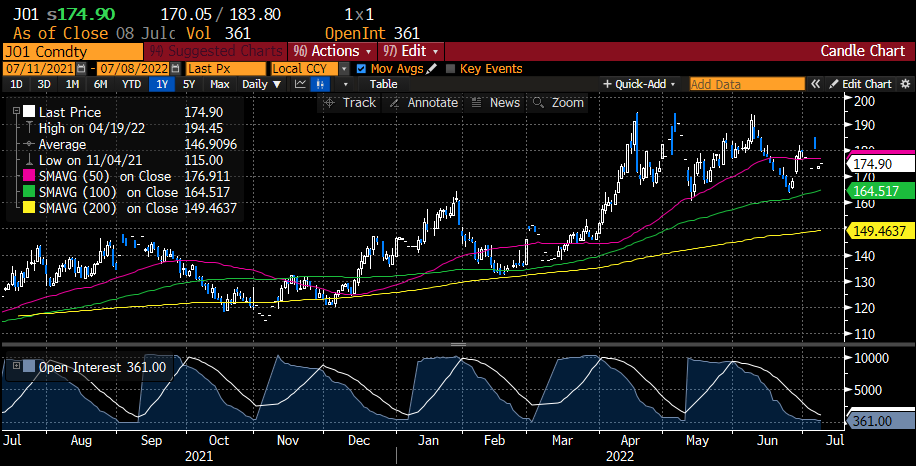
First and foremost, let’s take a look at what’s expected (and priced in):
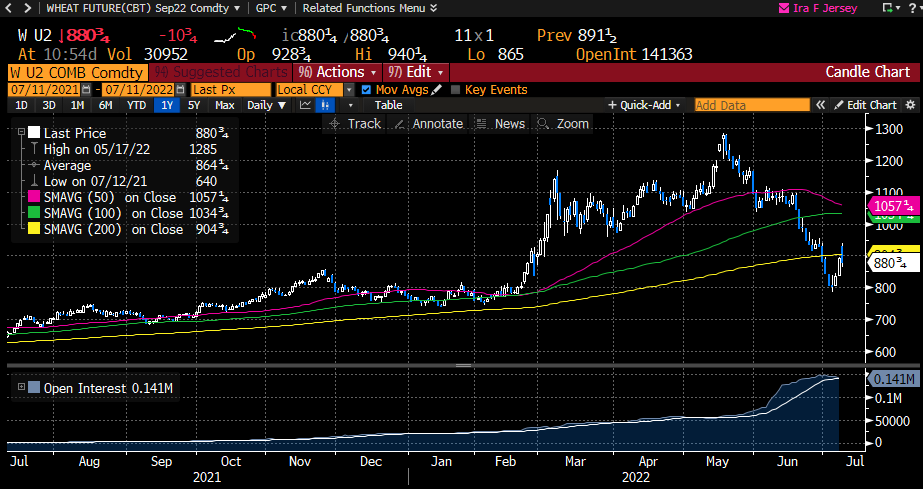
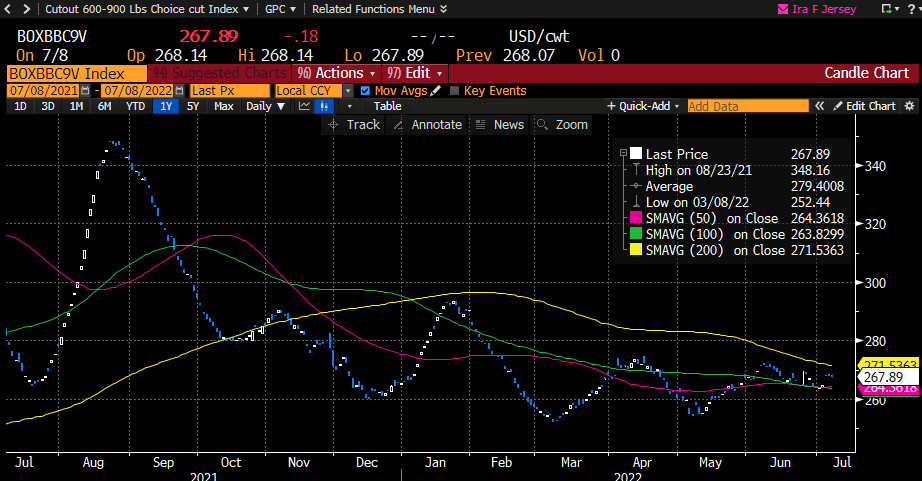
Expectations are EXTREMELY high here, it’s calling for headline inflation to accelerate from last month’s and for core to stay flat MoM. Commodity/energy prices did increase in the first half of June, but then crashed along with the market around the middle of the month. Wheat prices peaked in the middle of may, and crashed during the month of june. Given that some things peaked halfway through june, and the fact there’s a lag between commodity prices changing and consumer energy/food prices changing, it’s tough to say exactly when the impact will be felt, but I think a projection that inflation accelerated in june vs may is kind of aggressive.
I think there’s a high probability that the numbers come in less than expected since the expectations seem unreasonably high given that commodity prices declined mid-month.
One thing I have watched for in advance of CPI numbers is whether the White House comments in advance. The last 2-3 times the numbers have been higher than predicted, the White House tried to get out in front of the news, leaking that the numbers were going to be high and scheduling a Biden speech on what’s he doing to fight inflation. The last 2 times the numbers have met expectations or been lower than expected, the White House has stayed mum until after the numbers were released. So I will be closely watching what the White House says Monday and Tuesday ahead of Wednesday’s report.
Bear Case: I do think prices are dropping some, but diesel is still $5.65 national average… We were used to below $3 pre-war. Global fuel prices are even in worse shape. That will keep prices up across the board as everything from farm to table, sweatshop to retailer, have that big variable fuel cost. We have yet to see any real demand destruction.
Neutral Case: Numbers come in as expected but possibly the market stays flat. Since earnings season is just about to start they might wait to take a queue from what banks & investment groups say, the mega caps, and the big guys in key sectors.
Bull Case: That being said, if numbers do come in at or below estimates, you can likely bet all the news sites & politicians will be talking “we can do a soft landing with our strong economy” and start getting retard optimistic that could cause a big rally. At least up until the next Fed rate hike on July 27th.
Well, there’s no doubt the number is going to come in hot.
Even if it comes in under at 1%, that’s 12% / year and is EXTREMELY hot still. When it comes to politics for the general public, they’re not looking at analyst estimates of what’s expected vs what comes in, they just look at what comes in.
The expectation of 1.1% MoM will be the 2nd highest print in over a decade (March of this year came in higher), the 8.8% YoY is the highest since the 70s/80s.
I’m kind of surprised SPX is at 3900 with prints this bad already priced in.
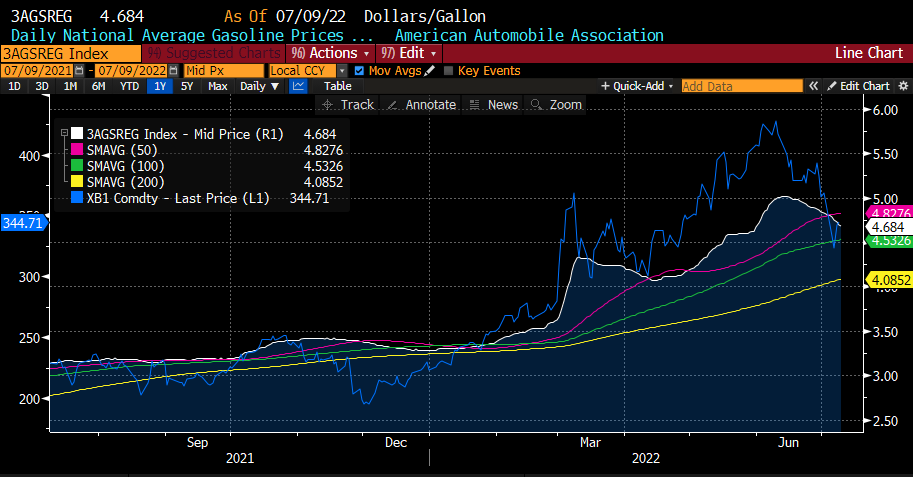
Assuming core CPI MoM comes in the same at +0.6%, which seems reasonable because not that much has changed between may and june, energy prices did accelerate a little bit more in june vs may (avg gasoline price is +9.1% MoM for june vs +8.1% MoM in may). Food prices are kind of a mixed bag.
I think food prices should offset some of the energy gains for last month, and that we’ll come in @ 1.0% headline and 0.6% core. Add in the wildcard factor of high retail store inventories and the potential that they discounted heavily in June to unload stuff and we could potentially come in @ 0.9% headline and 0.5% core, which are still very high numbers that the white house would still want to get in front of.
picked up a few SPX 4000C for wednesday @1.35 for a lottery ticket. If we see any kind of downtick in inflation we could easily see the market rip 3-4%.
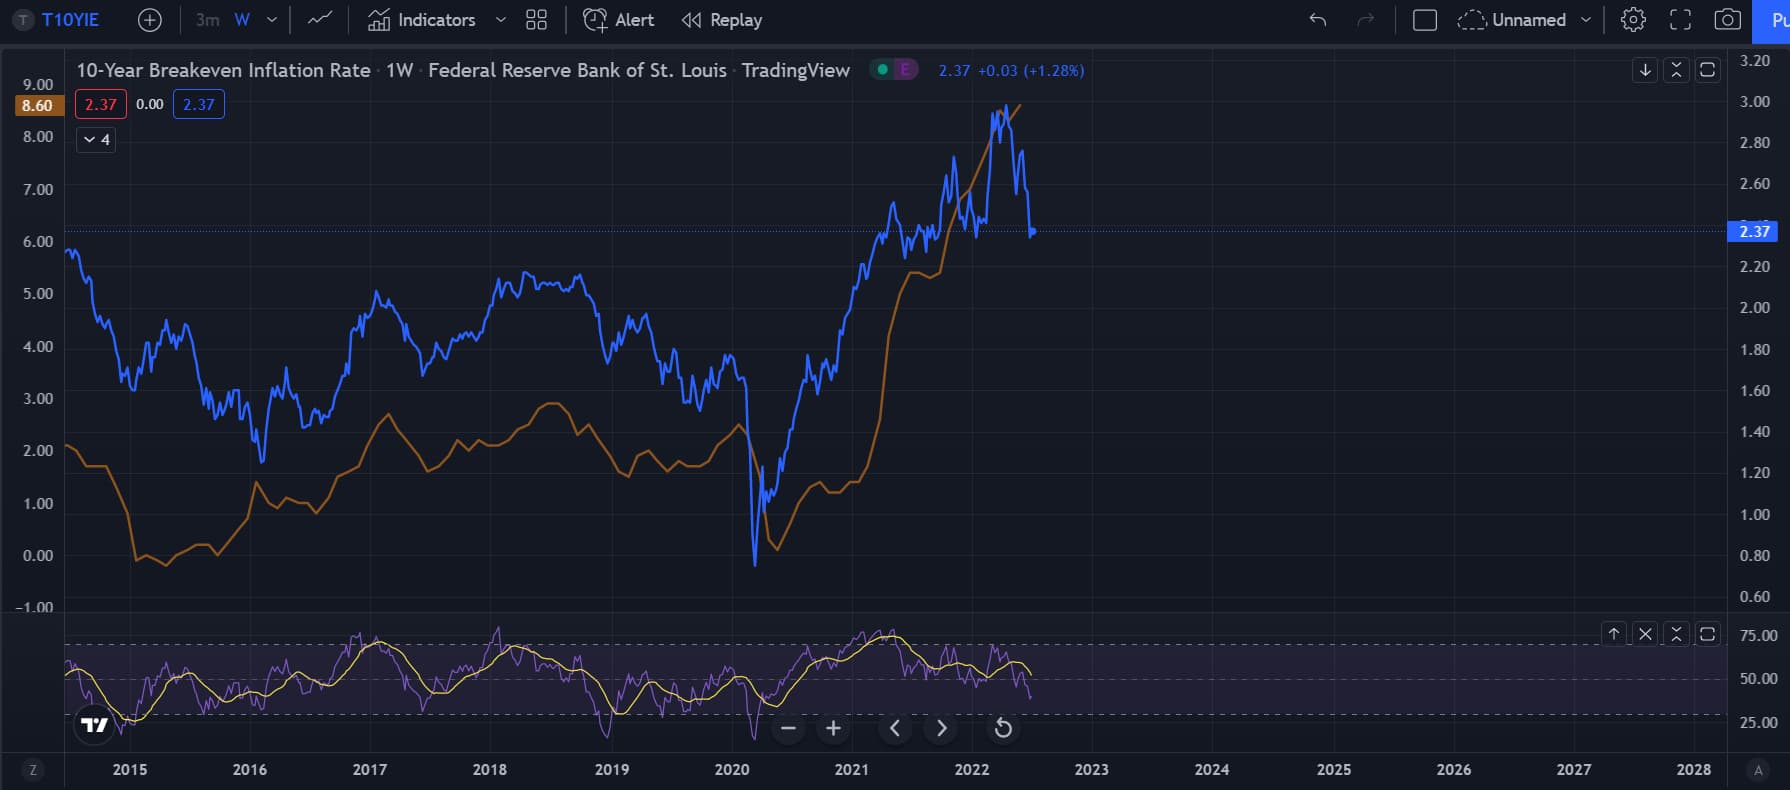
The blue line is the inflation prediction and the orange line is the actual inflation. So far, the inflation prediction has been on point and the actual inflation data has followed. Right now, it’s looking like inflation is peaking and the within the next few CPI readings, we are going to see peaking.
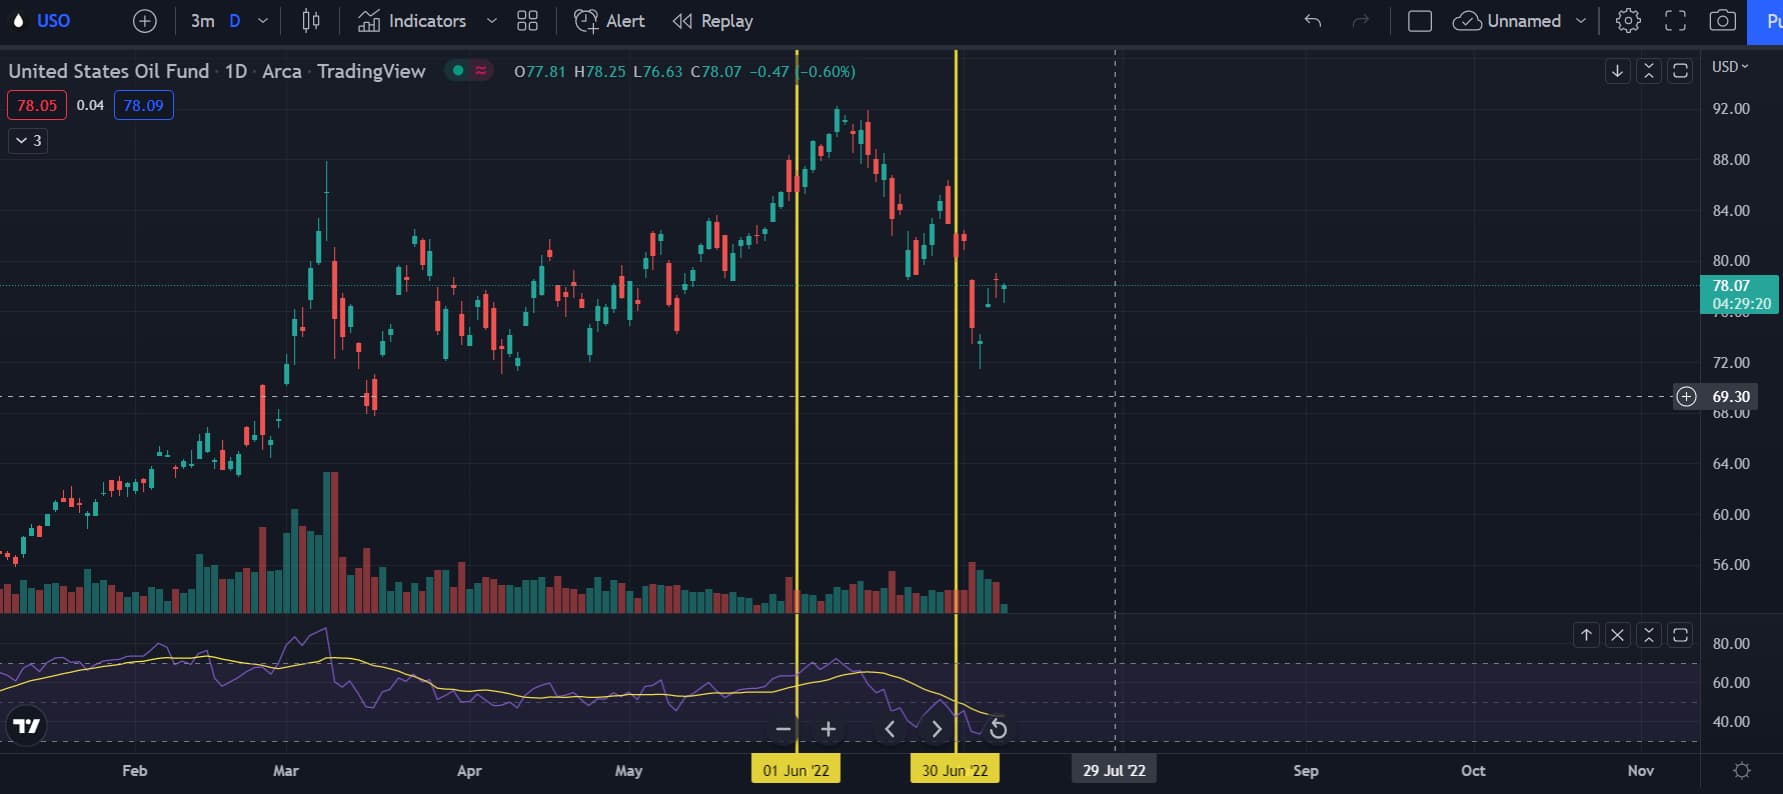
Another reason is because Oil looks like it’s peaking. For the month of June, it was down around 9%, although there was a run up beforehand. If I remember correctly, oil was one of the primary reasons why CPI was still very high.
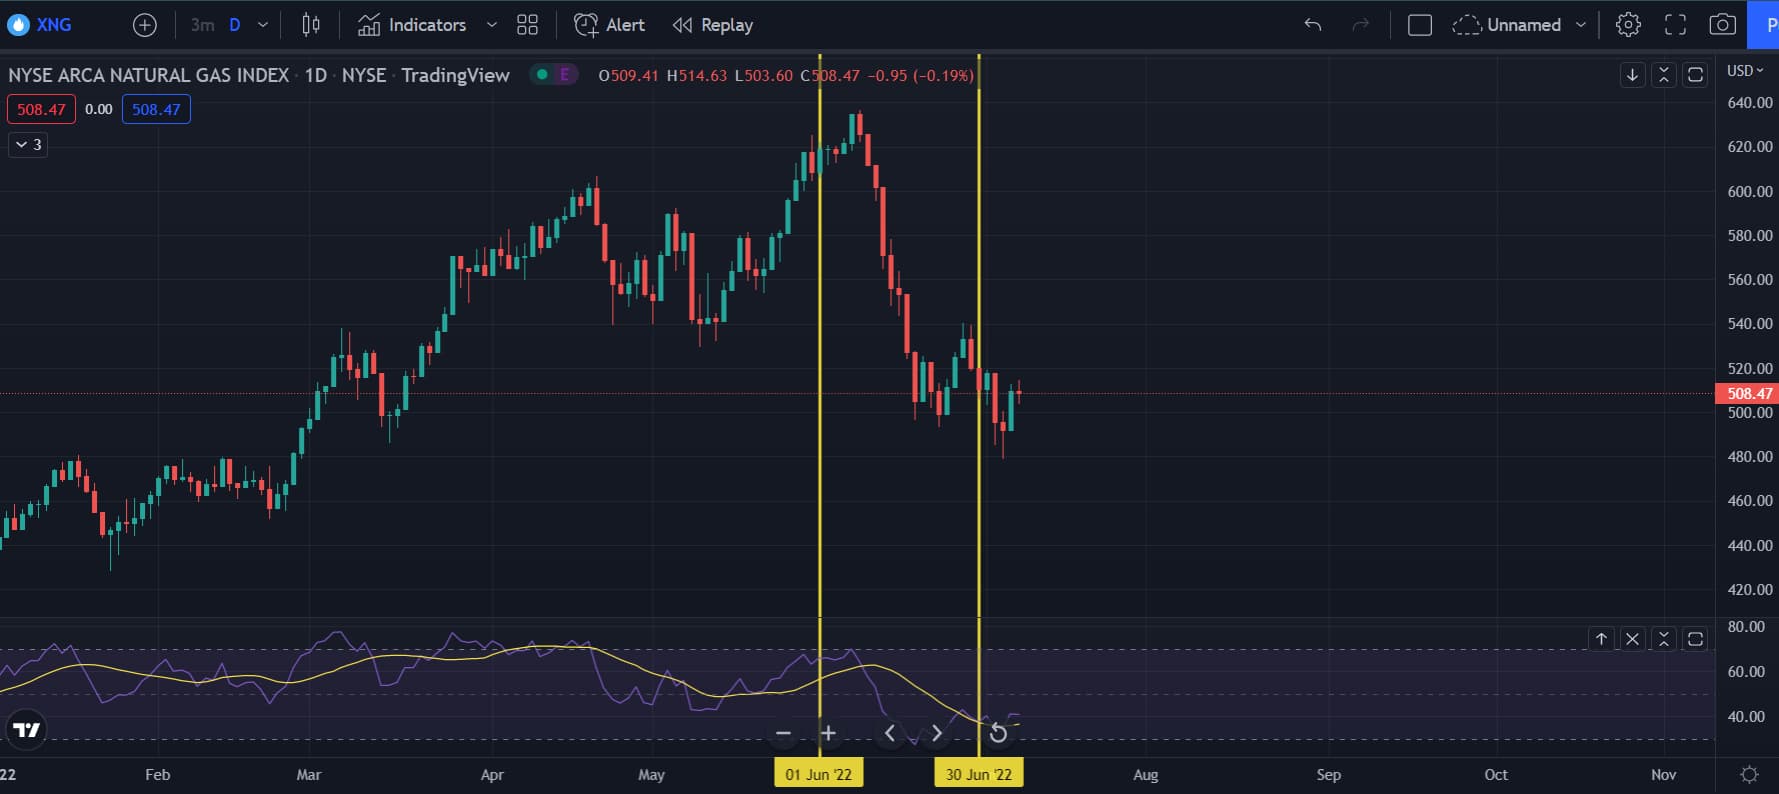
Natural gas shat down almost 18% as well during the month of June. These 2 oils cause me to believe that the CPI is gonna come in better than expectations. Unless I’m misinterpreting shit.
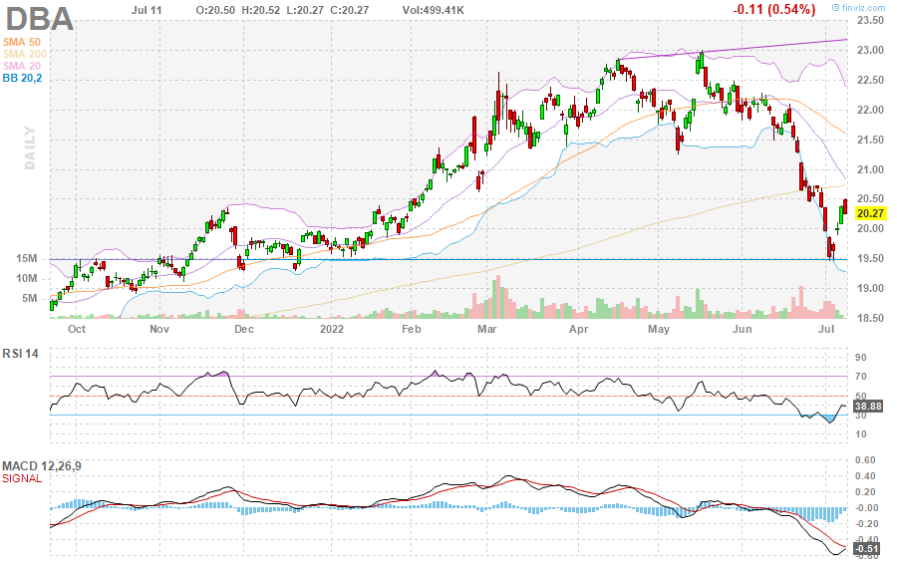
I tried searching up commodities ETF, but this is the one I found. Idk how good it is, but it’s also down like 8% for the month of June. It looks very similar to the USO etf, so idk how accurate this is for commodities as a whole. I also looked at WEAT and CORN and they’re down a good amount in June too, although idk if that matters in CPI.
Just as a personal experience, I found that grocery bills for me are actually starting to go down. Prices hasn’t gone up and chicken breasts are starting to lower again. I used to only be able to find $15 as the cheapest, but now I’m getting $13 chicken breasts. Idk if that’s for everyone, but just something I wanted to point out.
DBC is a great one indeed. Played it for a few months. It is heavily weighted on oil and oil-derivatives, so part of the recent fall is as a result of those prices getting adjusted downward.
Please keep in mind that CPI means Consumer Price Index. It is the amount that the average consumer is paying for goods and services. This means that, while oil and natural gas are a component of CPI, they are not the most heavily weighted components of CPI. For example, when calculating how much consumers pay for gasoline, they do not use the price per barrel of oil; rather, they use the price per gallon at the pump.
Here is an in-depth sheet for how average prices are calculated:
It’s important to understand these numbers and the impact June may have had on whether those numbers stay flat or increase. For example, while oil and natural gas prices may have gone down the second half of June, the price of gasoline did not. Just some food for thought.
The Core CPI estimate has been updated down to 0.5%:
I did some calculations with the data posted here using CPI weights published from earlier this year (https://www.bls.gov/news.release/pdf/cpi.pdf) along with some assumptions (basically for June vs May, gasoline prices way up, other energy flat, food prices slightly down), and my prediction for wednesday’s release is: 0.8% Headline Inflation 0.5% Core Inflation
Gasoline is the only thing that’s up a lot in terms of food and energy, but that’s < 5% weight in the overall CPI, so the gasoline effect is only around 40 basis points on top of core, and natural gas was flattish for June vs May and that’s a big factor in electricity generation. Food prices seemed to have gone down during the month.