I decided to continue tracking Nordstrom for their next ER in Feb/March 2022.
Chart…

While it seems to be consolidating now here at 20, volume is still low and other indicators do show a consistent weakness in price action.
Barchart Opinion Ai has it as a Strong Sell, but I’d be weary to buy PUTs here unless it breaks the support of 19.92…

Calls are also not advised unless it breaks resistance of 20.95.
We’re still in a choppy market so whatever catalyst may seem plausible for either side may just be a trap.
Best to wait for a clear direction.
DD requested by @Moses
What this is: Earnings Report play on $JWN, Nordstrom
Read: Scalp / Swing Trade
TLDR:
Free Float - 110.59m
Market Cap - 5.14b
Looking to turn Bullish post their 4th Quarter ER, later today, Tuesday, AH, Nov 23, 2021.
Earnings Whisper summary…

Barchart article from Zacks Equity Research…
https://www.barchart.com/story/news/3653511/heres-why-nordstrom-jwn-looks-poised-to-beat-on-q3-earnings

Excerpt:
"Nordstrom has been gaining from solid demand, better inventory, stringent cost-cutting actions, and improved sales trends at Nordstrom and Nordstrom Rack as well as across regions and categories. Strength in shoes, apparel and accessories are also expected to have been aided JWN, with active, home and designer categories getting back to the pre-pandemic level.
The company remains focused on technology advancement by boosting e-commerce and digital networks, and improving its supply-chain channels and marketing efforts. Gains from improved digital traffic across both Nordstrom and Nordstrom Rack have been aiding the digital business. Alongside these, the integration of Rack.com onto Nordstrom.com should have contributed to the company’s top line in the quarter under review."
Barchart overview…

Barchart Ai shows weak sell signal…

Support and Resistance are noted on the right side.
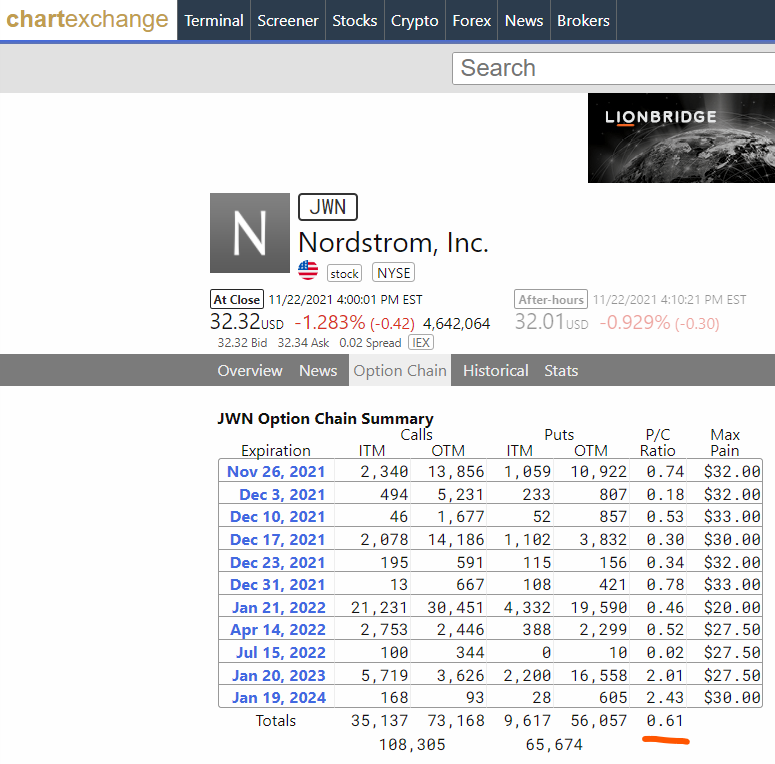
Options Chain for all dates is slightly Bullish…
Ortex data…

Ortex Short Interest data…

You see how the shorts have since exited from September and covered slowly from 21.58m shares.
There is still 15.13% of Estimated SI that can be squeezed, but it will need a big sentimental rally to do so.
Rather, expect the shorts to continue covering in short bursts once the price regains and continues a bullish momentum.
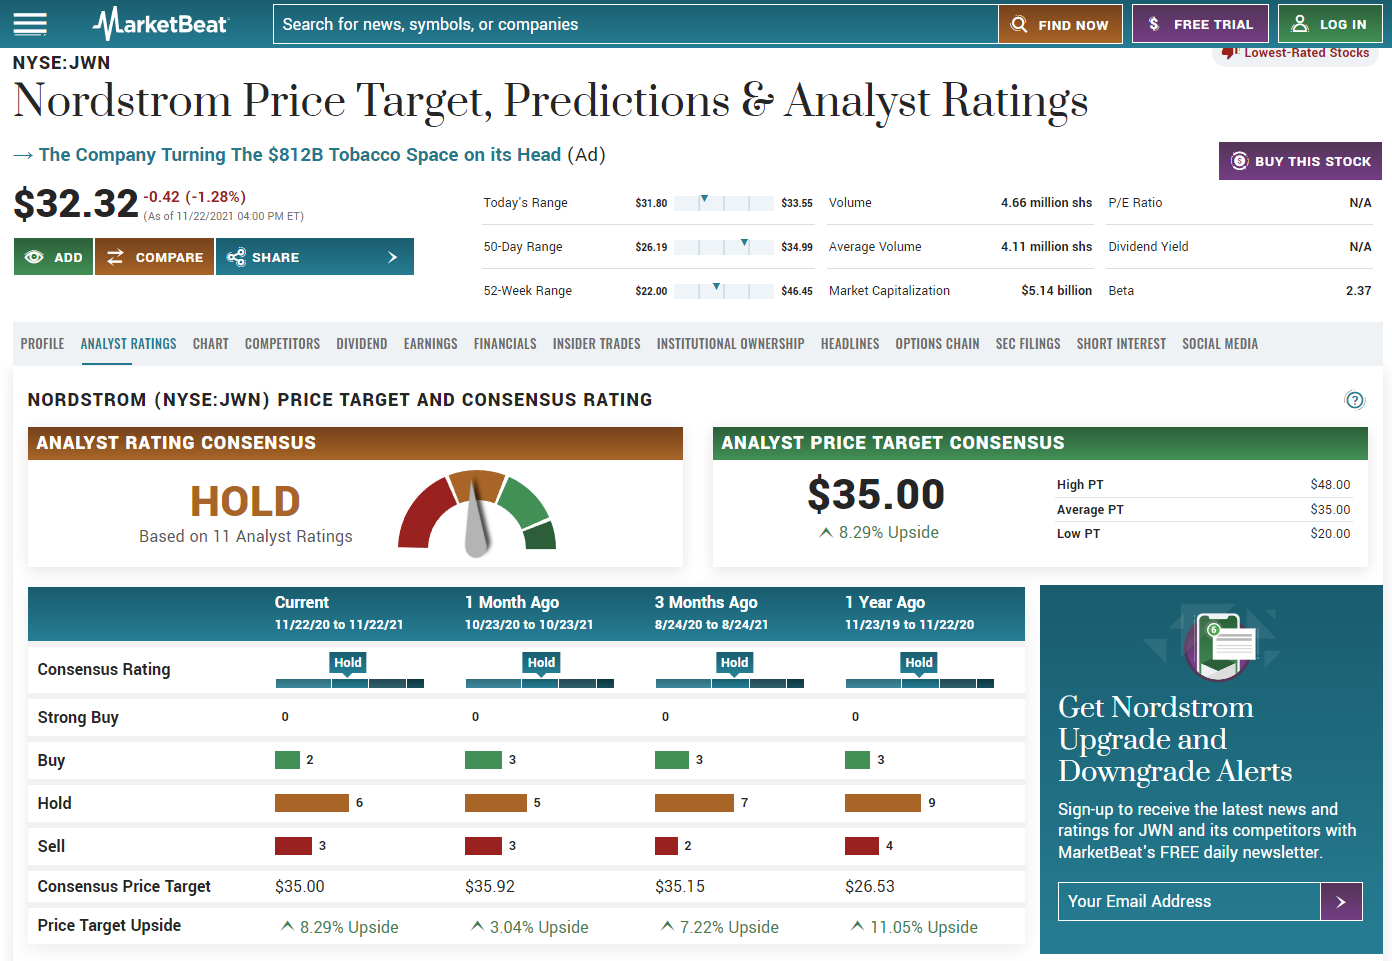
Marketbeat data, Analayst Ratings…
Insider Trades

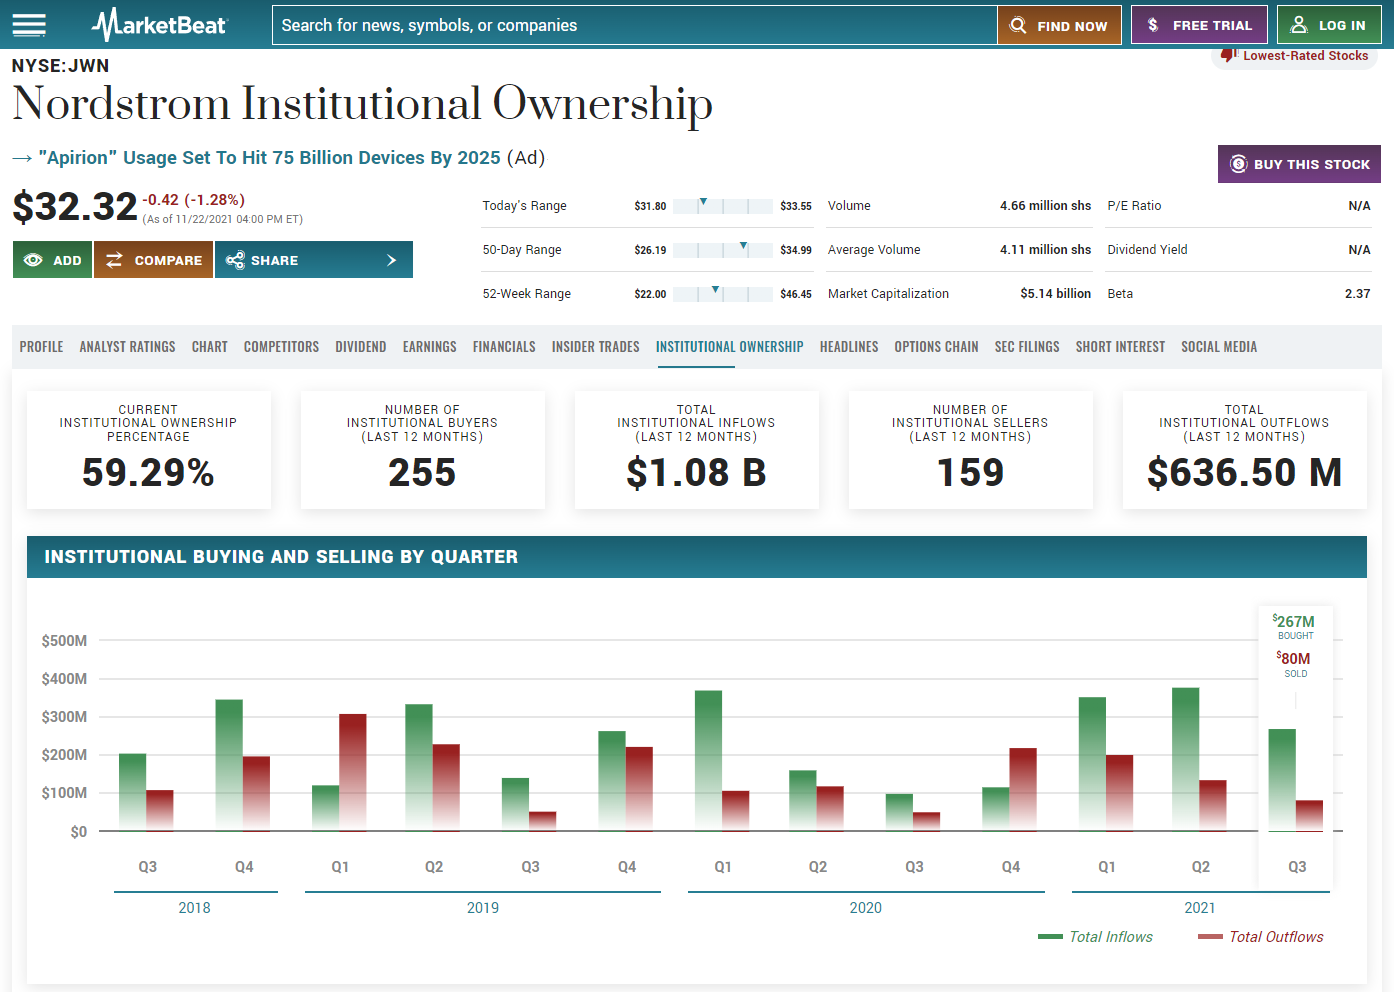
Institutional Ownership
The chart…

Daily Candles on the left,
- JWN Nordstrom has been trading sideways the entire year of 2021, and mostly stayed on the upside according to the Regression Trend tool.
- Regression Trend also shows that there is good amount of space to continue moving upwards.
- Previous Year 2020’s 4Q ER continued pushing the stock price up to Dec 20, 2020, it seems poised to mirror that movement this time too.
- Sept 16 broke the downward price movement from the 3rd Quarter ER, and the stock price has been on a bullish momentum since Oct 13, 2021.
- It was only last week, Nov 18, that the price started on a sharp downtrend from the recent high of 36.43–I believe this is being priced in to the ER tomorrow AH.
- MACD line and Signal line are seen touching here–not a complete cross.
- MACD histogram has been enjoying the upward buying momentum even with the red candles.
- RSI shows a cool down from recently being overbought–twice.
- BB %b, here I marked August 21 as the ideal entry if you’re bullish on the stock–it closed at 29.41, which is 11% from yesterday Monday’s closing price of 32.66.
- Fibonacci Time Zone #8 has until Dec 28 to reach a higher price this quarter.
4hour Candles on the right…
- Candles show a Double Bottom bounce from 31.80 and 31.85.
- Regression Trend tool seems to be hinting this price as the lowest possible entry.
- We may see the price bounce tomorrow in this channel of 31.5 - 33.5.
- Since this downtrend is a sudden break from a recent Bullish Run series, we can expect a short retracement.
- Fib Retracement Tool is hinting that a bounce to 33.5 is not unlikely, with a retest of 35 in the near short term a clear possibility.
- MACD is dipping to the downside of the histogram.
- MACD histogram is hinting at weakening selling pressure, although the lines are still divergent.
- Vortex indicator, confirms more of what we see on the MACD indicator–which is a sudden albeit weak break from the recent bullish momentum.
- Momentum Squeeze Indicator, shows only the upward momentum squeezing, the sell side is obvious but weak compared to the buying pressure.
Here’s a comparison of how its competition did on their ER days and after…
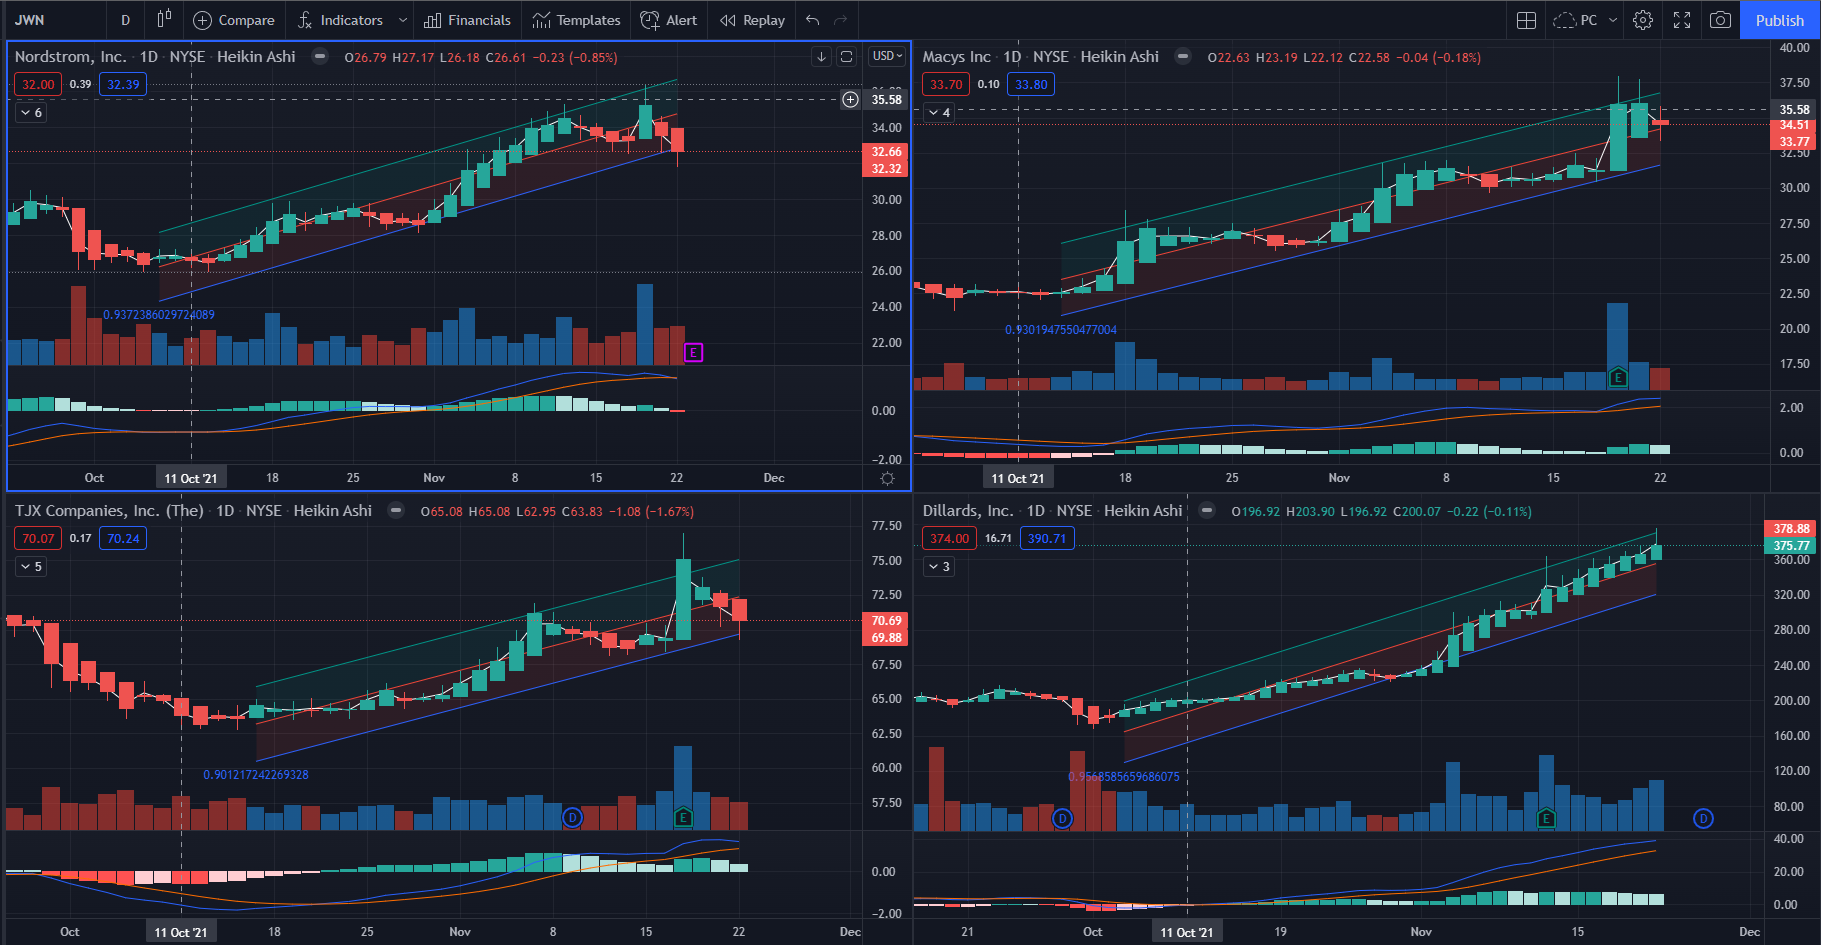
Macy’s, TJ Maxx, and Dillards, all did well.
I don’t see any reason for JWN Nordstrom not to follow suit.
IF I were to play this with Options, I would choose a longer Monthly Expiration, ATM or nearest OTM.
IF I were to play this with Shares, I would time the lowest entry before the ER.
*I have no position at this time.


