OIL - Let's talk about oil prices and where they are (potentially) heading

I’ve been reading quite a few articles on oil lately (as they always seem to increase in frequency with the price of crude oil). An interesting Bloomberg article I came across this morning:

The World Has Been Using A Lot More Oil Than We Thought
Global oil stockpiles are a lot lower than previous estimates suggest.

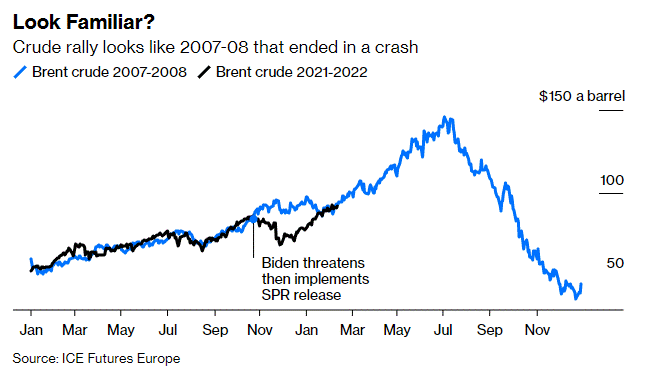
Beyond the talk about the discrepancy between where stockpiles ought to be and the volumes that had actually been reported, this chart really stood out:

Brent_Oil

If you want to look at longer term charts you can check out this site:

This is just more of a “Hmmmm… that’s interesting…” kind of thing right now. The demand revisions estimates that global oil stockpiles are now below their end-2019 level at the start of 2022 (-16.5M vs 660M previously estimated). If you take the estimate of ~97M barrels of oil consumed globally daily, that is 7 days worth of reserves that went poof.

For comparison of how much the global estimates were off, currently the US Strategic Petroleum Reserve is 587M barrels.

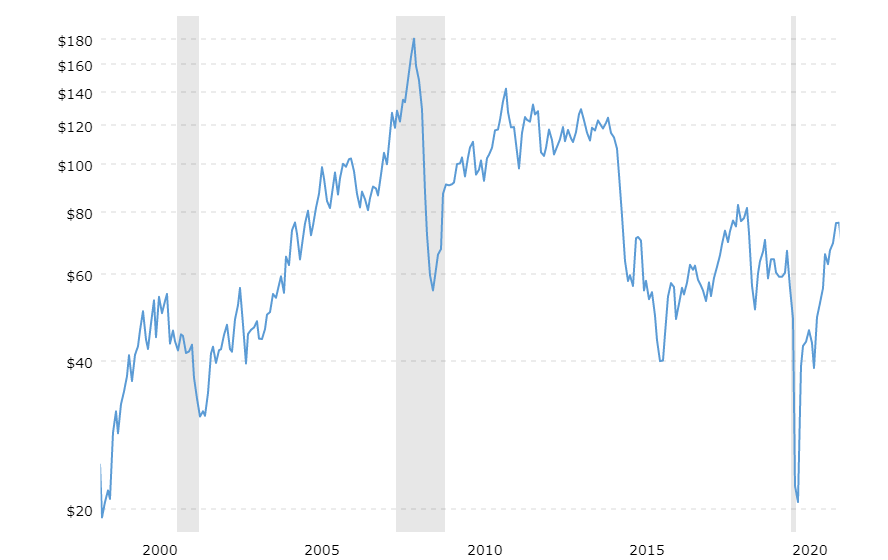
Indeed if you look at charts of oil prices there is the eerie similarity between the 2007-2008 run that can’t be denied, with the economy trying to ramp up from COVID, slap on all the rising costs of everything from inflation, the anti-oil stance of the administration, the fact that current oil production can’t meet consumption, and global uncertainty right now (i.e. Ukraine), and now that big hit to the global oil reserves estimates… There is a strong likelihood that oil prices will continue this uptrend for at least several more months.

I’m not saying go out and buy every 3x leveraged oil ETF you can find right this second… NO! But I do think this warrants further research as we seem to be getting closer to that $100/barrel price.

14 Likes

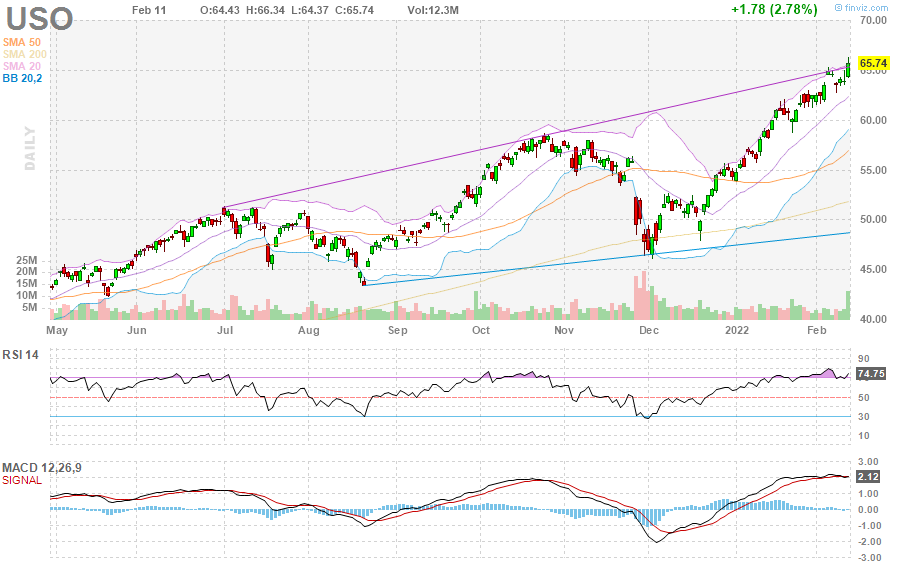
I’ve been slowly paying attention to USO. I keep waiting for a pullback but just showing nonstop strength especially looking at the 3 month chart. Hoping for a Covid related news for a pullback, as I’ve noticed that news really impacts USO pricing more than anything else.

1 Like

I listen to hedge fund manager Erik Townsend’s MacroVoices podcast, mainly following crude oil alongside other macro market trends. In a recent interview, he discussed the ramifications of the economy reopening and the impact on global energy. Here is an outtake of the conversation:

" Well, let me tell you how I look at energy very briefly. You know, for me, there’s really, if I look at the past 20 years, there’s really two different periods, there’s a 2000 to 2015. And then there’s a 2015 to COVID. Basically, you know, 2000 to 2015, the world goes from using 400 exajoules jewels a year to 500 exajoules a year. And out of that 500, 61 comes from China and out of that 61 from China, 51 come from coal. Meanwhile, there’s basically no increase in the consumption of energy from 2000 to 2015, across the OECD. So basically, what happened between 2000 in 2015, to cut a very long story short, is that the world decided, you know what, I still want to consume a lot of these goods. But I’m going to outsource the production to China. And China’s going to produce them, not with expensive natural gas and not with expensive oil or expensive nuclear, but China is going to produce them by using very cheap coal. Because coal is much cheaper than everything, anything else. You know, if it wasn’t so darn polluting, we’d be using nothing but coal. It’s easy to move. It’s cheap, cheap to move, it’s easy to exploit. And there’s so much of it around the world. So what happened between 2000 and 2015 is basically half of the world’s increase in energy supply was done by Chinese coil. And at the cost of just enormous environmental devastation in China, you know, you were spending time there at the time so was I.

And then in 2015, China basically says, you know, what, I’m done. You know, I’m, you know, I’ve got, I’ve got babies dying of asthma, I, you know, I can’t do this anymore. And since then, coil used in China has flatlined. Now, we were saved because in 2015, the US oil and shale gasboom kicks in. So the US moves from five and a half million barrels per day, to 13 million barrels per day. And instead of using Chinese coal, we use US natural gas and US oil. But that boom is now over, because that boom was massively capital intensive. In fact, it was capital destructive. More than $300 billion were destroyed in the shale oil patch. It was massively destructive. And that brings us to today. Now, you know, COVID has set us back in terms of global energy use. But if we think that by 2022-2023, you know, will be roughly back to normal in terms of global travel in terms of everything else, then basically, that means that between now and the end of 2023, the world will need to produce an additional 50 or 60 exajoules, knowing that it won’t come from Chinese coal, and knowing that it won’t come from the US oil patch. So where’s it gonna come from? The answer is, I don’t know. But I think that’s problematic ."

The full transcript can be found here: https://www.macrovoices.com/guest-content/list-guest-transcripts/4489-2021-12-30-transcript-of-the-podcast-interview-between-erik-townsend-and-louis-vincent-gave/file

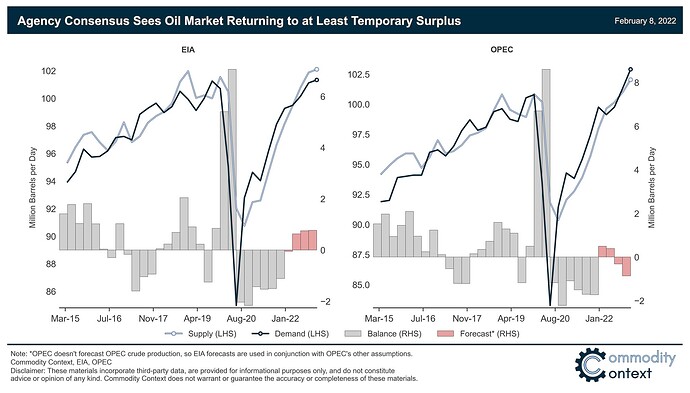
While the consensus is that the final years of the era of oil will be defined by very, very expensive oil (maybe, $150 to $200 per barrel) not by cheap, due to the lack of investment in continued oil exploration and production, coupled with low returns on green energy, agency consensus sees market returning to oversupply this year.

In other words, major monitoring agencies expect oil market pressures to ease over the coming months and conditions to flip, at least temporarily, into surplus through 2022. These agency outlooks for easing oil market pressure rely on 5 common assumptions:

  1. Rebounding US shale
  2. Further unwinding of COVID-era OPEC+ cuts
  3. All-time high production for non-OPEC producers outside the US and Russia
  4. Unchanged Iranian and Venezuelan oil sanctions
  5. A complete post-pandemic demand recovery

The SubStack linked below summarises the forecasts of OPEC (the Monthly Oil Market Report (MOMR)) and the EIA (the Short Term Energy Outlook (STEO)).

Oil Bullish on the Streets, Bearish in the Forecast Sheets

Ultimately, what is relevant here is that if you agree that we will see a market surplus shortly, you may consider adjusting your timelines for either entry or expected returns.
8 Likes

Great stuff, thanks for sharing the details, @TheMadBeaker and @sparrow!

Predicting oil prices is always a hoot. At some point in time, all the scenarios around demand-supply shenanigans have been true, and will probably be true in the future. Question for us is, what happens next?

Considering the following with the next 3-6 months in mind:

  1. With Omicron slowing down and the world getting restless, restrictions on business and travel should be going away over the next few months. We can expect demand to increase in short order, also as modelled by EIA and OPEC.
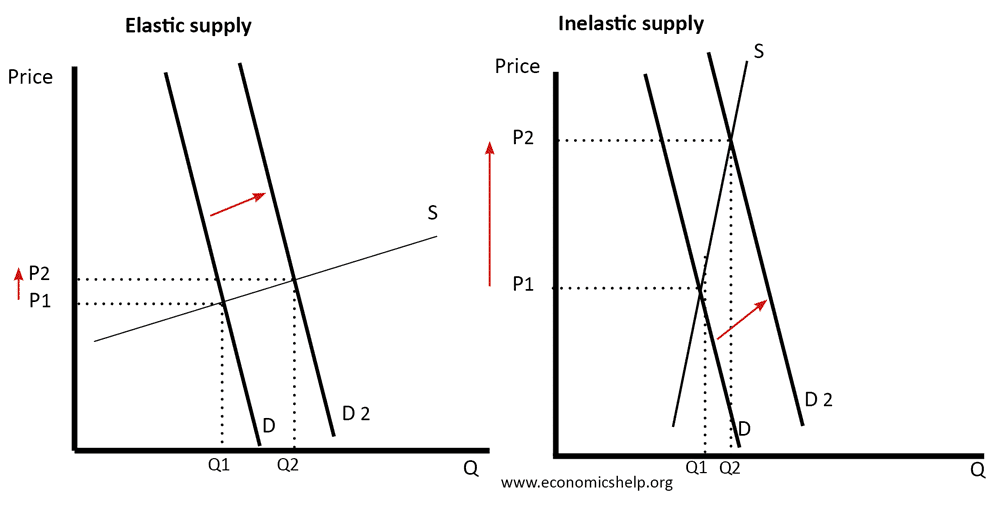
  2. However, the supply curve of oil is fairly inelastic in the short term - it takes a while to ramp up production to meet demand.
  3. OPEC has little incentive to ease prices, so they’ll take their sweet time adding to the supply. US shale has been burnt before, so will likely wait and see if prices persist. And other swing traders have sanctions on them or are at capacity.

It seems likely that we could see a hard spike in oil prices by the summer, followed by a bit of a drop, but not back to where we are now. I do not sufficient understanding to pick a PT, but this seems to be one of those “I see you at $100, and raise you to $150” scenarios.

Thinking of scaling into USO on the next dip.

9 Likes

I’m some what new to selling puts so I may be way off but considering the extreme volatility with pending war and for sure rate hikes, would selling puts be a safe way to play this?

1 Like

I wonder if the recent hike in oil price is just reflection of inflationary force more than supply demand curve. I find it hard to believe that demand has gone up during pandemic and supply side seems to be adequate. Those more in tune with the industry can correct me however.

2 Likes

@greydoge if by inflationary forces you mean the increase in money supply from all the Fed’s printing, that’s resulted more in asset inflation (e.g. the stock market), as institutions were the primary recipients of that money. There were some inflationary effects from fiscal policy, particularly through the stimulus checks, but I haven’t any data points that suggest that people spent disproportionately more on gas as a result of the checks.

On the other hand, @sparrow 's post has a link to this graph which shows how demand has outstripped supply since early 2021:

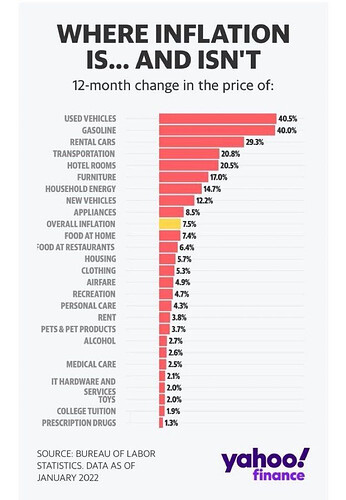
I also found this graph helpful, which breaks down where inflation is concentrated.

Gas was up 40%, far outstripping cost of food, prescription drugs, clothing, housing etc. which were all below the aggregate 7.5% number.

Because of the inelastic nature of supply, the graph on the right happened.

Interestingly, we see a similar effect with all the vehicle-related data points. That is a supply chain issue, a good chunk of which has to do with computer chips.

This also tells us, by the way, that while inflation may not have been “transitory,” it may turn out not to be chronic. As soon as the chip shortage is gone, gas prices return to normal, and the overall supply chain issues are resolved, inflation should improve.

Bets are, of course, on when “as soon as” is.

9 Likes

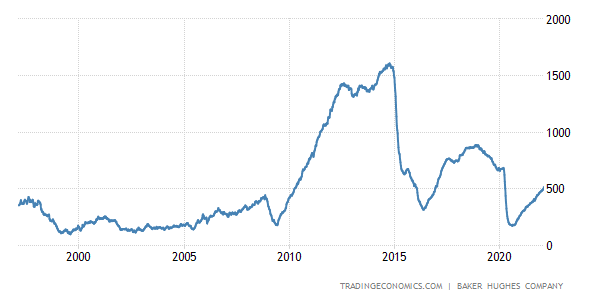
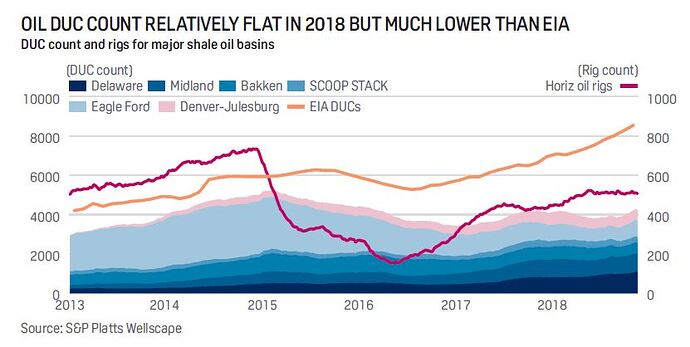
Three major events have shook oil over the last 20 years. The first chart really focuses on the effects of the 2008 financial crisis. If you look beyond that you can see that that it recovered by 2010-2011.

At that time US Shale was really starting to find its stride leading to another bull run up to 2014. You can see this enormous increase in the RIG count of that period.

From Robert Rapier from oilprice:
"To recap, in the first half of 2014, oil prices spent most of the time bouncing between $100/bbl and $105/bbl. But the shale boom had put millions of new barrels of oil into the markets over the course of several years, and by mid-2014 the market was approaching an over-supply situation. The price of oil started to decline, but then in the second half of the year OPEC embarked upon a price war to win back market share that had been lost to the American shale boom.

The result was that the bottom fell out of the oil market. By the end of 2014, the price had declined to $53/bbl. The price remained depressed for all of 2015, and by early 2016 WTI fell below $30/bbl."

Again look at the US rig chart. 2015 did have great oil production numbers but drilling activity went off a cliff. Drilling activity is a leading indicator for production increases. It takes time for a completed well to start producing. Also note that many companies during that time created an inventory of DUC (Drilled, un-completed wells) that were slowly brough to production over the following years anytime prices rose that effectivly kept a lid on prices.

This period of time saw a rough patch for oil and gas and serious uncertainty.

  • OPECs price war
  • Climate change pledges from banks to no longer invest in O&G
  • The rise of electric vehicles
  • Peak oil usage theories
  • The idea that wind and solar was now able to kill off fossil fuels

Pre 2014 finacing was very easy to obtain. Many companies obtained loans against their resources of having X amount of oil worth y dollars that they could drill for. They would simply just keep drilling and cranking up production to increase cash flow. Post 2014 finacing became harder and many producers were held to their actual earning and were no longer rewarded for burning cash. The companies without cash went bankrupt and were bought out. This left us with a new round of more disciplined producers that are not as fast to increase production.

Finally, 2020 Covid hit and the uncertainty rocked everything. Demand went down along with drilling activity. In April of 2020 futures on oil actualy went down to -37. By now you can hopefully see how the last seven years of bust left us completly unprepared for the massive post covid spike of increased fossil fuel usage. With the world really reopening supplies are getting squeezed and we are seeing the resulting price action.

Robert Rapier on a forward outlook:

"The question now is whether the current situation is more like the first half of 2014, or whether it is more like 2011, when prices rose above $100/bbl and largely stayed there for the next three years.

I would argue that we are somewhere in between. In 2011, the markets weren’t oversupplied, but that’s where they were ultimately headed. U.S. oil production has increased by 600,000 barrels per day (bpd) year-over-year, but we are still 1.5 million bpd below the levels just before the Covid-19 pandemic hit the U.S. Thus, with demand largely recovered to pre-pandemic levels, we are still undersupplied relative to two years ago.

Last month OPEC and its allies said they would increase oil production by a total of 400,000 bpd in February. However, the cartel has been undershooting its production targets. That helps keep oil prices high, especially in light of the slow ramp-up of U.S. oil production."

OPEC will always be a wild card you need to watch for. We are supposed to be past the boom and bust cycles of the past and have a more disciplined approach. You will be able to see how that plays out by watching the rig count. Theres a saying that has been a joke in the oilfield since the 80s " Lord, Please give me one more good boom and I promise not to mess it up".

1 Like

Huge thanks for everyone for all the research in this thread, I’ve been using it to brush up on data for the XOM calls play. :pepepray:

7 Likes

Article on CNBC that just came out (2/16/22), reaffirming my thoughts that we are going to end up like the 08 run, and that OPEC and other major countries are not meeting their quotas causing further shortages:

Currently holding just one XOM APR-14 80c.

5 Likes

I am seeing increasing chatter on an imminent Iranian nuclear deal. Iranian oil production has been kept off the market to put pressure on them to stop enrichening uranium. The added supply will take months to have any real effect on markets but news on this may add to volatility in the coming days.

4 Likes

Iran nothing burger imho. At the same time its oil returns to market demand will be increasing from global economy reopening.
I opened more XLE this morning for March expiration and am holding April and May on other energy stocks.

1 Like

Just adding the rig count data here so no one has to search for it on TF:
https://rigcount.bakerhughes.com/

1 Like

“The price could already be in triple-figure territory if not for the nuclear talks between the U.S. and Iran,”

https://www.reuters.com/business/energy/oil-slides-after-france-iran-say-closer-nuclear-deal-2022-02-17/

3 Likes

NOG was checking this out as it has earnings coming end of week. Last 3 quarters have surpassed revenue expectations did miss their EPS last quarter but did post their first net profit margin in what I can see any of their history.

With oil prices trending up at EOY could have another solid earnings and seemingly the share price should continue to tick up leading up to earnings with current world events.

3 Likes

I’m thinking about playing some leaps on oil this year for a longer hold with a sell price target where I’ll cut when it hits and thinking USO to diversify the risk a bit as I wasn’t as comfortable with my leaps in XOM so I cut them all Friday for a 5% loss.

3 Likes

wouldnt xle be a better bet for oil diversification?

2 Likes

I’m thinking of taking a small starter position in XLE and USO leaps in the next week, would like to buy the dip if the Iran deal goes through.

1 Like

Marathon Petroleum (MPC) just had an explosion / fire at their oil refinery near New Orleans today (Monday).

https://www.bloomberg.com/news/articles/2022-02-21/marathon-s-huge-louisiana-oil-refinery-rocked-by-explosion-fire

Marathon Petroleum Corp.’s oil refinery near New Orleans exploded into flames on Monday, threatening to crimp fuel supplies and raise pump prices at a time of already rampant inflation.

The company’s Garyville, Louisiana, plant is one of the nation’s largest and a key supplier of gasoline, diesel and other fuels. Marathon said one person was injured and the blaze that started around 9:30 a.m. local time is now under control.

The fire occurred in a hydrocracker, according to a person familiar with the operation, a crucial price of equipment that breaks heavy petroleum molecules down into lighter products including gasoline. If any damages are significant enough to halt production at the Garyville complex, regional fuel supplies may be stretched.

4 Likes

MRO recieved a price target increase to $27 this am. After it’s recent downfall I’ve added it to a watchlist.