Potential IV Crush Plays - Earnings

A few of us have been trying out double calendars around binary events to profit from the IV crush that can happen if the move ends up more neutral than the price of the options reflected, which is a pretty common scenario. So far the play has been inconsistent, so here’s my first attempt and bringing up the success rate.

I figure a good place to start would be looking at the average historical earnings move and comparing that to the current implied move by the options market, the thought being that it would be worth looking into plays if the options market is pricing in a move that is above average. Obviously, this is just a start because there might be a valid reason that the market expects more volatility for this specific earnings report.

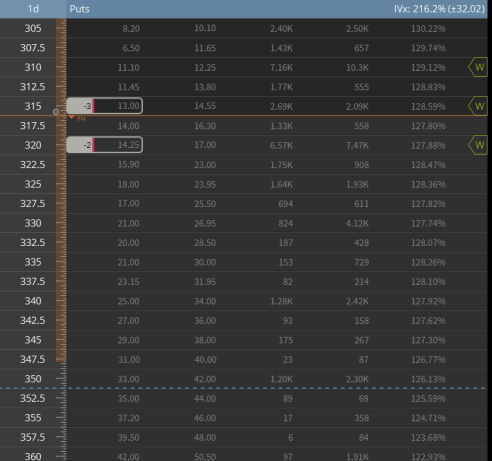
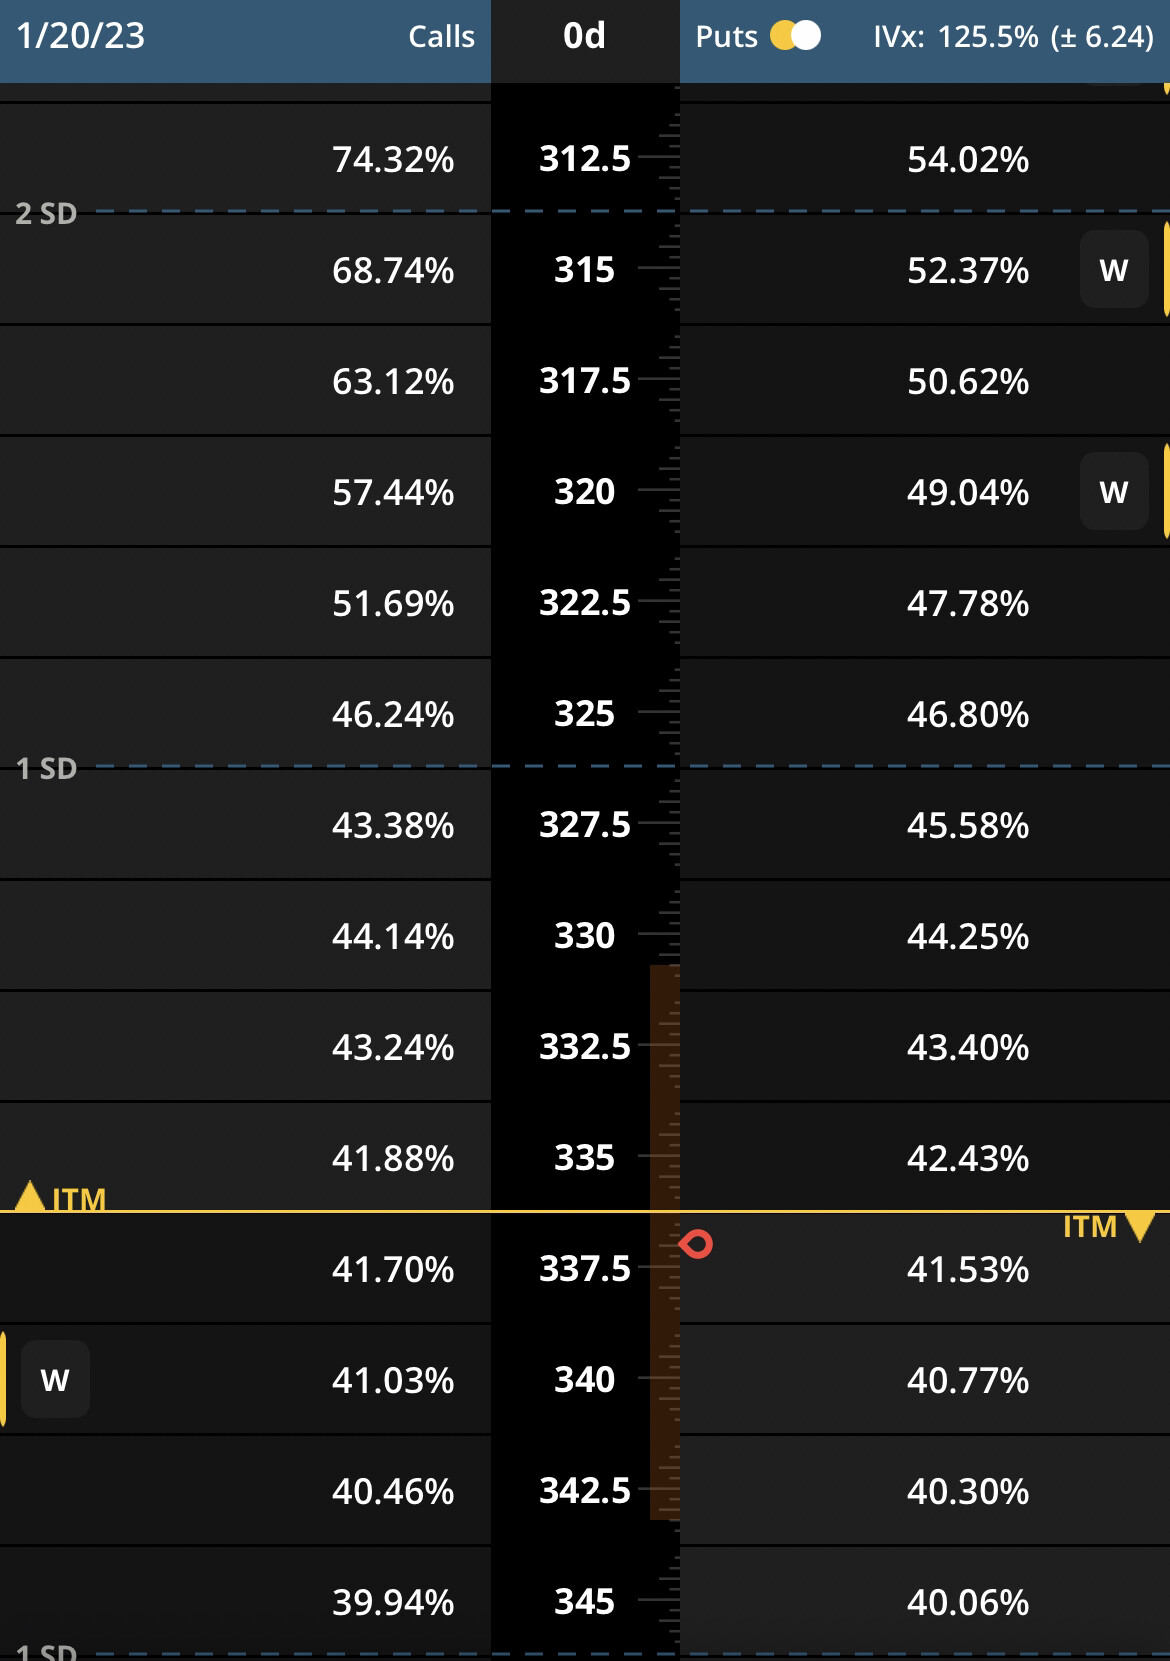
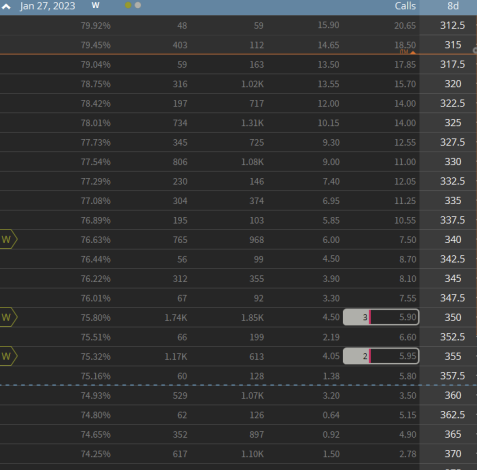
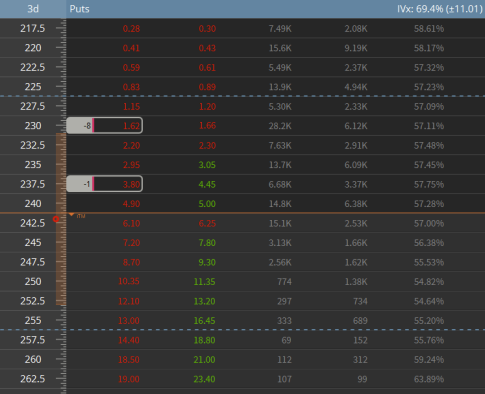
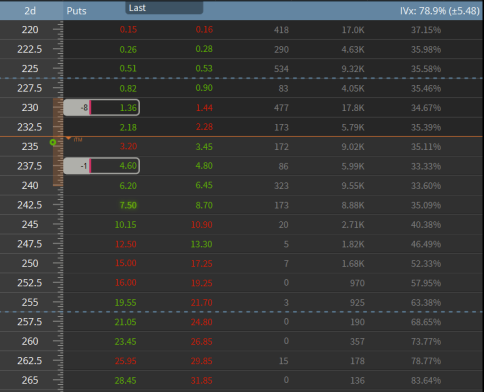
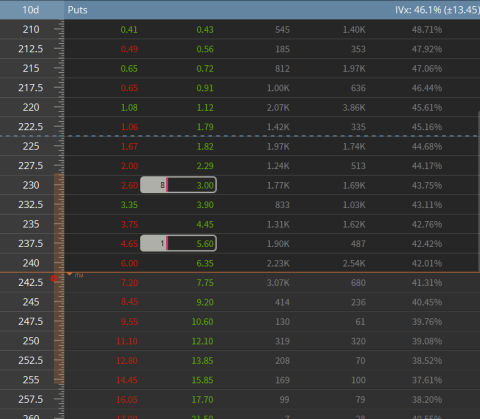
There are a couple of ways you can calculate the implied move, I’m not sure which is best so for this first shot I’m going to try two methods. Firstly Tastyworks’s “IVx” volatility metric. The IVx metric uses a VIX-style calculation to find the expected move for each expiration cycle in the options chain. More information about the IVx calculation can be found here. The second method is the “Implied Move” value from EarningsWatcher. Interestingly, I can’t seem to ever get the same value of “Implied Move” that EarningsWatcher shows, I’ve tried the (ATM straddle price * 0.85) and the (Stock Price) x (IV/100) x [square root (DTE/365)]. Both tend to yield smaller results for options implied move so I’m not sure what they’re doing there. If anyone could shed light on that then that could be a pretty big help!

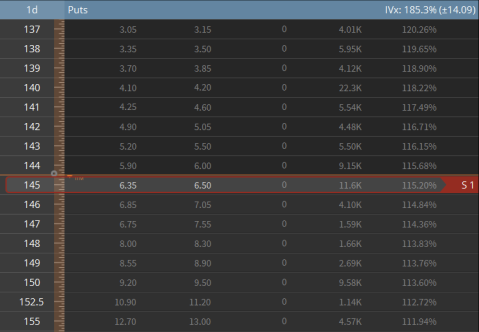
A little note about calendar spreads - a regular calendar spread is long volatility but the IV crush element of binary events such as earnings transforms this play into a short volatility trade. The greeks of the total position will show that it has positive vega but this is misleading because IV across the expiration dates will change differentially. The IV of the shorter-dated option will be more elevated than the longer-dated options and should also experience a greater decrease than the long leg when the event is over.

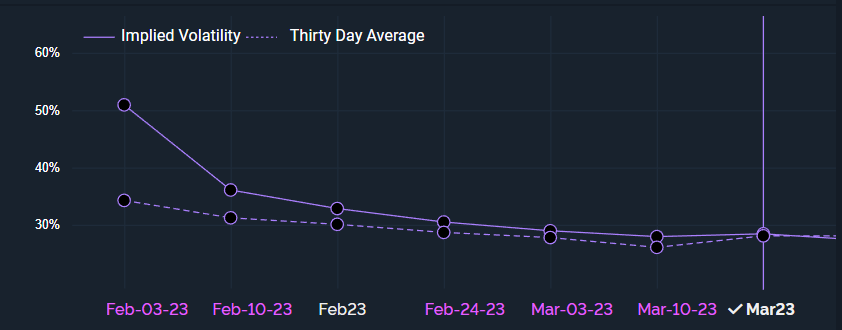
I’ve found most success in entering a position in the last hour before earnings, double calenders do have a positive theta associated with them but sometimes the IV will increase in the days/hours leading up to a report which is bad for us. We want to open the position when IV is at a maximum. It can be difficult to get a fill for the total position, so it’s sometimes easier to open the put calendar and call calendar separately.

I’ve only ever used this play on stocks with weekly options so I have no experience with monthlies, I’ll still include them in the list in case anyone wants to try though. Historical earnings move data comes from EarningsWatcher.

If it turns out that EarningsWatcher is calculating the implied moves for the trading day of the earnings release only and not until expiration then that value could be a better indicator for the monthly expiries since you typically close the calendars the day of/after earnings (you don’t have to though, max profit would be at expiration of the short leg but you require the price to stay within a range).

Monday - 01/30/23
AMC (after market close)
It doesn’t look like there are any plays for Monday.

Tuesday
BMO (before market open)

Ticker Average Historical Move (%) Tastyworks’s IVx Implied move (%) EarningsWatcher Implied Move (%)
$XOM 3.12 3.37 3.75
$PFE 3.59 3.64 4.36
$SYK (monthlies) 3.42 4.64 5.90
$UPS 6.05 5.79 6.34
$GM 4.50 6.32 6.96
$MCO (monthlies) 5.01 7.06 5.83

I don’t want to do this too far in advance because there will be changes in IV and underlying price that affect the implied moves, I’ll probably try to stick to doing these around 24 hours before earnings. It’s definitely intriguing that there is such a large discrepancy between the implied moves, hopefully someone smarter can help solve that issue. Obviously, if the math is wrong then we can’t expect to profit from these.

5 Likes

Thanks for creating this thread! A graphic from EW that I found helpful:

The low-IV ones are not worth the play.

EarningsWatcher seems to have some wrong dates for earnings so it’s possible that I might miss some until I figure out how to use it better, I’m also not sure how to search for companies on there yet :yong:.

Tuesday - 1/31/23
AMC
It doesn’t look like there are any plays for Tuesday AMC

Wednesday - 2/01/23
BMO

Ticker Average Historical Move (%) Tastyworks’s IVx Implied move (%) EarningsWatcher Implied Move (%)
$TMO 3.62 4.32 4.58
$GSK 2.63 3.70 4.05
$NVS (monthlies) 2.32 2.47 3.58
2 Likes

Based on a couple of sources, these tickers came up:

Tue AMC: $AMD $AMGN $SNAP $SYK

Wed BMO: $GSK $MO $NVS $WM

2 Likes

Another interesting chart that I found that could be relevant:


These are supposed to have the most liquid options (which is extremely important for this trade) and also we can get a gauge on whether the options are overpriced or underpriced (based on historical moves).

Thermo Fisher (TMO) seems like a good candidates to take for today (Tuesday Jan 31st). Thermo Fisher reports before open on Wednesday. It’s probably best to set limit orders after 1pm on Tuesday.
Stryker seemed like a good candidate at first but it only has monthly options. The short leg has too much time value for this play imo.

Here is the charted options IV for Thermo Fisher:

Going by this it looks like selling the Feb 3rd options and buying the February 17th options (or later) seems to be the way to go. That being said, it looks like spreads are way too wide on the options for this to be a viable play.

3 Likes

I’m a bit suspicious of the way EarningsWatcher determines implied move. The only information I’ve found about how they do it is a slightly vague “from closest expiration straddle pricing” but the values I calculate from that method seem to be consistently below their number. Not 100% certain that’s not me making a mistake though.

1 Like

Just compiled the data for those tickers here:

Ticker Average Historical Move (%) IVx Implied move (%) EarningsWatcher Implied Move (%)
$AMD 10.97 7.64 8.18
$AMGN 4.27 3.26 3.41
$SNAP 22.84 17.57 20.07
$SYK 3.42 4.33 5.90
$GSK 2.63 3.35 4.05
$MO 3.23 1.95 2.79
$NVS 2.32 2.59 3.58
$WM 3.51 2.54 2.92
5 Likes

Quoting from my journal

What I’m saying is that the IV crush component is hard to estimate. In theory, the IV on the short leg should get closer to the long term IV average but that’s not usually the case as IV on the short leg remains elevated as the market attempts to interpret the earnings results. The immediate post-earnings IV crush seems to vary by ticker and doesn’t really seem very consistent from what I’ve seen. Will look more into how we can estimate this

1 Like

Are you able to see historical IV on your broker? Tastyworks doesn’t show me that so I had to take before and after screenshots but for every ticker I checked there was a significant decrease, even if it wasn’t necessarily in line with the long-term average.

[size=4]NFLX[/size]
[size=4]Short Leg[/size]
before
image
after

[size=4]Long Leg[/size]
before
image
after


[size=4]MSFT[/size]
[size=4]Short Leg[/size]
before
image
after
image
Long Leg
before
image
after
image


[size=4]TSLA[/size]
[size=4]Short leg[/size]
before
image
after
image
[size=4]Long Leg[/size]
before
image
after
image


These were the only ones I managed to take screenshots of but of course it’s possible that there was something that made these 3 work especially well.

1 Like

Note the differential between the IV crushes:

TSLA LONG LEG
-17%

TSLA SHORT LEG
-35%

Delta: 18%

MSFT LONG LEG
-27%

MSFT SHORT LEG
-40%

Delta: 13%

The deltas are pretty far apart and I’m trying to understand the reasons why. We want to maximize the delta so as to get the most gain.

Wednesday - 2/01/23
AMC

Just one here

Ticker Average Historical Move (%) IVx Implied move (%) EarningsWatcher Implied Move (%)
$META 7.61 10.09 9.90

Thursday - 2/02/23
BMO

Ticker Average Historical Move (%) IVx Implied move (%) EarningsWatcher Implied Move (%)
$LLY 4.13 2.85 4.21
$HON 3.01 2.91 3.56
$EL (monthlies) 5.73 5.38 7.16

Nothing too great this time, Thursday’s BMO earnings are illiquid and have overall shitty volatility numbers. Some big names reporting AMC though - will update tomorrow evening.

Some of this IV could also be linked to FOMC and therefore might reduce before earnings.

2 Likes

Thursday - 2/02/23
AMC

Ticker Average Historical Move (%) IVx Implied move (%) EarningsWatcher Implied Move (%)
$AMZN 7.32 8.08 8.41
$GOOGL 5.11 6.17 5.85
$QCOM 6.32 4.62 6.33
$SBUX 4.78 4.95 5.45
$F 5.67 4.64 6.63

Friday - 2/03/23
BMO

Ticker Average Historical Move (%) IVx Implied move (%) EarningsWatcher Implied Move (%)
$SNY (monthlies) 2.54 4.12 5.09
4 Likes

I’m considering only playing these towards the end of the week. The trade is a lot simpler and seems more profitable when OTM options are closing in on worthless.

1 Like

4 Likes

I’ve decided not to include stocks with monthly option expiries, the implied move isn’t really applicable to earnings since it’s the implied move until expiration.
Monday - 2/06/23
AMC

Ticker Average Historical Move (%) IVx Implied move (%) EarningsWatcher Implied Move (%)
$ATVI 6.20 6.98 7.07

Tuesday - 2/07/23
BMO

Ticker Average Historical Move (%) IVx Implied move (%) EarningsWatcher Implied Move (%)
$FISV 4.13 4.43 4.87
$BP 4.08 3.56 4.18

I personally might take a small position on ATVI but in general I’m going to shy away from these plays until EOW when the short legs are closer to expiry.

2 Likes

Thanks for these lists - very helpful. And agreed - was going over the last week’s plays, and it’s really the last two days which seem to have enough of what we are looking for, for this play to work consistently well. Where the extrinsic on the short leg melts much, much more than the long leg. The extrinsic is a function of both theta and vega, and I am not clear yet on how that plays out, will try to figure that out at some point.

One more graph from EarningsWatcher:

1 Like

Ended up taking some positions today, but with a modified setup. We have done setups where:

  • short leg is this week (0 weeks out) and long leg is 1 week out; let’s call this 0-1
  • short leg is this week, and long leg is 2 weeks out; let’s call this 0-2

We have talked about not playing this in the first half of the week, because the IV crush of the long leg seems to be sufficient enough to make returns minimal. Well, we also know that the leg 2 week out doesn’t really have much of this happening. Could the IV crush on the 1-week leg be sufficient to provide greater margins when paired with the 2-week out leg? We’re about to find out.

The other interesting thing - the premium is much less than the 0-1 and 1-2. For BP for example, premiums are:

  • 0-1: $0.32
  • 0-2: $0.51
  • 1-2: $0.20

No such thing as free lunch, so I’m curious where I get hurt. Also… would have been good to paper trade this first, but was at work and 30 mins before market closed… will dig into this more deeply in a bit.

2 Likes

Sorry for my brief hiatus, had a lot of university work all of a sudden but should be back now.

Tuesday - 2/14/23
AMC

Ticker Average Historical Move (%) IVx Implied move (%) EarningsWatcher Implied Move (%)
$ABNB 9.01 8.43 9.17
$SU 4.57 4.50 4.62

Wednesday 2/15/23
BMO

Ticker Average Historical Move (%) IVx Implied move (%) EarningsWatcher Implied Move (%)
$ADI 3.83 3.13 4.33
$GNRC 9.31 9.56 12.51

Nothing looks too great to me here, I’m growing a lot pickier with these plays. Looking for liquidity, close expirations, and a specific price range for each set of contracts.

Are there any updates that we’ve found to this strategy? I see that thanks to notmisa’s backtest it looks like closing the position if price breaches a wing saves money in the long term. Do we still think the best time to open these is towards EOW?

2 Likes

These are the only 4 that seem to make sense today. Will put buys out shortly.

Biggest challenge so far has been to find option chains that are both liquid, and not sub $50. Sub-$50 because otherwise commission eats too much of the margin, which are in the 10-30% range.

I’m still playing early in the week, KO worked out ok today.

1 Like